


All Issues
Chloride levels increase after 13 years of recycled water use in the Salinas Valley
Publication Information
California Agriculture 68(3):68-74. https://doi.org/10.3733/ca.v068n03p68
Published online July 01, 2014
NALT Keywords
Abstract
The use of recycled water for agriculture is a long-term water strategy in California. A study in the 1980s in Monterey County showed recycled water increased soil salinity but not to a level unacceptable for agriculture. Most growers in the northern Salinas Valley have been using it since 1998, and yet providers of the water and many growers are concerned that the sustained use of recycled water might cause deterioration of the soil. An ongoing study, initiated in 2000, compares the changes in soil salinity between a field receiving only well water and eight fields that receive recycled water. In 13 years of data, the average soil salinity parameters at each site were highly correlated with the average water quality values of the recycled water. Soil salinity did increase, though not deleteriously. Of most concern was the accumulation of chloride at four of the sites, to levels above the critical threshold values for chloride-sensitive crops.
Full text
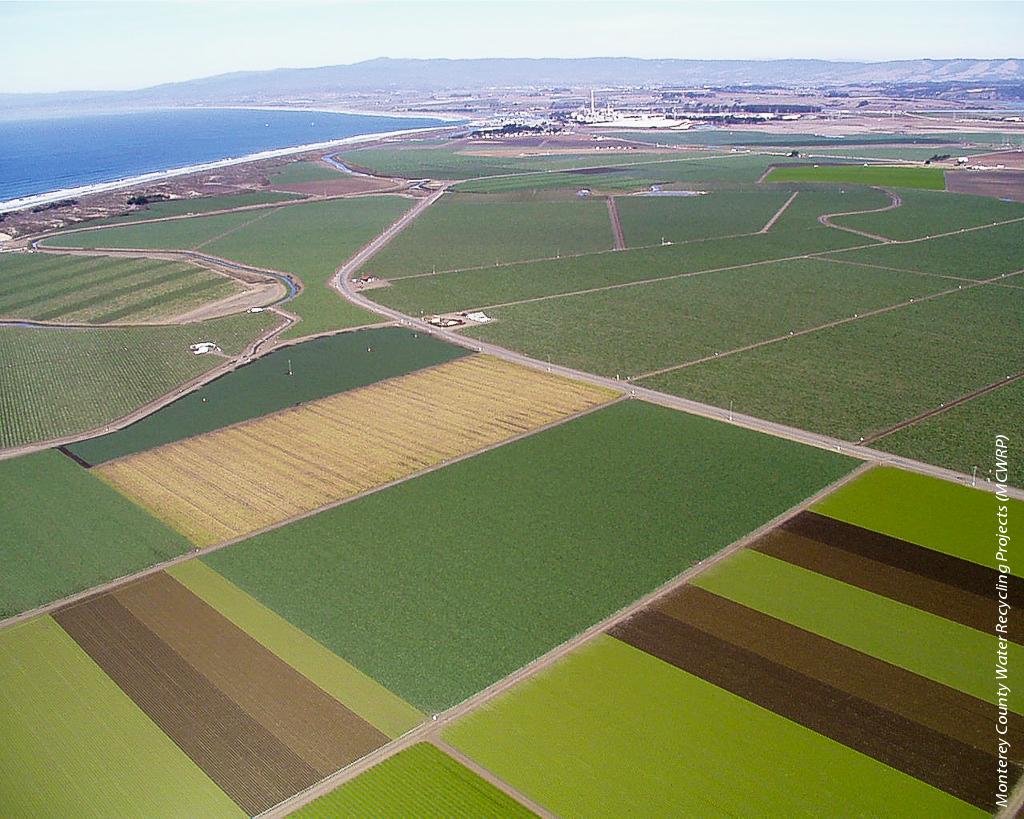
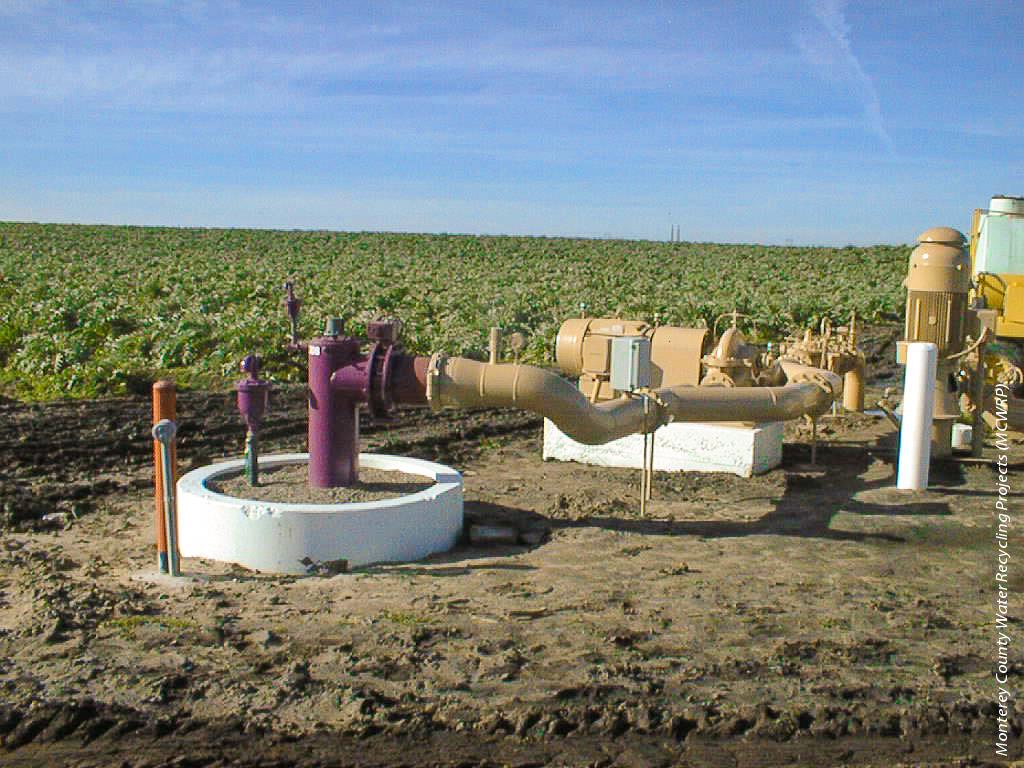
In 1987, California Agriculture described a 5-year study (from 1980 to 1985) evaluating the effects of recycled water use on soil salinity and the quality of cool-season vegetables at one location in the Salinas Valley (Engineering-Science 1987). The Monterey Wastewater Reclamation Study for Agriculture (MWRSA) concluded that soil salinity increased with the use of recycled water for irrigation, but no deleterious effects on crop production were observed. The water was delivered by the Monterey Regional Water Pollution Control Agency (MRWPCA), and the study location was in the Monterey County Water Recycling Projects (MCWRP) area.
As in all irrigated agriculture, increased soil salinity was expected (Richards 1969), and, at the end of the study, concentrations of chloride (Cl), calcium (Ca), magnesium (Mg) and sodium (Na), and the sodium adsorption ratio (SAR) were consistently higher in the soils irrigated with recycled water than in the soils irrigated with well water (Engineering-Science 1987). It was concluded that the higher values were in an acceptable range for agriculture (Oster and Rhoades 1985). Since the study found no differences in soil permeability due to the higher salinities, it appeared that long-term use would not be deleterious to the soils or require mitigation measures.
A study started in 2000 is evaluating possible long-term effects of using various levels of recycled water to irrigate Monterey County strawberry and vegetable fields.
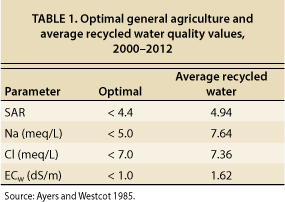
The recycled water in the MWRSA had an SAR value of 5.58, containing 8.35 meq/L (milliequivalents per liter) of Na and 7.03 meq/L of Cl, and an electrical conductivity (ECw) of 1.4 (Engineering-Science 1987). These values were higher than what was considered optimal (table 1). Na concentrations were greater in the shallow soil profiles (1 to 12 inches) than in deeper soil profiles (Burau et al. 1987). In contrast, long-term salinity research indicates that soil salinity is usually greater in the deeper soil profile, because crops take up salts in the shallow soil profile, and irrigation and rainfall leach salts out of the root zone into the lower soil profiles (Rhoades et al. 1992).
In the fall of 1999, after two full seasons of irrigation with the recycled water, some growers in the MCWRP area observed significant increases in soil salinity. The Water Quality and Operations Committee of the MCWRP, a collaborative grower and agency committee, recommended that the agency evaluate the potential problem with salts. A Salt Reduction, Monitoring and Mitigation Plan for the MCWRP was developed that included a long-term soil salinity study (Sheikh et al. 2000). This ongoing study, started in 2000, is evaluating the possible long-term effects from use of varying levels of recycled water (tertiary-treated wastewater) in Monterey County on soil salinity and cool-season vegetable and strawberry production.
The soils in the study area contain relatively high levels of Ca and Mg, but growers also add amendments of these elements to maintain SAR levels that ensure adequate soil permeability (infiltration) due to the high clay content of the soils. The use of recycled water with moderate salt content should not be deleterious to crop production provided there is adequate leaching of the salts out of the root zone from excess irrigation and winter rainfall. However, there is little, if any, long-term assessment of possible adverse soil impacts from recycled water use on salt-sensitive crops grown in coastal California climates.
This paper presents the data from 2000 to 2012 on factors associated with salinity, and a second paper (Platts and Grismer 2014; page 75 , this issue) presents an analysis of the soil hydrology processes behind the salinity data at the test sites.
Water and soil sampling, analysis
Water sampling was conducted throughout the recycled water delivery system as a standard MCWRP monitoring procedure required by permit. For the soil salinity study, the agency added irrigation water quality tests to the monitoring program. First, the undiluted recycled water (MRWPCA's tertiary effluent) was sampled on a weekly basis to determine the levels of salt present in it before blending with the supplemental well water supplied within the distribution system to meet peak irrigation demand. Second, monthly delivery system sampling confirmed the quality of the water received by growers after dilution with supplemental well water. In addition, the quality of the well water delivered to the control site was sampled monthly. These data were used to calculate the annual average quality of water delivered to each site in the study. The water samples were analyzed for pH, ECw, Na, Mg, Cl and K (potassium) by an accredited laboratory run by MRWPCA.
The one control and eight test sites were randomly distributed throughout the area and were chosen based on soil characteristics, drainage systems, types of crops grown (lettuce, cole crops and strawberries), irrigation method and farming practices. The sites had Pacheco clay, clay-loam and sandy loam soils (USDA Soil Conservation Service 1978) and subsurface tile drainage systems, and had been irrigated with recycled water since 1998.
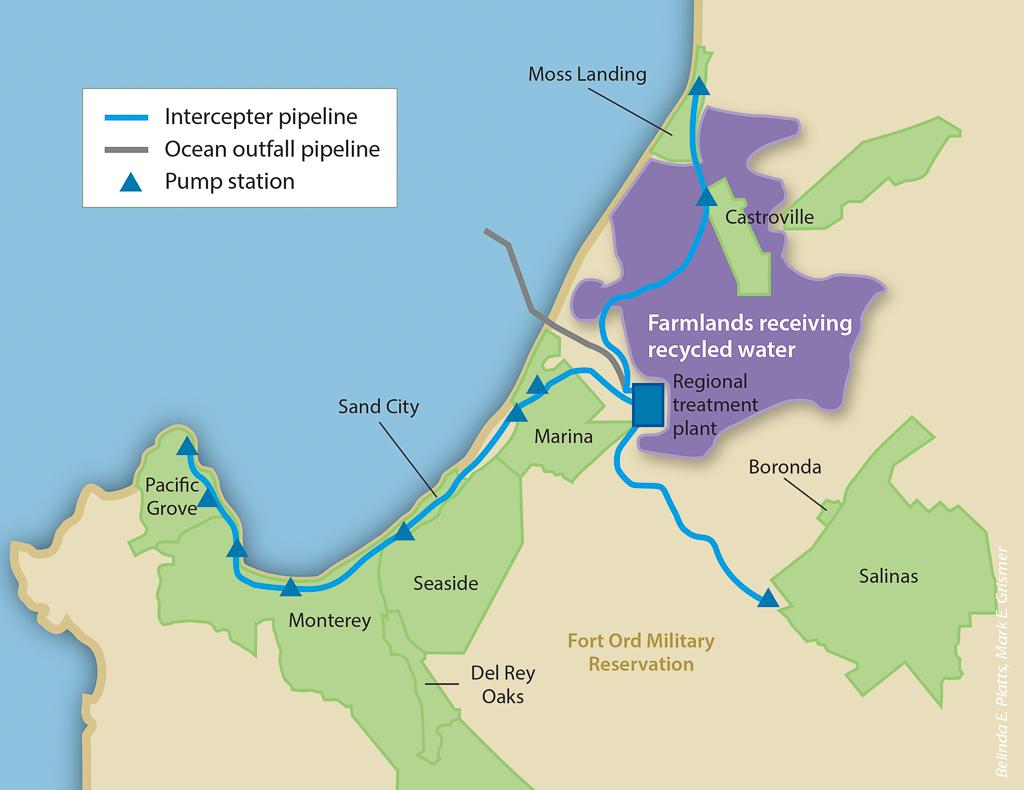
One control and eight test sites in the Monterey County Water Recycling Projects (MCWRP) area were chosen for the study. The control received only well water.
At each site, soil samples were collected from depths of 1 to 12 inches, 12 to 24 inches and 24 to 36 inches at four different locations within 3 feet of a designated global positioning system (GPS) point. Generally, two lettuce or cole crops per year are grown in the region, with plantings often in early spring and a short fallow period in midsummer followed by a second planting. Strawberries are grown once every several years, and during the study period were generally planted in October or November and removed about one year later. Efforts were made to obtain comparable data from year to year by collecting soil samples at three specific times in the production cycle: (1) following winter rains and prior to spring planting, (2) mid–growing season, after harvest of the first crop and (3) at the end of the growing season, after the second crop and before winter rains. However, in most cases, deep percolation (root zone leaching) occurred between soil sampling dates due to the amount of irrigation water used.
Soil samples at the four locations at each site were composited by soil depth. Sample analysis was done by an independent accredited lab (Valley Tech, Tulare, CA) and included pH, electrical conductivity (ECe), extractable cations B (boron), Ca, Mg, Na, and K, and extractable anions Cl, NO3 (nitrate) and SO4 (sulphate). The results from the three sampling dates at each site were averaged to summarize the salinity level for each site for each year.
Applied water quality
On an annual basis, the MRWPCA water recycling facility provides 65% of the water delivered to growers in the area, and supplemental well water makes up the remaining 35%. The supplemental wells are distributed throughout the MCWRP area, and the water is added to the system when irrigation demand is greater than MRWPCA's recycled water production. Applied water at two test sites (2 and 4, with 46% and 58% recycled water, respectively) had optimal values for SAR, Na, Cl and ECw (table 2). Applied water at three test sites (1, 6 and 8, with higher percentages of recycled water) had intermediate water quality values.
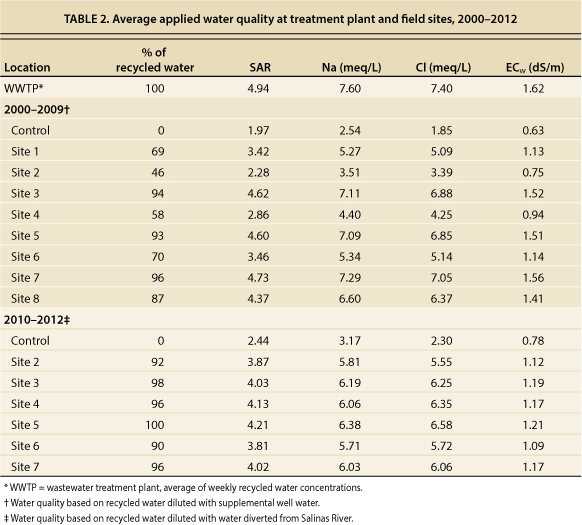
Applied water at three sites (3, 5 and 7) was fairly undiluted recycled water and had the highest levels of SAR, Na, Cl and ECw. Note that in the most recent 3-year period, 2010 to 2012, fractions of recycled water used at sites 2, 4 and 6 all increased due to the addition of another supplemental water source (Salinas River), resulting in higher levels of SAR and related salt concentrations. The weekly Na monitoring data for each site was used to calculate the annual average Na values for the applied water at the field sites.
The recycling facility provides 65% of the water delivered to growers in the MCWRP area.
Salinity data
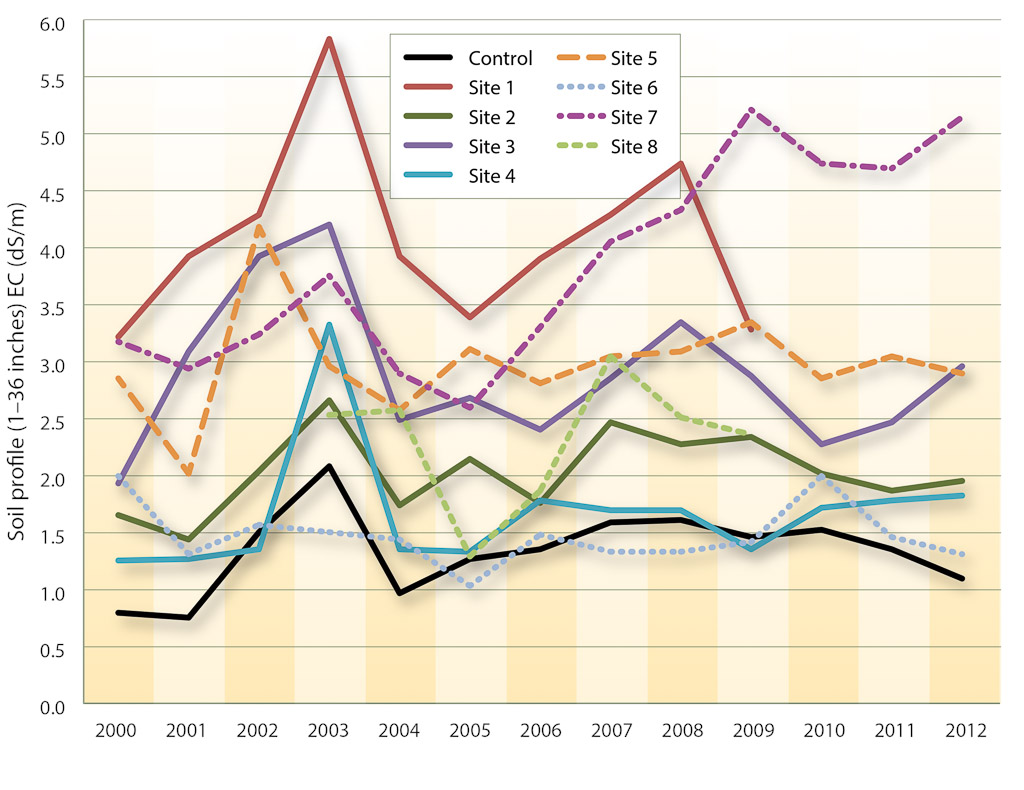
Figures 1 to 4 illustrate the variation in soil EC, Na, Cl and SAR at the sites from 2000 to 2012. Note that in the most recent 3 years, as a result of the increased salinity of the applied water, soil salinity parameters increased at sites 2 and 4. Otherwise, with the exception of site 7, the soil salinity parameters show a fluctuation about a relatively constant value that is likely associated with the salinity of applied water.
Statistically, the whole profile (1 to 36 inches) and each subprofile (e.g., 1 to 12 inches, data not shown) means for the soil salinity parameters (EC, Na, Cl and SAR) were significantly greater (p < 0.01) for the test sites than the control site with the exception of sites 2, 4 and 6 and the SAR values at one soil depth (1 to 12 inches) at site 3. Though not significantly greater, mean soil salinity parameters at sites 2, 4 and 6 were greater nonetheless. Sites 1 and 7, and to a lesser degree site 5, had larger soil EC, Na and Cl values than the other sites, which may be related to unquantified factors including irrigation water quality prior to delivery of recycled water. Overall, soil EC, Na and Cl increased at site 7, while only soil Cl accumulated at site 1. The greatest SAR values were generally at a depth of 24 to 36 inches at all sites (data not shown), suggesting that salts were generally leaching from the root zone deeper into the soil profile. SAR values increased at site 4 following the change in the quality of the applied water. The soil Ca, Mg and SAR values are not as well correlated with the percentage of recycled water, as these are highly influenced by grower amendment practices.


With the exception of sites 5, 7 and 8, the average site soil profile SAR values, which ranged from roughly 2 to 4, suggest that the Ca and Mg ions balancing the Na ions are at satisfactory concentrations, and therefore soil infiltration problems are not anticipated at these sites. However, in the shallow root zone (1 to 12 inches) at the control site and sites 2, 4 and 6, the ECe was 1.5 to 2.0 dS/m (deciSiemens per meter; data not shown), suggesting possible yield losses with lettuce and strawberries, though this is an acceptable level for celery; while at sites 5 and 8, values of ECe between 2.5 and 3.0 dS/m remained acceptable for artichokes, broccoli, cauliflower and rapini. The ECe values of about 4 dS/m found at sites 1 and 7 are just below the threshold yield loss for less-salt-sensitive artichokes (Grieve et al. 2012). While the EC data indicates that decreases in yield are possible based on total salt load, Cl concentrations remained below yield loss thresholds specific to Cl sensitivity for all crops grown in the region at seven of the sites (excluding site 7).
Growers in the project area annually test their soils and make planting decisions based on this data. For example, a grower with fields testing above the recommended Cl threshold for strawberries will not plant strawberries in those fields. In addition, fields that tend to have higher salinity levels for the second vegetable planting of the season will be planted with a more-salt-tolerant vegetable crop. This soil-testing strategy has prevented any significant yield losses during the study (no significant yield losses have been reported to or observed by MRWPCA during the study). In addition, actual yields are highly influenced by market conditions, which were quite variable during the study period; poor market prices result in the growers leaving a certain amount of product unharvested in the field.
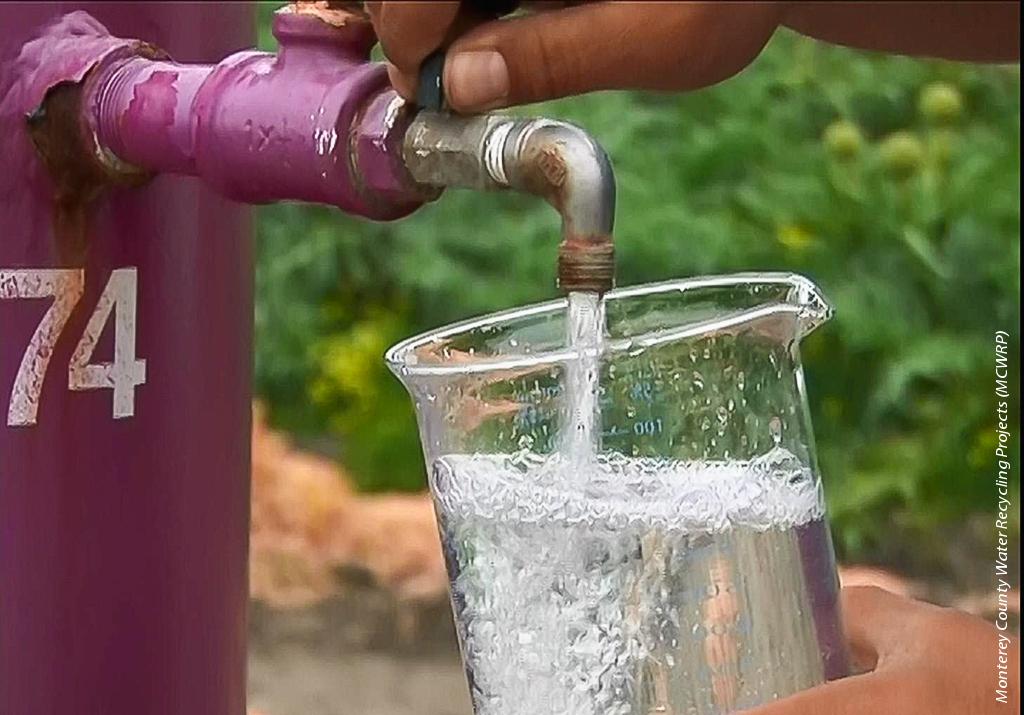
Recycled water was sampled at the treatment plant and at delivery to growers' fields.
Statistical analysis
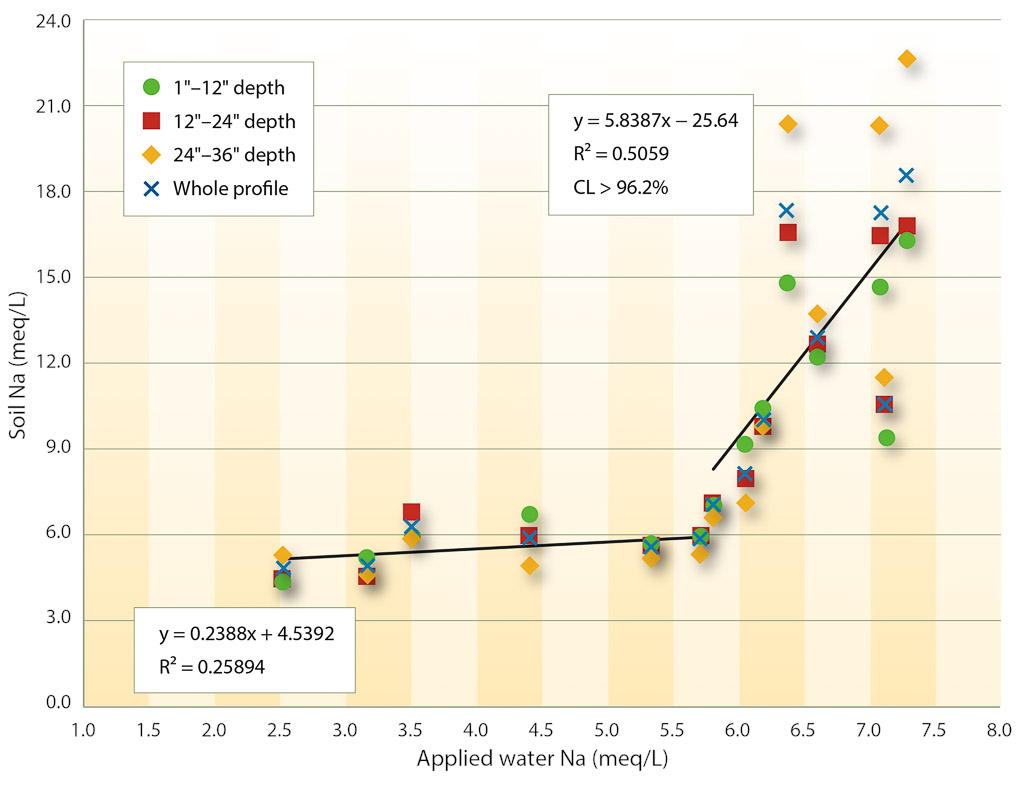
A key agronomic concern is the relationship between applied water salinity, the resulting soil salinity and its potential adverse impacts on crop yields. Figures 1 to 4 clearly demonstrate the variability of soil salinity between sites and over time. In contrast, figures 5 to 8 illustrate the dependence of average soil salinity parameters regardless of site on applied water salinity parameters during the periods 2000 to 2009 and 2010 to 2012.
As anticipated, increased applied water ECw resulted in greater soil EC, particularly in the shallow (1 to 12 inches) portion of the soil profile. While the individual depth interval linear regression slopes did not differ significantly, the soil profile ECe was significantly correlated with the applied water EC, and the slope shown in figure 5 was significant (CL = confidence level). The linear regression slope indicates that the root zone soil EC averages were about twice those of the applied water ECw. However, the shallow soil (1 to 12 inches) EC was only about 7% greater than that deeper in the soil profile (12 to 36 inches).

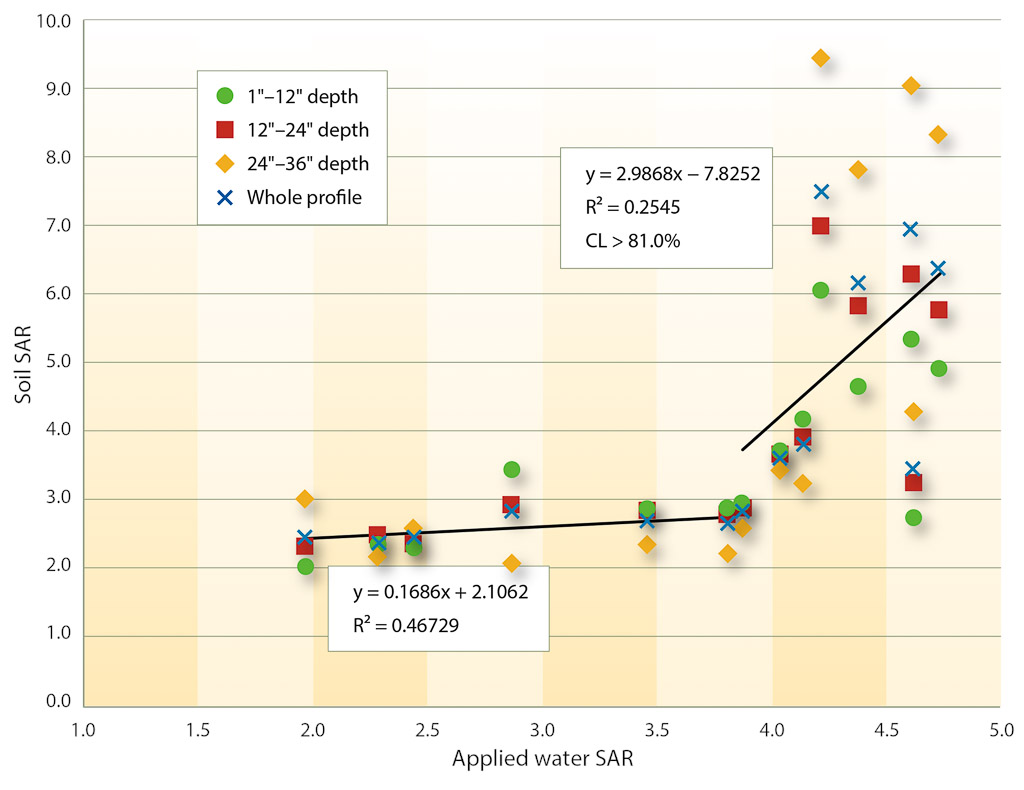
Compared with EC, soil Na, Cl and SAR values showed much less dependence on applied water values up to thresholds of approximately 5.5 meq/L for Na (fig. 6) and Cl (fig. 7) and about 4 for SAR (fig. 8). At applied water values greater than these, soil Na, Cl and SAR values increased dramatically, though with considerable variability. When applied water values for Na, Cl and SAR were below the thresholds, soil values were equivalent to the values of the applied water, suggesting the applied water was leaching through the profile. Leaching of Na deeper into the soil is evident from the increasing linear regression slopes (not shown), with soil Na ranging from approximately four times that of the applied water Na at 1 to 12 inches, to five times at 12 to 24 inches and more than eight times at 24 to 36 inches, and averaging nearly six times for the soil profile as a whole.
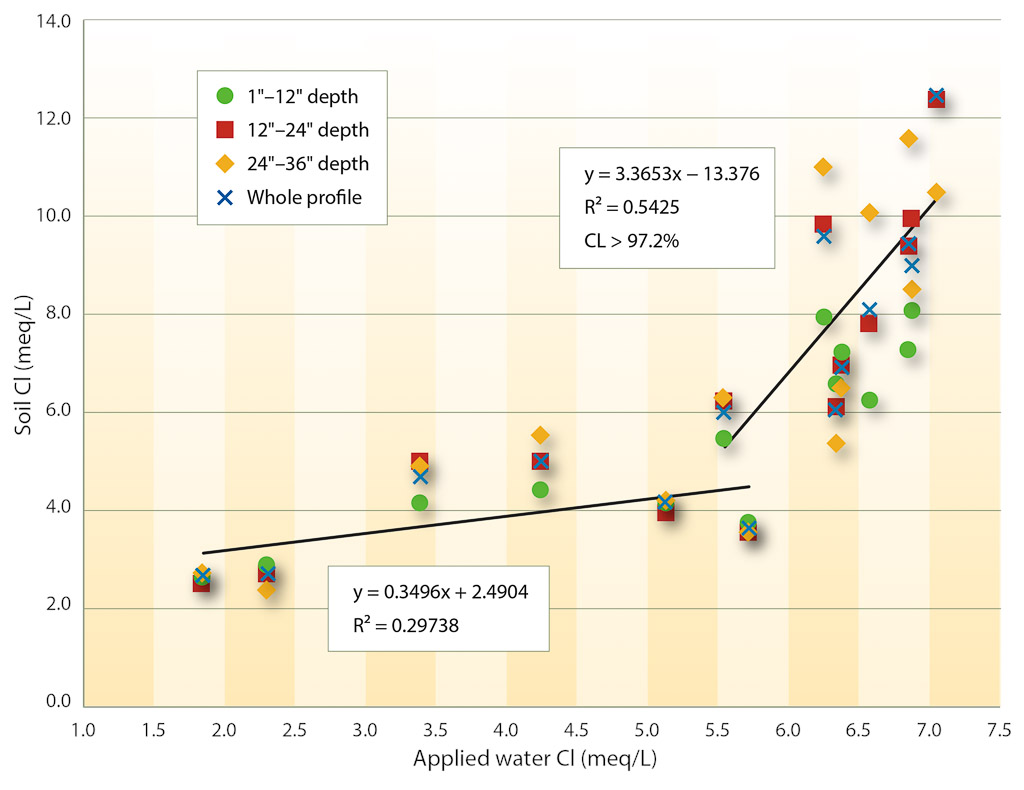
Not surprisingly, the dependence of soil Cl on applied water Cl shows a similar relationship to that of Na (fig. 7), though the increases in soil Cl at applied water values greater than about 5.5 meq/L across the soil subprofiles are less than those for Na. This likely reflects the greater mobility of Cl in the soil compared to Na. It is of major concern that at applied water Cl values more than 5.5 meq/L, soil Cl concentrations increased across all depths.
Soil SAR values roughly match those of the applied water SAR values up to about 4, after which soil SAR values are about 1.5 times greater than the values of the applied water, though the correlation of soil SAR and applied water SAR was less than significant (CL < 95%).
These results indicate that the effect of the quality of applied water on soil salinity is dependent on the level of salts present in the applied water. It is important to note that there may be other factors responsible for the variation in soil salinity parameter values, including growers’ use of soil amendments, and the combined effects of applied water and winter rainfall leaching must be considered. A second paper in this issue contains an analysis of the data from the perspective of soil water balance and addresses these effects (Platts and Grismer 2014, page 75 ).
Accumulation of chloride
As competition for water supplies intensifies and associated sea water intrusion affects the use of well water in coastal California areas, the long-term effects on soil salinity from use of recycled water are important to investigate. Our primary objective was to quantify the changes in salinity in Monterey County fields under intensive production and determine whether the long-term use of recycled water there has been deleterious to the types of soils in the area.
Our analysis of study data from 2000 to 2012 supports the general conclusions of the MWRSA in the 1980s: The use of recycled water has caused an increase in soil salinity in the area; however, SAR values are not deleterious and Na has shown little accumulation in the rooting zone (1 to 12 inches).
Although MRWPCA has worked to reduce the levels of Na and Cl in the water delivered to growers, there has been accumulation of Cl and increased ECe values in the soil profile that were not documented during the earlier study. It appears that winter rainfall has been inadequate to leach out the Cl and reduce ECe. This accumulation of Cl needs to be mitigated in order for growers to continue producing high yields of chloride-sensitive crops such as strawberries and leafy greens. Mitigation options include eliminating amendments that contain Cl, increasing the leaching fraction and improving drainage. Given that using recycled water is an important water strategy in California, further research may be needed to determine the cause of the Cl accumulation and to develop effective mitigation strategies when recycled water is used to grow chloride- and salt-sensitive crops.
Citations
Chloride levels increase after 13 years of recycled water use in the Salinas Valley

