


All Issues
Converting oak woodland or savanna to vineyards may stress groundwater supply in summer
Publication Information
California Agriculture 66(4):144-152. https://doi.org/10.3733/ca.v066n04p144
Published online October 01, 2012
NALT Keywords
Abstract
Water resources are important to land-use planning, especially in regions where converting native oak woodlands or savannas to wine grape vineyards may affect the amount of water available for restoring salmon runs. Research has shown that woodland conversion to grasslands (for possible rangeland grazing) leads to greater and more sustained stream flow and groundwater recharge; however, little information is available about woodland conversion to vineyards. To inform resource managers and planners, we developed a water balance model for soil and applied it to vineyards, native oak woodlands and annual grasslands to evaluate their relative use of groundwater. We applied the model to Sonoma County, using climate data from 1999 to 2011, and determined that oak tree canopy coverage of 40% to 60% results in annual groundwater extraction equivalent to that of an established irrigated vineyard. However, vineyard groundwater use far exceeded that of oak woodlands in late summer to early fall, which could further stress already affected groundwater resources. We also evaluated the prediction sensitivity of the model to key parameters associated with rain levels, soil water-holding capacity and irrigation management.
Full text
Wine grape production in California coastal counties has increased steadily during the past few decades, often resulting in the conversion of native oak woodlands or savannas into vineyards. Generally, oak woodlands have tree canopy covers greater than about 40% by area, while oak savannas are predominantly grasslands interspersed with oaks. Concerns about oak woodland and savanna conversions have been raised in terms of losses in landscape ecological diversity (Heaton and Merenlender 2000), adverse impacts on soils (Jackson et al. 1990), soil erosion, water quality (Hinckley and Matson 2011) and water quantity. One community concerned about vineyard expansions referred to them as the “tentacles of the wine-grape octopus” (Parrish 2011), and local scientists in Sonoma County have raised concerns about biodiversity (Community Foundation 2009). These concerns are amplified by climate change, which increases plant water demands, possibly resulting in decreased groundwater availability. And yet, wine grape (and associated wine) production is the leading agricultural commodity in California in terms of net dollar value.
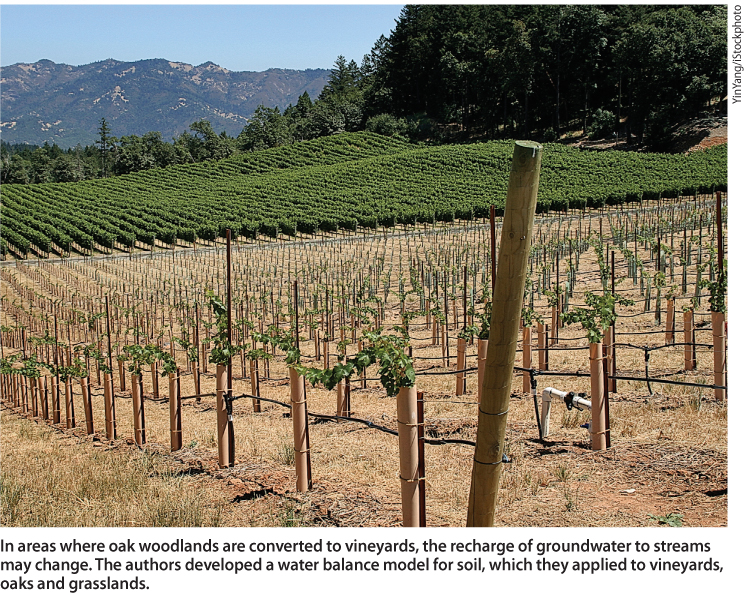
In areas where oak woodlands are converted to vineyards, the recharge of groundwater to streams may change. The authors developed a water balance model for soil, which they applied to vineyards, oaks and grasslands.
In Sonoma County, wine grape production increased from less than 50,000 acres in 1998 (Merenlender 2000) to a peak of 70,000 acres in 2002 and has leveled off at around 60,000 acres during the past decade (fig. 1). Concerns about the impacts of vineyard water use on salmon runs are focused here (Lohse et al. 2008) because the county includes a large part of the Russian River watershed.
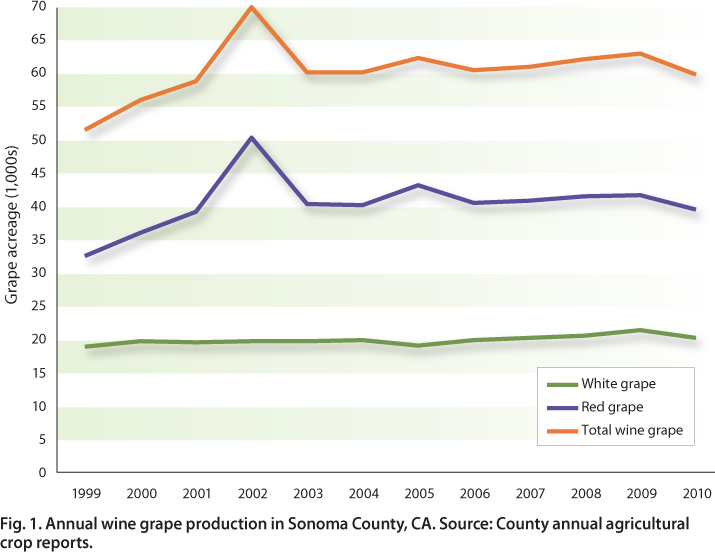
Fig. 1. Annual wine grape production in Sonoma County, CA. Source: County annual agricultural crop reports.
Water use, groundwater recharge
Hydrologists have long been interested in the impacts on soil water conditions and groundwater recharge when converting native grasslands or woodland to agriculture in the world's semiarid and arid regions. Hydrologic analyses conducted decades ago at the UC Hopland Research and Extension Center in coastal Mendocino County considered land conversion in terms of watershed water yields (see page 145); Burgy and Adams (1977) characterized the focus at that time:
Quantitative studies of the hydrologic responses of watersheds where dense vegetative cover has been replaced with range and forage grasses have consistently shown increases up to 50% or more (equivalent to 3- to 5 acre-inches per acre) in annual runoff over long periods of measurement. These runoff studies cover the variety of conditions found in Northern and Central California. About half of the yield increase occurs in the latter portion of the season, giving usable flow in dry periods. The balance of the increase is produced as increased outflow during the post-storm periods.
After oak woodlands were converted to annual grassland, the researchers found increased storm runoff volumes and the establishment of perennial summer stream flows. Base flows had increased and overall groundwater demand dropped when oaks were removed. Currently, watershed management encompasses a broader perspective, considering the land conversion impacts on ecological diversity, soils and water quality.
Similar observations have been made of increased groundwater recharge following the conversion of native land use (rangeland) to agriculture in the U.S. Southwest, Central Plains and High Plains (Gurdak et al. 2007; McMahon et al. 2006; Scanlon et al. 2005), and the Murray-Darling basin of Australia following conversion of native woodland (mallees) to dryland farming and pasture (Thorburn et al. 1991).
Scanlon et al. (2005) noted that groundwater recharge under rangeland use is typically nonexistent in arid regions and quite small in some semiarid regions (? 1 millimeter per year); it increases to roughly tens of millimeters annually in dryland agriculture and hundreds of millimeters in irrigated agriculture. The annual recharge rate in semiarid regions is likely rainfall dependent; for example, in a drip-irrigated coastal orchard, Grismer et al. (2000) measured rainfall-driven groundwater recharge rates of about 180 millimeters per year in both irrigated and fallow areas from 1996 to 1998.
Clearly, when regional water supply allocations are based on water balances that include groundwater resources, rates of groundwater recharge and lag times to the depths associated with different land uses are critical (Grismer 2012; Sophocleous 2005). Scanlon et al. (2005) underscored that developing “sustainable land-uses requires quantitative knowledge of the linkages between ecosystem change, recharge and groundwater quality.” An effort to understand water use in oak woodlands or savannas in terms of these linkages has been under way during the past several years.
Glossary
Crop coefficient (Kc): Ratio of actual crop water use to reference ETo; used to determine irrigation water demand in vineyards and other crops.
Effective rainfall: Fraction of total rain that infiltrates the soil after losses to leaf interception, surface runoff, depression storage and evaporation.
Evapotranspiration, plant: Sum of soil water and canopy (leaf) evaporation, plus plant transpiration, a process in which water moves through a plant or tree and is subsequently lost through stomata in the leaves.
Evapotranspiration, consumptive use (ETc): Root extraction of available soil water used in plant transpiration.
Evapotranspiration, reference (ETo): Evapotranspiration possible from a tall fescue grass crop when there is no limitation on available soil water.
Groundwater: Soil water stored in the root zone, or the combination of this and deep groundwater below the root zone, stored in water tables or aquifers.
Groundwater recharge: In the model, infiltration water that exceeds the capacity of the root zone compartment and percolates to deep groundwater below; such recharge typically occurs later in the rainy (winter) season.
Runoff: That part of the precipitation that appears in surface streams; may come either from the surface, or from shallow groundwater (the latter is usually referred to as interflow).
Soil water balance: Relatively simple model that accounts for daily changes in water storage in the root zone, associated with such processes as root water extraction (ETc), infiltration by rain or irrigation, and see page losses to groundwater.
Water inputs to the root zone: Include effective rainfall (the fraction of total rain that infiltrates the soil after losses to leaf interception, surface runoff, depression storage, and evaporation) and irrigation (in vineyards only in this study).
Water yield: Runoff from the drainage basin, including groundwater outflow that appears in the stream plus groundwater outflow that leaves the basin underground. Roughly, at the basin scale, water yield is the net precipitation minus the total evapotranspiration.
Water use in oak woodland, grassland
While an understanding of vineyard water use has developed during the past few decades, only in the past several years has there been research directed at measuring rates of water use in native oak woodland and grassland systems, and their possible impacts on groundwater resources (see box; fig. 2).
A closer look: The hydrologic cycle
While Earth's total water content is virtually constant, water itself continually changes state between liquid, solid and gas (fig. 2). It also moves and resides in different places, or compartments, shifting at different rates between them.
Hydrologists view soil water balances partly in terms of water residence times. Water resides for different lengths of time in the atmosphere, on the soil surface, and within the soil root zone, a stream or groundwater. It may take a few minutes for a drop of water to evaporate from a leaf, or it may exist frozen in a glacier for 10,000 years.
When large amounts of water shift suddenly due to human use or natural causes, the species and ecosystem services supported in each compartment shift. If municipalities or growers withdraw a large amount of well or stream water in a drought, it could affect species dependent upon the stream, and groundwater levels may not recover for months, or even years.
Scientists develop models to better understand soil water balances based on conditions in a specific water basin. This study marshals data from a 12-year period in Sonoma County, a major part of the Russian River basin, and estimates water movements.
— Janet White

Fig. 2. The hydrologic cycle. Adapted from Encyclopedia of the Earth (Hubbart JA, et al. 2010, www.eoearth.org/article/Hydrologic_cycle ).
Teuling et al. (2006) summarized the relationships between soil moisture and plant evapotranspiration (ETc) for a broad range of grasslands, native brush, tree and savanna landscapes across the world, in an effort to establish the parameters for regional and global atmospheric modeling. Generally, they found that evapotranspiration rates declined exponentially with decreasing soil moisture, which was later confirmed by Chen, Baldocchi et al. (2008) and Chen, Rubin et al. (2008) for California oak savannas.
Baldocchi et al. (2004) quantified the rates of canopy evaporation to soil moisture in California oak woodland and grasslands and found that ETc rates for the grasslands declined when volumetric water content dropped below 15%, corresponding to a soil water potential of ?1.5 mega-Pascals (MPa). (Soil water potential is the measure of the relative strength of water attachment to soil; the more negative the “potential,” the more tightly bound the soil water.) They found that at soil water potentials below ?2.0 MPa, transpiration in grasslands effectively ceased and the grass senesced. On the other hand, the oak trees continued to transpire, albeit at low rates, under very dry soil conditions (soil water potentials less than ?4.0 MPa), probably due to deep root access to groundwater. Overall, annual woodland ETc was about 380 millimeters at about 40% canopy coverage, while ETc for grasslands was about 300 millimeters.
Miller et al. (2010) recorded groundwater uptake by California oak trees at rates ranging from 4 to 25 millimeters per month during June, July and August, representing about 80% of total ETc. They suggested that “blue oaks should be considered obligate phreatophytes,” that is, water-loving plants similar to, for example, riverbank willows. They noted that available groundwater, including deep soil storage, provides a buffer to changes in the native oak tree hydroclimate.
Following up on earlier studies of oak trees, David et al. (2004) and Baldocchi et al. (2010) noted that the adaptation potential of savanna vegetation differed to accommodate low soil moisture conditions during the summer and fall in Mediterranean climates. In sparse evergreen oak woodlands of southern Portugal, David et al. (2004) monitored sap flows (water use) in eight points of a Holm oak (Quercus rotundifolia) stem over 2 years (May 1996 to August 1998). Leaf water potentials, canopy conductance, whole-plant hydraulic conductance and meteorological processes were also measured, and all evidence indicated that the trees did not suffer water stress and remained adequately watered throughout the 2 years. The greatest evapotranspiration rates occurred during the summer when little, if any, rain or available soil moisture was accessible, suggesting that the root system's direct access to a 42-foot-deep water table met the tree's water demand.
Likewise, Paço et al. (2009) noted in Portugal that grass transpiration stopped during the summer as surface soils dried, but trees continued transpiring because of deep root access to groundwater. Tree transpiration represented more than half of the ecosystem's transpiration, in spite of the low tree density (crown cover of 21%). Transpiration accounted for 76% and tree-canopy leaf rainfall interception loss for only 24% of overall tree evaporation.
Baldocchi et al. (2010) examined multiple years of data from five comparable evergreen oak woodlands in France, Italy, Portugal and California. Confirming a previous study of California oaks (Baldocchi and Xu 2007), they found that Mediterranean oaks survived in the seasonally hot/dry, wet/cool conditions by ensuring that their ETc was less than the available water supply.
Lastly, Fisher et al. (2007) found that water use (sap flow) in Sierra Nevada oak woodland continued through the night during summer and fall, underscoring that groundwater satisfied this continuous water demand.
Vineyard water use
Vineyard water use once vines are established has been extensively studied to develop appropriate irrigation management and scheduling and to achieve particular grape quality and yields. Allen et al. (1998) summarized some of the original evapotranspiration (ETc) crop coefficients (referred to as Kc, the ratio of actual crop water use to reference ETo) used to determine irrigation water demand in vineyards. Pritchard (2010) refined them for California wine grape production, as did Caprile (2007) for the North Coast, including Sonoma County.
Grapevines are fairly drought tolerant and can be managed with deficit irrigation to obtain the levels of sugars, tannins and acids desired by the winemaker. For premium wine grape production, the plants are often water stressed in late summer or fall to reach desirable grape sugar and tannin levels, with less consideration of yield. Following grape harvest, the vines are largely dormant, and winter rains effectively leach soils and replenish water available in the root zone for bud break in the late spring.
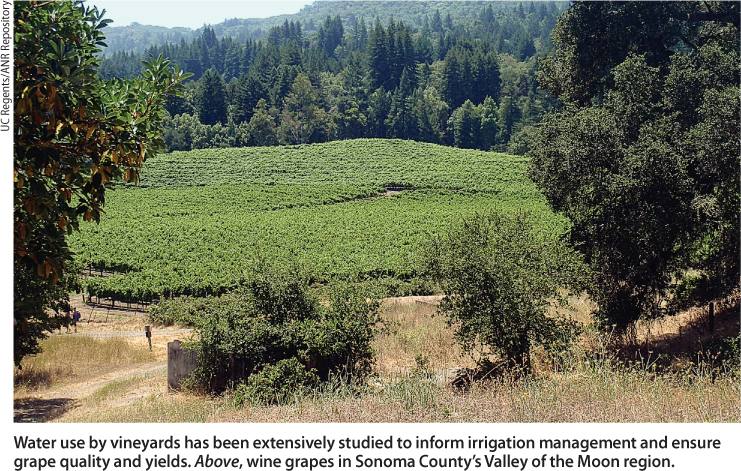
Water use by vineyards has been extensively studied to inform irrigation management and ensure grape quality and yields. Above, wine grapes in Sonoma County's Valley of the Moon region.
Study objectives
We hypothesized that following vineyard establishment, annual groundwater recharge exceeds that from oak savannas. Based on our observations of tree densities, our corollary hypothesis was that a certain percentage of oak tree canopy coverage (i.e., areal tree density) alternatively results in annual water use or groundwater recharge equivalent to that from a vineyard in the same landscape.
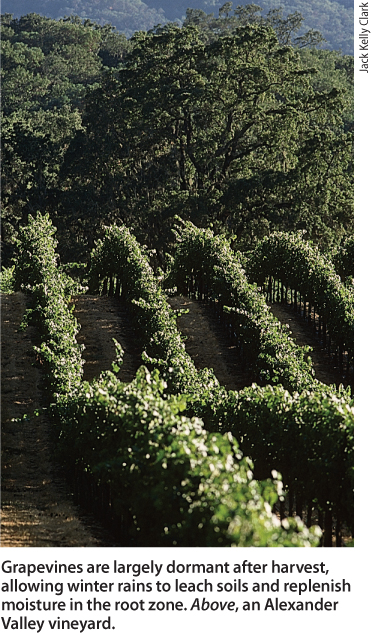
Grapevines are largely dormant after harvest, allowing winter rains to leach soils and replenish moisture in the root zone. Above, an Alexander Valley vineyard.
Our objectives were to determine daily and annual soil water use and deep percolation (recharge) rates from a vineyard and oak savanna or woodland under average climate conditions of the past decade in Sonoma County, and to determine the amount of tree canopy coverage that would result in net groundwater use or net recharge equivalent to that of a vineyard.
Soil water balance methodology
We based our soil water process modeling on daily water balances in the root zones of a hypothetical vineyard, grassland and oak tree. Soil water balance is a relatively simple model that accounts for daily changes in soil water storage of the root zone associated with such processes as root water extraction (ETc), infiltration by rain or irrigation and deep percolation losses to groundwater. We then combined the grassland and oak tree balances to create one balance for an oak woodland savanna of variable tree density.
Water inputs to the root zone include effective rainfall (the fraction of total rain that infiltrates the soil after losses to leaf interception, surface runoff and depression storage, and evaporation) and irrigation (vineyard only). Plant consumptive water use (ETc), that is, water taken up by the grass or trees, removes available soil moisture from the root zone.
In the model (fig. 3), oak trees were allowed to extract groundwater to meet ETc demand when available soil moisture was zero. No additional water source was available to the grasslands beyond root zone soil moisture, and in the vineyard ETc demand in excess of available soil moisture was met through irrigation (groundwater pumping). Irrigation events were triggered when water was depleted in the root zone to a specified fraction (maximum allowable depletion, MAD) of its available water capacity.
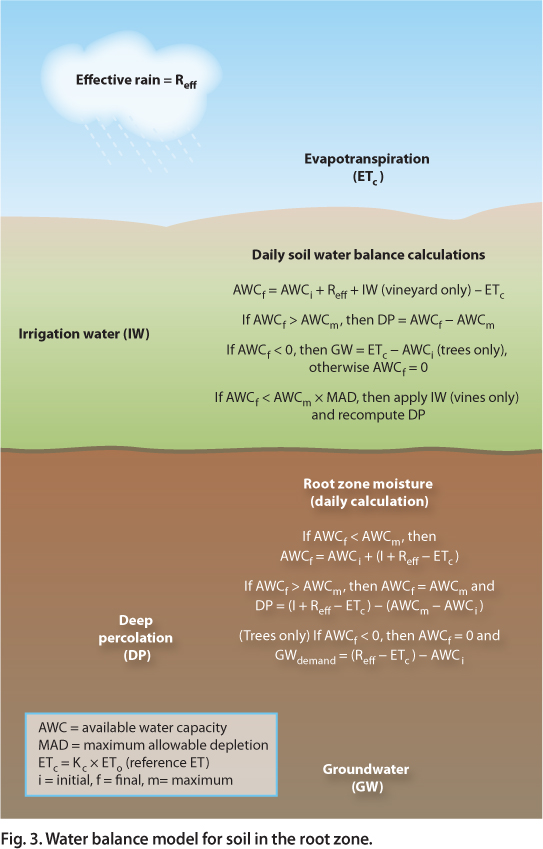
Effective rain (plus irrigation for grapevines) minus plant consumptive use that was in excess of available water storage capacity in soil in the root zone became deep percolation or groundwater recharge. Grismer et al. (2000) observed that rain-driven groundwater recharge reached depths of nearly 18 feet within 4 to 6 months in drip-irrigated coastal orchards; therefore, we assumed that lag times for groundwater recharge (Grismer 2012) were likely less than 1 year. In other words, the previous year's recharge was available for irrigation pumping in the next year. In comparing oak savannas with vineyards, we focused on annual groundwater use for each system.
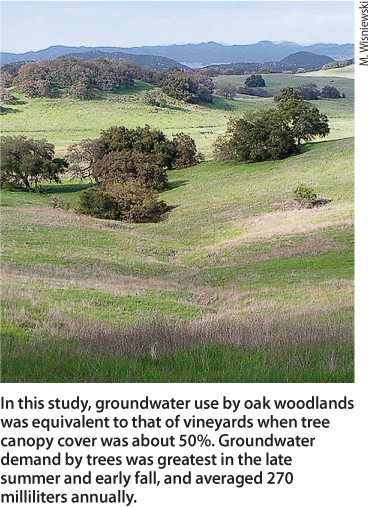
In this study, groundwater use by oak woodlands was equivalent to that of vineyards when tree canopy cover was about 50%. Groundwater demand by trees was greatest in the late summer and early fall, and averaged 270 milliliters annually.
To run the model, we used reference evapotranspiration (ETo) and rainfall depths averaged daily from four meteorological stations across Sonoma County (Bennett Valley, East Petaluma, Santa Rosa and Windsor) to develop a continuous, approximately 13-year record as input data. We used seasonally dependent Kc values for plant consumptive use from Allen et al. (1998) for grasses and Caprile (2007) for North Coast wine grape vineyards (table 1). The original Kc values for oak trees were derived from those for olives (Allen et al. 1998) and modified based on studies by Baldocchi et al. (2004), which indicated that oak tree ETc was 40% to 50% of annual ETo in the Sierra foothills.
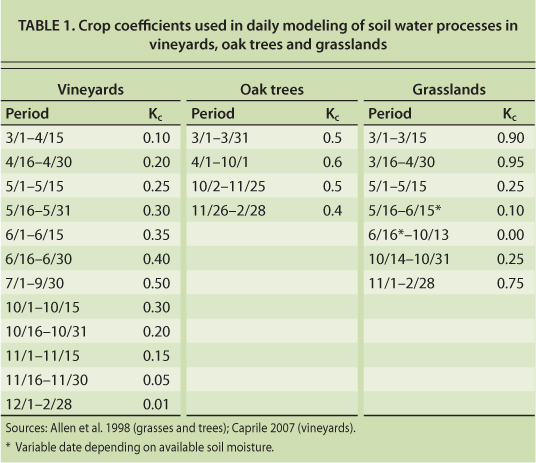
TABLE 1. Crop coefficients used in daily modeling of soil water processes in vineyards, oak trees and grasslands
In this model, plant consumptive use (as annual fractions of ETo) was consistent with published studies: 23% for the vineyards and 52% for oak trees (the results were slightly higher in our study's cooler and wetter environment than in that of Baldocchi et al. [2004]). Estimated values for maximum available water capacity (AWCm), effective rain fraction, irrigation and maximum allowable depletion were used, assuming loam soils and a water-table aquifer at 20 to 25 feet below the ground surface.
After running the model with the initial assumed parameter values for available water capacity (AWC), maximum allowable depletion, effective rain fraction and groundwater depth, we evaluated the sensitivity of calculated groundwater use values to these estimated parameters. This sensitivity analysis provided guidance on optimal parameter selection as well as a sense of the robustness of model predictions (that is, how much error in groundwater use calculations might be expected if assumed parameter values were incorrect).
Estimating water needs
In presenting the results, we set each year beginning on March 1, when water conditions in soil are most likely to be at or near capacity (table 2). Though net possible annual water demand (ETo minus rain) ranged widely from 140 millimeters in 2005 to 790 millimeters in 2008, the applied water needed for vineyard production remained roughly the same from year to year, at about 300 millimeters. In the model, applied water was typically given in three large irrigations, but the depth of irrigation required was independent of irrigation frequency so that equivalent results would have been obtained if, for example, six 50-millimeter irrigations had been applied.
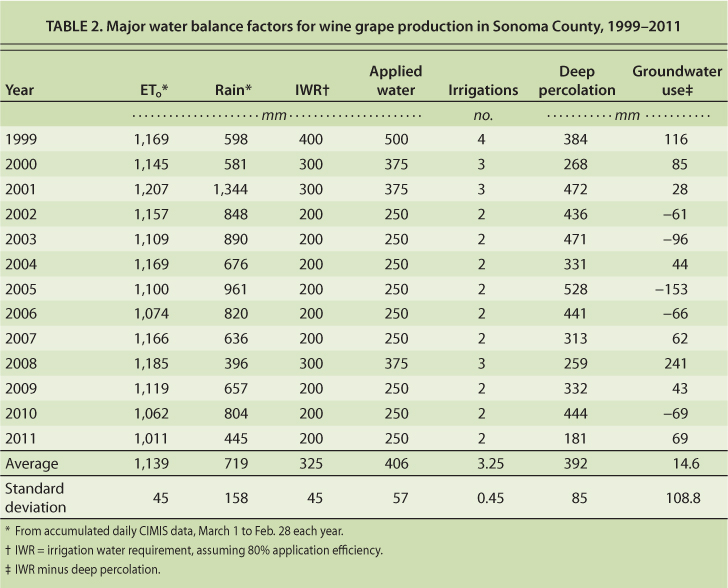
The wide variability in net possible water demand by vineyards was reflected in the net groundwater use (applied water minus deep percolation) associated with vineyard production; groundwater use ranged from a net recharge of 153 millimeters in 2005 to a net use of 241 millimeters in 2008. During the 13 years, there was on average a very small groundwater demand of roughly 15 millimeters per year; this small demand was largely due to the deep percolation of winter rain.
In oaks and grasses, deep percolation occurred only when maximum AWCm was exceeded (table 3). Grasses could only access soil moisture in the root zone, and plant water used (ETc) ceased when AWC was zero; a condition noted in several studies outlined above. For oak trees, relatively dry conditions from 2007 to 2009 resulted in no deep percolation, because the maximum soil moisture-holding capacity was never exceeded. Not surprisingly, groundwater demand by the trees was greatest in late summer and fall. Extraction rates averaged about 270 millimeters per year, similar to those measured by Baldocchi et al. (2004).

Tree canopy cover
Daily soil water balance calculations for the combined oak trees and grasslands depended on the area of tree canopy cover, and deep percolation and groundwater use rates fell. In grassland, deep percolation was available to meet groundwater demand by the trees. In all the years studied, deep percolation decreased and net groundwater use increased as tree cover increased. This linear relationship enabled us to determine the amount of cover that provided the same net annual groundwater use as that from the vineyard. On average, during the 13-year period, oak tree cover of about 50% resulted in groundwater use equivalent to that for average vineyard production (table 4). While vineyards received irrigations during hot, dry months, oaks extracted needed water from deep soil storage.
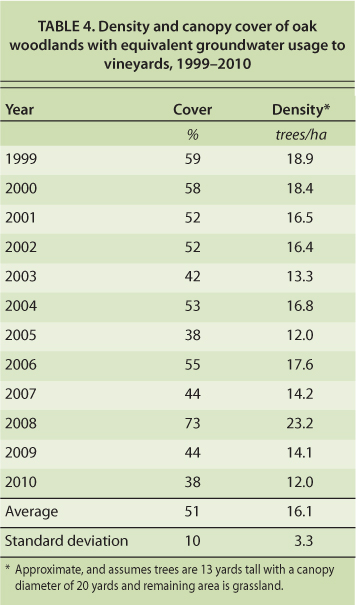
TABLE 4. Density and canopy cover of oak woodlands with equivalent groundwater usage to vineyards, 1999–2010
Completing a soil water balance using just the 13-year averaged daily ETo and rain data provided a similar area of trees (? 45%) and allowed us to illustrate average conditions and determine the sensitivity of the calculated groundwater use to variations in model parameters (fig. 4). With the smallest available water capacity in the root zone, soil moisture in grasslands is depleted early in the season and gradually replenishes after plant senescence. The demand for additional water in vineyards (provided by irrigations) begins after about 120 days, or early July, while deep groundwater demand in oaks begins approximately 2 weeks later.
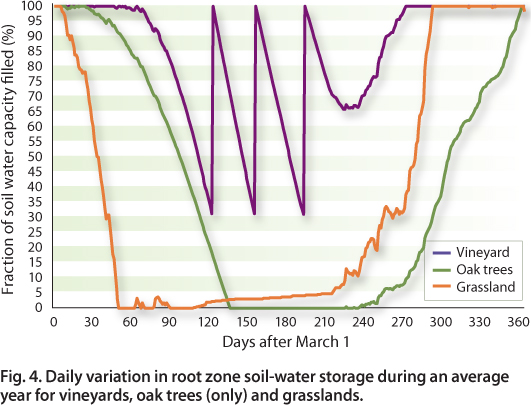
Fig. 4. Daily variation in root zone soil-water storage during an average year for vineyards, oak trees (only) and grasslands.
In oak woodlands with 45% to 50% tree canopy coverage, groundwater use was initially less than available soil moisture, resulting in net recharge of about 10 millimeters per day for about 140 days. At that point, cumulative groundwater demand steadily increased to 92 millimeters and leveled off. Groundwater demand dropped as tree ETc decreased and early winter rains replenished the soil moisture. Similarly, vineyard groundwater use showed the three-step increase associated with groundwater withdrawals for irrigations. As demand leveled off, winter rains replenished groundwater via deep percolation and groundwater use rapidly declined.
In both vineyards and oak woodlands (? 45% canopy coverage), calculated groundwater use was small at 5.5 millimeters per year under these climate conditions, although it is important to note that vineyard irrigation results in more groundwater use than oaks in late summer.
Model prediction sensitivity
This modeling is subject to interpretation because of the uncertainties associated with selecting various parameter values. While precise values can be elusive, their ranges are generally limited. Aside from Kc values for daily water use by plants, the primary parameters affecting groundwater use are effective rainfall, available water capacity and maximum allowable depletion.
Figure 5 shows the effects of different effective daily rainfall values on annual groundwater recharge for the equivalent vineyard and savanna shown in figures 4 and 5, in which the assumed value was 0.6. Increasing effective rainfall values implies that a greater proportion of daily rainfall infiltrates and thereby more rapidly replenishes soil moisture while increasing possible deep percolation. In reality, effective rainfall values vary with storm intensity and prior soil moisture conditions — high storm intensities and near-saturated soil result in small effective rainfall values because rainfall runs off rather than infiltrates.

Fig. 5. Effect of effective rainfall fraction used in modeling on net annual groundwater recharge for vineyard and equivalent oak woodland.
Rainfall interception by oak tree canopies ranges from 20% to 30% of the total rain when the canopy is relatively dry, possibly further reducing effective rainfall. Similarly, increasingly steep ground slopes increase runoff fractions of rainfall, reducing effective rainfall. Assuming losses to surface depressions of about 10%, canopy interception and some soil moisture, 0.7 may be a practical average upper limit for the effective rainfall fraction, and, with the exception of very low-intensity storms, 0.5 is the lower limit. The effect of uncertainty in this parameter is nearly identical for vineyards and oak woodlands, suggesting that whatever the exact effective rainfall value, there would be little or no change to estimated tree areas (as determined above).
Uncertainty in estimated available water capacity stems from variation in soil types, soil layer thickness and the depth to relatively impermeable layers or groundwater. Setting available water capacity (storage volume) is the same as setting a threshold, because changes in calculated groundwater use are not smooth but incremental (tables 5 and 6).
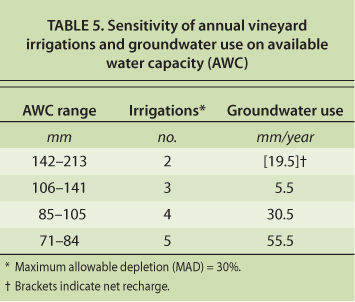
TABLE 5. Sensitivity of annual vineyard irrigations and groundwater use on available water capacity (AWC)

TABLE 6. Sensitivity of annual groundwater demand in oak woodland on soil available water capacity (AWC)
For typical established vineyards, available water capacities likely range from 100 to 150 millimeters, within which there is little effect on groundwater use (table 5). This suggests that the assumed AWC value of 122 millimeters should be sufficient for comparisons. Available soil water capacity for oak trees is largely unknown, though expected to be large. From the continuous water balance modeling, the assumed value of 250 millimeters was exceeded in 9 of the 12 years, and in 2009 maximum soil storage was only 238 millimeters. Because oak savannas and woodlands are not irrigated, decreased available water capacity can offset increased deep percolation and groundwater demand. Thus, changing the water available to trees from 200 to 250 millimeters results in relatively small values of net groundwater use or recharge (table 6). Overall, the range of likely available water capacity values for grapevines, trees and grasslands will have little effect on the equivalent tree area fraction as estimated from annual groundwater use.
Finally, the allowed maximum allowable depletion for irrigated agriculture determines the managed soil water storage and frequency, and the possible depths of applied water. Wine grape vineyards are typically managed with deficit irrigation, allowing soil water to be substantially depleted to between 20% and 30% capacity. In this range, net groundwater recharge remained unchanged at 5.5 millimeters per year. Allowing the soil water to become entirely depleted to 0% of capacity (dry) resulted in a greater net groundwater recharge (19.5 millimeters per year). The MAD factor therefore had a minor effect on estimated tree areas based on annual groundwater use.
Overall, uncertainty in the model parameter values results in an equivalent variability in tree area that is similar in range to that associated with hydrologic variability (ETo and rain) (tables 2, 3 and 4). For Sonoma County, conditions in oak woodland with a tree canopy of 40% to 60% are likely equivalent in terms of net annual groundwater use or recharge to that of an established irrigated wine grape vineyard. In both the vineyard and woodland, groundwater demand is greatest in late summer, though the rates from groundwater pumping for vineyard irrigation likely exceed those from extraction by oak tree roots (fig. 6).
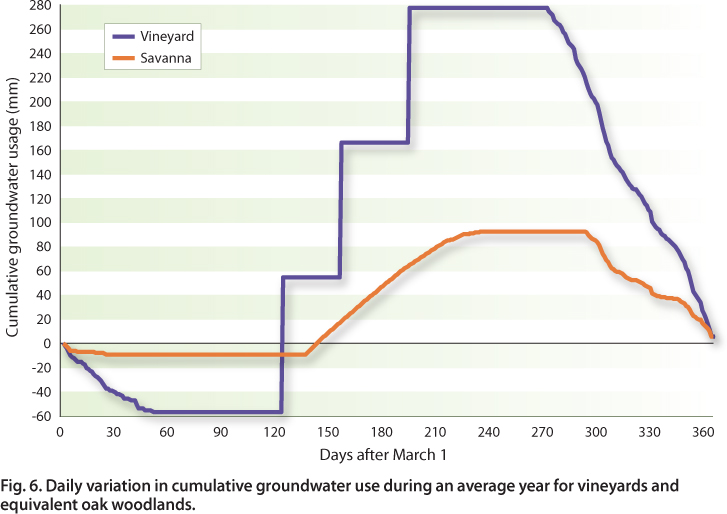
Fig. 6. Daily variation in cumulative groundwater use during an average year for vineyards and equivalent oak woodlands.
Further study
Overall, canopy coverage of 40% to 60% in oak woodlands results in average annual groundwater use equivalent to mature, irrigated, wine grape vineyards in Sonoma County. However, though the annual net use of groundwater was equivalent, the seasonal timing of this use is important to consider. Daily patterns indicate a relatively steady rate of groundwater extraction by oak tree roots beginning in late summer, when extraction increases and regional groundwater supplies are likely stressed. Water resource managers may need to consider this distinction between net use and timing.
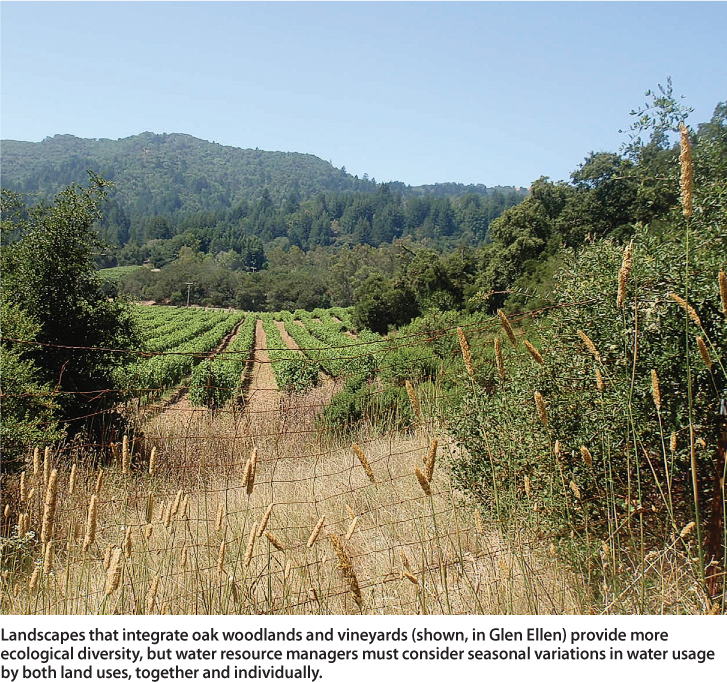
Landscapes that integrate oak woodlands and vineyards (shown, in Glen Ellen) provide more ecological diversity, but water resource managers must consider seasonal variations in water usage by both land uses, together and individually.
Our analysis also provides some insight into the concept of integrated oak woodland and vineyard landscapes, in which the oak tree/savanna grasslands are replaced with vines, leaving a patchwork of trees. These landscapes would provide greater ecological diversity than occurs in vineyards alone. However, oak trees in combination with irrigated vineyards could potentially result in greater net groundwater use than either landscape individually.
Citations
Converting oak woodland or savanna to vineyards may stress groundwater supply in summer

