


All Issues
New quality index based on dry matter and acidity proposed for Hayward kiwifruit
Publication Information
California Agriculture 66(2):70-75. https://doi.org/10.3733/ca.v066n02p70
Published online April 01, 2012
NALT Keywords
Abstract
Researchers from various countries have proposed using dry matter at harvest as a worldwide quality index for Hay-ward kiwifruit, because it includes both soluble (sugars and acids) and insoluble (structural carbohydrates and starch) solids and doesn't change during post-harvest handling. Our consumer tests in 1999 and 2008 indicated that dry matter and ripe titratable acidity are related to in-store consumer acceptance of kiwifruit. In most California seasons, when ripe titratable acidity was less than 1.2%, only a dry matter greater than or equal to 15.1% was required for consumer acceptability. Our 6-year quality attribute survey of California kiwifruit at harvest and from cold storage demonstrated that dry matter and ripe soluble solids concentration were highly variable among vineyards and seasons, but ripe titratable acidity values varied more among seasons than between vineyards. Our results provide strong evidence that dry matter would be a reliable quality index candidate for California kiwifruit, especially if ripe titratable acidity were factored in.
Full text
Measuring the soluble solids concentration of kiwifruit juice at harvest is the official method of assessing its maturity in most kiwifruit-producing countries, including New Zealand, Italy, France, Greece, Chile, Japan and the United States (Beever and Hopkirk 1990; Crisosto and Mitchell 2002). A refractometer is used to make the simple and fast measurement of the concentration of soluble solids such as sugars, organic acids, phenolic compounds and pectins. Minimum harvest maturity standards for Hayward kiwifruit (Actinidia deliciosa [A. Chev.] C. F. Liang and A. R. Ferguson) are enforced in several countries including the United States, ranging from 5.5% to 6.5% soluble solids concentration at harvest (HSSC) (Beever and Hopkirk 1990; Crisosto and Mitchell 2002). This range assures a minimum consumer acceptance (greater than or equal to 12.5% ripe soluble solids concentration) and adequate storage potential to avoid flesh breakdown, which occurs when soluble solids are less than 6.2% at harvest (Crisosto and Crisosto 2001).
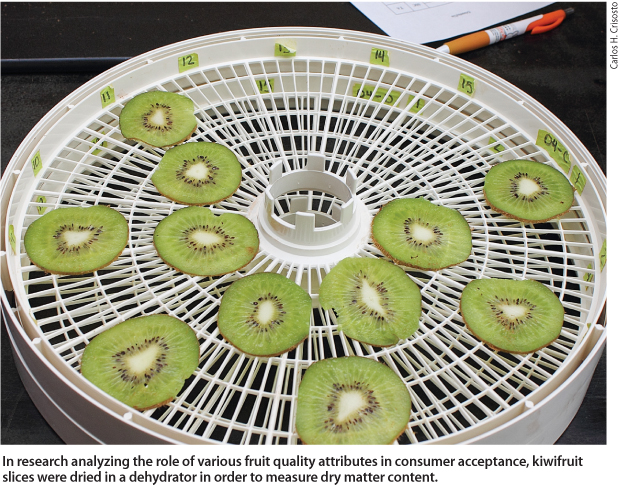
In research analyzing the role of various fruit quality attributes in consumer acceptance, kiwifruit slices were dried in a dehydrator in order to measure dry matter content.
Kiwifruit is usually harvested when mature but unripe, then kept in cold storage for up to 6 months. Ripening starts at various points in the distribution chain on the fruit's way to the consumer (Ritenour et al. 1999). Ripening time depends on how long the fruit has been stored at 32°F, and whether it has been preconditioned with ethylene. Kiwifruit harvested with less than 6.2% soluble solids concentration develop flesh breakdown by 3 months in storage at 32°F. Soluble solids increase slowly during cold storage as starch is converted to sugars, but the complete conversion occurs when the kiwifruit is ripened.
At harvest, a mature, unripe kiwifruit has a high content of starch and soluble sugars, but soluble solids concentration readings do not take starch into consideration because it is insoluble. Therefore, soluble solids concentration measurements do not accurately predict final soluble sugars after ripening. As ripening and softening progress during the kiwifruit's postharvest life, starch is hydrolyzed to soluble sugars and consequently the soluble solids concentration increases.
The sweetness, eating quality, consumer acceptance and repeat purchases of kiwifruit are strongly associated with the concentration of soluble sugars (Burdon et al. 2004; Crisosto and Crisosto 2001; Harker et al. 2009; Jordan et al. 2000; Rossiter et al. 2000). Following an in-store consumer test, UC researchers proposed a soluble solids concentration after ripening (RSSC) of 12.5% as the minimum quality index for early-marketed California kiwi-fruit (Crisosto and Crisosto 2001).
Hayward kiwifruit dominate California production, and they are marketed worldwide. California growers export little, but fruit is shipped to the Southern Hemisphere (New Zealand and Chile) and Italian markets when local crops are out of season, and California receives imports from these countries as well. This globalization has created economic advantages for early- and late-harvest kiwifruit sales, when fruit availability is low and prices are high. However, the incentive to harvest early or to hold fruit in long-term storage can result in low-quality kiwifruit in the market, reducing repeat purchases and overall demand.
To more reliably assure flavor quality, researchers from various countries including New Zealand have proposed, in addition to the harvest maturity index, the use of dry matter concentrations as a voluntary quality index, which would be measured at harvest and/or shipment to market. Dry matter readings include starch and are highly correlated with ripe soluble solids concentration (Beever and Hopkirk 1990; Harker et al. 2009; Jordan et al. 2000), and they do not change during cold storage (Crisosto et al. 2009). New Zealand and Chile have started using a minimum dry matter standard for retail marketing and wholesale trade. However, as yet, there is no agreement on the minimum dry matter level that should be established as a quality index.
To develop a quality index for Hay-ward kiwifruit, we studied the relationships among dry matter, ripe soluble solids concentration, ripe titratable acidity (RTA) and consumer acceptance. We also investigated dry matter variability in kiwifruit at harvest and from cold storage from several California growing regions, and we surveyed imported kiwifruit during the U.S. low-availability season (March to May and August to November).
In-store consumer survey
During the 1999 and 2008 kiwifruit growing seasons, we surveyed groups of 142 and 124 consumers, respectively, at a major supermarket in Fresno County. Each consumer was presented with three ripe Hayward kiwifruit samples from California vineyards at targeted dry matter levels (14.0% to 15.9%, 16.0% to 17.9% and ? 18.0%). To ripen the previously cold-stored kiwifruit samples (1 to 5 weeks storage at 32°F [0°C]), cold kiwifruit were exposed to 100 parts per million ethylene for 12 hours, following the preconditioning protocol (Ritenour et al. 1999). This process was carried out 2 to 3 days prior to the consumer test, and the kiwifruit were allowed to ripen at 68°F (20°C) until they reached 2 to 3 pounds-force (1 pound-force equals 4.45 Newtons) flesh firmness (Crisosto and Crisosto 2001).
Flesh firmness and dry matter were measured on the day of the test before the consumers tasted the samples, and juice was extracted from the remaining fruit after tasting on the same day of the test, using previously described methods (Crisosto and Crisosto 2001; Crisosto, Hasey et al. 2008). A kiwifruit sample consisted of a 0.25-inch-thick slice, halved, cut perpendicular to the long axis of the fruit, adjacent to the location where the slice for dry matter assessment was taken. The consumer responses were recorded using a 9-point hedonic scale (1 = dislike extremely, 9 = like extremely). Consumer acceptance was measured as a degree of liking and expressed as a percentage (Lawless and Heymann 2010).
Fruit quality attributes survey
During the 2006 and 2007 growing seasons, samples of 10 to 15 kiwifruit, replicated three times, were collected at six different maturity stages (harvest dates) from the same vineyards: three in the San Joaquin Valley (southern region) and three in the Sacramento Valley (northern region). All kiwifruit samples from these vineyards — and commercial cold-storage facilities and retail stores in California for the low-availability season survey — were immediately transported to the F. Gordon Mitchell Postharvest Center at the Kearney Agricultural Research and Extension Center in Parlier, California, for fruit quality assessments.
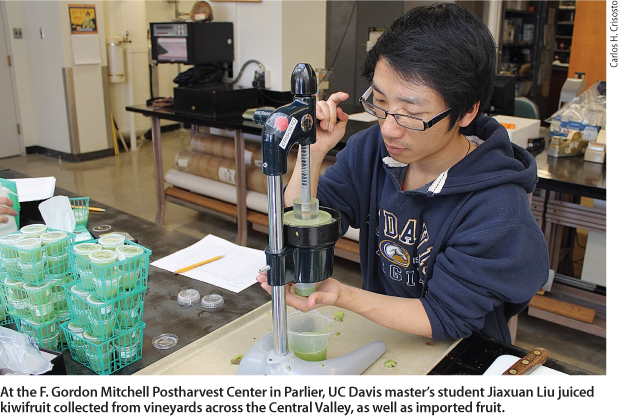
At the F. Gordon Mitchell Postharvest Center in Parlier, UC Davis master's student Jiaxuan Liu juiced kiwifruit collected from vineyards across the Central Valley, as well as imported fruit.
Glossary
Dry matter: The ratio of the weight of a test sample after drying to the fresh weight of the test sample, expressed as a percentage. Kiwifruit dry matter at harvest is composed of both starch and soluble sugars as well as organic acids, minerals, pectins and other components.
Soluble solids concentration: A measurement consisting primarily of soluble sugars, as well as soluble pectins, and organic, amino and ascorbic acids. Measured using refractometers or hydrometers.
Starch: A white, tasteless, solid carbohydrate (C6H10O5)n occurring in the form of minute granules in seeds, tubers and other parts of plants. Measured by potassium iodide test or other chemical tests.
Titratable acidity: A measure of the total amount of acid present expressed as a percentage of the predominant acid, as determined by titration or chemical tests in a laboratory.
Fruit quality attributes measured at harvest included flesh firmness, soluble solids concentration, titratable acidity and dry matter (Crisosto, Hasey et al. 2008). Soluble solids concentration and titratable acidity of ripened fruit were measured as described by Crisosto and Crisosto (2001).
In addition to the vineyard survey, kiwifruit samples of three replicates of 10 to 15 kiwifruit were collected directly from commercial cold-storage facilities in California during 1998, 1999, 2006, 2007, 2008 and 2009 for dry matter determinations. Imported kiwifruit samples from Chile and New Zealand (three replications of 10 kiwifruit) were collected for dry matter determinations directly from California retail stores in 2009 and 2010.
Quality and consumer acceptance
Dry matter
The in-store consumer tests showed that dry matter content significantly influenced the degree of liking in both seasons (tables 1 and 2). In the 1999 growing season, consumers rated kiwifruit from “like slightly” (6.1) to “like moderately” (7.1). The percentage of consumers who said they “like” (score > 5.0) the kiwifruit varied from 71% to 87% depending on dry matter, while the percentage of consumers who chose “dislike” (score < 5.0) ranged between 6% and 26%. Only a few consumers (3% to 6%) chose “neither like nor dislike” (table 1). Degree of liking was significantly higher (6.6 to 7.1) and acceptance was approximately 85% for kiwifruit with dry matter greater than or equal to 16.1% than for kiwifruit with dry matter less than 16.1%.
The in-store consumer test results for the 2008 growing season were similar to the 1999 results (table 1). Consumers rated kiwifruit from “dislike slightly” (4.6) to “like slightly-moderately” (6.5). The percentage of consumers who said they “like” the fruit varied from 35% to 76%, increasing as dry matter increased, while the percentage who said they “dislike” the fruit decreased from 50% to 20% as dry matter increased. “Neither like nor dislike” was chosen by 4% to 15% of consumers (table 1).
Ripe titratable acidity
Dry matter and ripe titratable acidity, which is associated with sourness, significantly influenced the degree of liking in the 2008 consumer test, but not in the 1999 test. In 2008, the F-ratio for ripe titratable acidity was significantly higher than for dry matter. (A significant F-ratio means that there is at least one significant difference among means being compared.) As a result, we divided the data set into two classes for further analysis using dry matter and ripe titratable acidity as combined factors on degree of liking. With the same dry matter levels, one class had a ripe titratable acidity greater than or equal to 1.2% and the other less than 1.2% (table 2).
Consumers rated kiwifruit with ripe titratable acidity greater than or equal to 1.2% from “dislike slightly” (4.4) to “like slightly” (5.7), and acceptance ranged from 34% to 65%. A high percentage of consumers (28% to 57%) said they “dislike” these kiwifruit. In this high titratable acidity class, degree of liking was significantly higher for kiwifruit with dry matter greater than or equal to 16.1% (acceptance ranged from 54% to 65%) than with dry matter less than 16.1%.
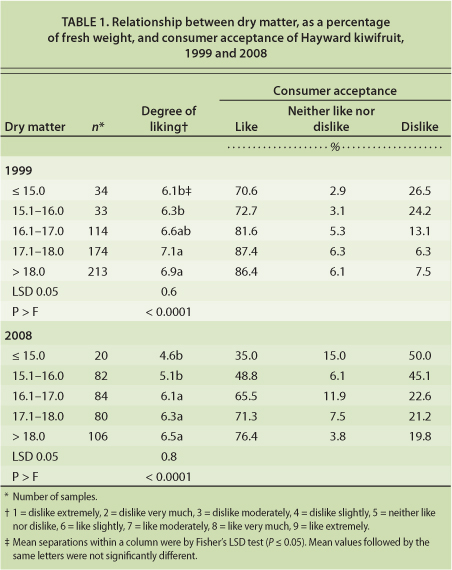
TABLE 1. Relationship between dry matter, as a percentage of fresh weight, and consumer acceptance of Hayward kiwifruit, 1999 and 2008
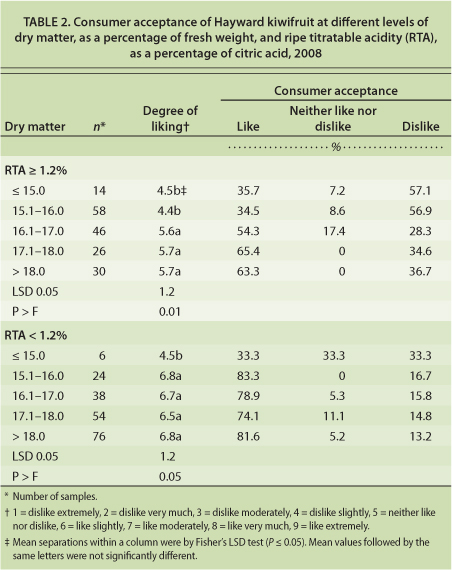
TABLE 2. Consumer acceptance of Hayward kiwifruit at different levels of dry matter, as a percentage of fresh weight, and ripe titratable acidity (RTA), as a percentage of citric acid, 2008
Consumers rated kiwifruit with ripe titratable acidity less than 1.2% from “dislike slightly” (4.5) to “like moderately” (6.8), and acceptance ranged from 33% to 83%. A high percentage of consumers (13% to 33%) said they “dislike” these kiwifruit. The degree of liking was significantly higher for kiwifruit with dry matter greater than or equal to 15.1% (acceptance ranged from 74% to 83%). In this class, the percentage of consumers who said they “dislike” the fruit decreased from 33% to 13% as dry matter increased. In contrast, consumers who chose “neither like nor dislike” varied among dry matter classes, ranging between 0% and 33% (table 2). These results demonstrate that consumer acceptance of kiwifruit is affected by dry matter and acidity levels.
Quality at harvest and after ripening
2006 samples
In the 2006 growing season, the average dry matter of kiwi-fruit sampled from the three San Joaquin Valley vineyards (A, B, C) increased from 14.6% to 16.2% between Sept. 14 and Oct. 23. During this sampling period, harvest soluble solids concentrations ranged between 5.1% and 6.6%, and harvest titratable acidity was between 1.8% and 2.0%. After ripening to a flesh firmness of 2 to 3 pounds-force (9 to 13.5 Newtons), the kiwifruit exhibited average ripe soluble solids concentrations between 10.4% and 13.1% and titratable acidity between 0.4% and 1.1%. (Data in this section is not shown; it is available from authors upon request.)
Minimum quality indexes (dry matter ? 15.1% and soluble solids concentration ? 6.2%) are important to consider at harvest because they can predict consumer acceptance. For instance, vineyard A reached the minimum dry matter by Sept. 14 and the minimum harvest soluble solids concentration by Oct. 2, with titratable acidity at harvest of 2.0%. However, vineyard A exceeded a ripe soluble solids concentration of 12.5% by Sept. 25, and its ripe titratable acidity was lower than 1.2%. Vineyard B met the minimum quality indexes at harvest and after ripening in the last harvest (Oct. 23). Vineyard C did not reach the minimum quality indexes during this harvest season.
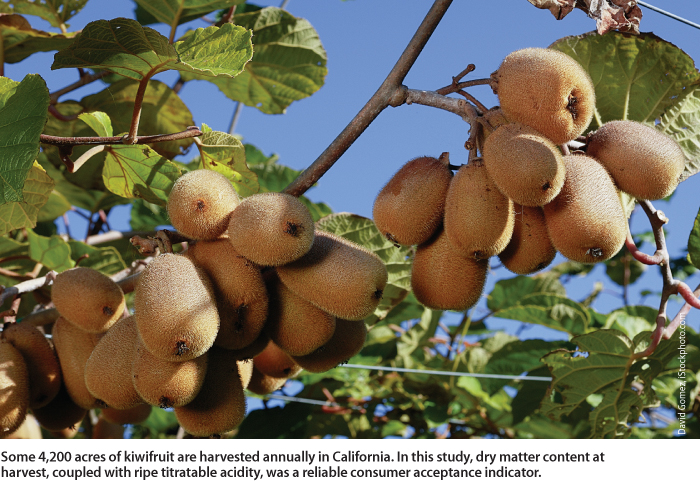
Some 4,200 acres of kiwifruit are harvested annually in California. In this study, dry matter content at harvest, coupled with ripe titratable acidity, was a reliable consumer acceptance indicator.
Average dry matter at harvest of kiwifruit grown in the Sacramento Valley vineyards (D, E, F) increased from 16.1% to 17.9% between Sept. 15 and Oct. 23. Soluble solids concentrations at harvest increased from 5.4% to 7.0% during this time, and titratable acidity ranged between 1.8% and 2.0%. After ripening kiwifruit to a flesh firmness of 2 to 3 pounds-force (9 to 13.5 Newtons), average soluble solids concentration and titratable acidity varied between 11.8% and 13.3%, and 0.5% and 1.2%, respectively. Vineyard D fruit had the highest dry matter on the first harvest date (Sept. 15); dry matter was the same in the three vineyards for the rest of the harvest dates.
The minimum quality index of dry matter greater than or equal to 15.1% was observed on the first harvest date (Sept. 15) for the three Sacramento Valley vineyards. However, none of the fruit from these vineyards reached the minimum quality index for soluble solids concentration until the last two harvest dates. After ripening, fruit from vineyard D had soluble solids concentrations greater than or equal to 12.5% on all harvest dates, except the third harvest date. Fruit from the other two vineyards had ripe soluble solids concentrations greater than or equal to 12.5% by the fourth harvest date, while titratable acidity remained less than or equal to 1.2%.
2007 samples
In the 2007 growing season, average dry matter at harvest (16.1% to 16.8%) and soluble solids concentrations at harvest (5.6% to 7.7%) and when ripe (13.3% to 14.5%) of kiwifruit grown in the San Joaquin Valley vineyards increased consistently between Sept. 27 and Oct. 22. (We did not measure titratable acidity at harvest or after ripening on fruit from these vineyards.) Vineyard A fruit had dry matter consistently higher on all harvest dates than fruit from vineyards B and C. Vineyard C fruit had consistently the lowest dry matter and harvest and ripe soluble solids concentrations on all harvest dates, but harvest soluble solids concentrations were similar in the three vineyards on the fourth harvest date (Oct. 22). Fruit from vineyard A met the minimum quality index for dry matter and soluble solids concentration by the first (Sept. 27) harvest date, and fruit from vineyard B met it by the second (Oct. 4) harvest date. Vineyard C fruit did not meet the minimum quality index for dry matter on any harvest date, and it met the minimum quality index for soluble solids concentration on the last harvest date (Oct. 22). After ripening, vineyards A and B fruit met the minimum quality index for soluble solids concentration on the first harvest date (Sept. 27), while vineyard C fruit met that value by the third harvest (Oct. 11).
Similar results were observed in the three vineyards in the Sacramento Valley during 2007, although the values were higher compared with those in the San Joaquin Valley. Also, titratable acidity decreased from harvest to ripening, with a smaller decrease in 2006 than in 2007.
Seasonal variation
After two consecutive growing seasons, the data suggest that variation in dry matter and other fruit quality attributes depends on harvest time (Crisosto et al. 2007, 2009; Crisosto, Garibay et al. 2008), growing area (Crisosto et al. 2007, 2009; Crisosto, Garibay et al. 2008), vineyard and year. For these six vineyards, dry matter variability was higher among vineyards than between seasons, and ripe titratable acidity variability was low among vineyards but high between seasons.
Our 6-year California kiwifruit quality attribute survey demonstrated that dry matter and ripe titratable acidity were highly variable among seasons, with ripe titratable acidity values varying more among seasons than dry matter (fig. 1).
Proposed kiwifruit quality index
Based on our studies, we propose a minimum quality index of dry matter greater than or equal to 16.1% when ripe titratable acidity is greater than or equal to 1.2%, and 15.1% when ripe titratable acidity is less than 1.2%, to maximize consumer satisfaction.
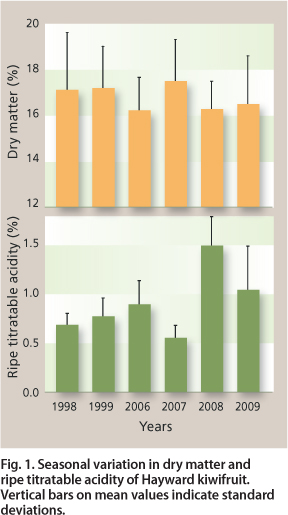
Fig. 1. Seasonal variation in dry matter and ripe titratable acidity of Hayward kiwifruit. Vertical bars on mean values indicate standard deviations.
During the six growing seasons of harvest and cold-storage sample collection from California vineyards (n = 3,156), dry matter ranged from 11% to 22% with an average of 17.1% and a standard deviation of 1.6% (fig. 2A). Of these samples, 76.2% and 90.7% exceeded our proposed minimum quality indexes of dry matter greater than or equal to 16.1% and 15.1%, respectively. In the imported kiwifruit collected in 2009 and 2010 (n = 48), dry matter ranged between 14% and 19%, with an average of 16.0% and a standard deviation of 1.4% (fig. 2B). Of these imported samples, 37.5% and 77.1% exceeded our proposed minimum quality indexes of dry matter greater than or equal to 16.1% and 15.1%, respectively.
Although the influence of ripe titratable acidity on consumer acceptance has been previously documented (Crisosto and Crisosto 2001; Rossiter et al. 2000), the direct impact of dry matter and ripe titratable acidity together on kiwifruit acceptance (table 2), using single-fruit measurements, has not been previously reported. In our study, kiwifruit with high ripe titratable acidity (? 1.2%) required high dry matter (? 16.1%) for consumers to “like” the fruit; for kiwifruit with ripe titratable acidity less than 1.2%, a minimum dry matter of 15.1% was adequate for consumer acceptance.
This effect of ripe titratable acidity may be explained by the fact that high dry matter is associated with sweetness (Burdon et al. 2004; Jordan et al. 2000), which may balance a sourness perception, as reported in kiwifruit and mango (Harker et al. 2009; Malundo et al. 2001). When fruit is perceived to be less sour (ripe titratable acidity < 1.2%), consumers are less demanding for high soluble sugars, or dry matter content, and they “like” kiwifruit with dry matter greater than or equal to 15.1%.
Crisosto and Crisosto (2001) reported that total organic acid content, in terms of titratable acidity at harvest, was relatively stable across harvest seasons. Similar to that study, we noticed a decrease in ripe titratable acidity between harvest and ripening in both years of our fruit quality attributes survey (data not shown). In 2006, titratable acidity decreased 54% from harvest to ripening, and in 2007 it decreased 70%. The high ripe titratable acidity observed during the in-store consumer test in the 2008 growing season may explain the high dry matter level (and indirectly the ripe soluble solids concentration) needed for consumers to like the kiwifruit when ripe titratable acidity was greater than or equal to 1.2% (table 2).
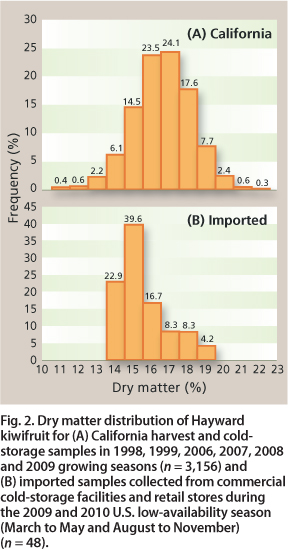
Fig. 2. Dry matter distribution of Hayward kiwifruit for (A) California harvest and cold-storage samples in 1998, 1999, 2006, 2007, 2008 and 2009 growing seasons (n = 3,156) and (B) imported samples collected from commercial cold-storage facilities and retail stores during the 2009 and 2010 U.S. low-availability season (March to May and August to November) (n = 48).
Therefore, in terms of marketing, dry matter would be a more accurate tool than soluble solids concentration alone for controlling minimum quality at harvest, and for meeting export and import requirements. As only minor changes in dry matter occur during postharvest handling, kiwifruit with low consumer acceptance — either harvested early in the season or from potentially low-quality vineyards (dry matter < 15.1%) — could be detected. In our study, differences in dry matter among kiwifruit sources remained constant throughout the cold-storage period. This lack of dry matter change is an advantage over the soluble solids concentration maturity index currently in place.
In some commodities, soluble sugars and organic acids (important components of dry matter) are reduced during cold storage because of respiratory activity. The kiwifruit's low metabolic respiration favors the maintenance of dry matter and soluble sugars, as well as a low water loss potential when fruit is kept at 32°F (0°C) and with relative humidity of 90% to 95%. Kiwifruit's respiration rate is less than or equal to 2 milliliters carbon dioxide per kilogram per hour at 32°F (0°C), whereas the rates for other commodities, such as peach and apple, are about 1.5 and 3.0 times higher, respectively, at the same temperature (Ritenour et al. 1999).
Dry matter content should not be used as the sole index at harvest, since storage potential tests at different dry matter levels have not been investigated extensively. To assure long cold-storage potential, we recommend that the new dry matter quality index be used with the current harvest maturity index between 6.2% and 6.5% soluble solids concentration (a minimum of 6.2% is required to avoid flesh breakdown during long-term cold storage of 3 to 6 months).
Our proposed dry matter quality index would segregate out kiwifruit of low consumer quality either harvested early in the season or from low-quality vineyards. While the dry matter values may not be reached during early harvests (September, in California), some exceptions could be allowed depending on growing area, vineyard management and weather conditions in particular years, as suggested by other authors (Burdon et al. 2004; Crisosto and Crisosto 2001).

Our data indicated that there was strong variation from one season to the next in attributes such as dry matter, harvest and ripe soluble solids concentrations, and harvest and ripe titratable acidity. Among these attributes, ripe titratable acidity had the lowest variability within a season. These differences in kiwifruit quality attributes from year to year, coupled with consumer acceptance, highlight the need to segregate kiwifruit based on consumer acceptance. Because the proposed minimum dry matter quality index is based on single-fruit measurements and consumer acceptance, it would allow single-fruit segregation during packaging without regard to population variability, perhaps using postharvest technologies such as near-infrared sensors (Slaughter and Crisosto 1998).
Even though there were highly significant correlations between dry matter and soluble solids concentration in our studies, we do not recommend the use of dry matter as a maturity index. A maturity index is used to define when a given commodity has reached the stage of development that after harvesting and postharvest handling (including ripening, where required) its quality will be at least the minimum acceptable to the consumer. This maturity index may be an enforced standard; a quality index is a guide that is used voluntarily to assure a certain level of quality. Previously published information demonstrated that immature or overmature kiwifruit, with maturity based on harvest soluble solids concentration, can develop senescent breakdown — the breakdown of tissues or the development of granular, mealy or soaked tissues during long cold-storage periods (Crisosto and Crisosto 2001).
Our studies demonstrate that dry matter is a reliable consumer quality index, but not a reliable maturity index, so harvest decisions should still include harvest soluble solids concentration and firmness to protect kiwifruit in long-term storage or marketing conditions. Studies are needed to understand the potential limitations of dry matter in predicting long-term cold-storage performance.
Citations
New quality index based on dry matter and acidity proposed for Hayward kiwifruit

