


All Issues
A new method is used to evaluate the strategic value of Fresno County farmland
Publication Information
California Agriculture 64(3):129-134. https://doi.org/10.3733/ca.v064n03p129
Published July 01, 2010
PDF | Citation | Permissions
Abstract
Fresno County is a rich agricultural area that faces rapid urbanization and farmland conversion. The county is participating in a strategic, multi-county planning initiative aimed at making sustainable and regionally cohesive land-use decisions. To inform this effort, we conducted a farmland conservation assessment and identified strategic farmlands for prioritization in future conservation efforts. We identified environmental and human predictor variables that affect the viability of existing farmland, used a geographic information system (GIS) to integrate them, and created a countywide strategic farmland conservation map. We compared our analysis to status quo methods of prioritization and found that with our model the spatial output of highly valued farmland was shifted, narrowed and located adjacent to some of the county's most urbanized areas. These findings are influencing growth policies and farmland conservation planning in Fresno County.
Full text
Throughout the United States, land consumption and the conversion of farmland to urban development are rising (Heimlich and Anderson 2001). Nationally, cropland declined by 52 million acres between 1982 and 2003, while developed land increased by 35 million acres (NRCS 2007). Farmland loss to conversion and fragmentation can deteriorate agricultural economies and communities, and contribute to other social and environmental problems (Schiffman 1983). One aspect of this problem is the lack of long-range land-use planning processes to conserve agricultural lands. Land assessment is a critical tool for the development of strategic plans that address farmland conservation, but many regions lack the infrastructure and resources to conduct them. Geographic information systems (GIS) provide significant opportunities to improve land assessment and farmland conservation planning. This study expands current frameworks by integrating GIS into a landscape-scale farmland conservation assessment of Fresno County.
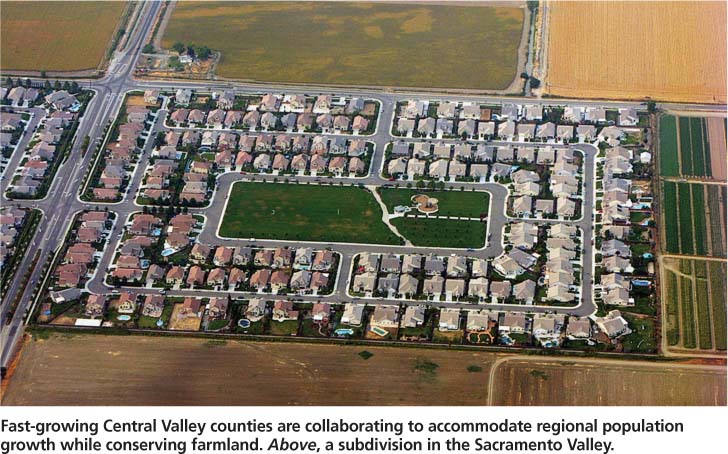
Fast-growing Central Valley counties are collaborating to accommodate regional population growth while conserving farmland. Above, a subdivision in the Sacramento Valley.
Farmland assessment frameworks
LESA. In 1981, the U.S. Department of Agriculture (USDA) adopted the land evaluation and site assessment (LESA) strategy to guide federal land-assessment efforts. LESA scores and values land parcels according to soil quality, water availability, proximity to sewer and urban services, and other localized characteristics (Pease and Coughlin 1996). LESA can determine a particular parcel's appropriateness for conservation efforts; however, it is not designed for assessment at a landscape scale. Some studies have applied GIS to the LESA system as a way of creating a more strategic land-use planning tool and have found the approach versatile and efficient (Hoobler et al. 2003; Dung and Sugumaran 2005). Another study found that combining GIS with LESA increased transparency in the land-assessment process (Tulloch et al. 2003). Additionally, GIS analyses have been used to identify cost-effective conservation strategies (Machado et al. 2006) and locations that could be useful in managing urban growth regionally (Stoms et al. 2009).
Access to data is an important limitation to integrating GIS and LESA (Dung and Sugumaran 2005). While LESA assessment is required for federal projects, it is not generally required for state, county and local projects, although a few local jurisdictions use the methodology. As a result, localities usually do not have the resources or motivation to implement LESA (King and Lamb 2001). However, GIS modeling of urban development can potentially identify future zones of conflict between urban and agricultural uses more accurately than sewer lines and service areas. Additionally, GIS allows for the broader generalization and analysis of larger geographic areas.
FMMP soils. California policymakers often rely on soil classifications from the Department of Conservation's Farmland Mapping and Monitoring Program (FMMP), which tracks changes in agricultural and other land uses on a biennial basis, statewide and by county. FMMP classifies soil characteristics as prime, statewide importance, unique, local importance or grazing based on technical soil ratings and current land use (FMMP 2007). FMMP prime soils are defined as those with “the best combination of physical and chemical features able to sustain long-term agricultural production” (FMMP 2007). FMMP soil classifications offer important information about soil quality, the maintenance of agricultural lands and current irrigation characteristics. However, other factors should be considered when determining future farming viability.
Strategic farmland approach. We strove to improve the utility of LESA and FMMP by developing a strategic farmland approach to farmland assessment for Fresno County. Strategic farmland is defined as “land most likely to remain economically viable for high-value commercial agriculture in the long term, given its inherent characteristics and surrounding conditions” (Thompson 2008). This approach combines many variables to more accurately identify likely important farmlands. We compare the results of our approach with status quo LESA and FMMP-soils approaches to identify spatial changes in farmland conservation priorities.
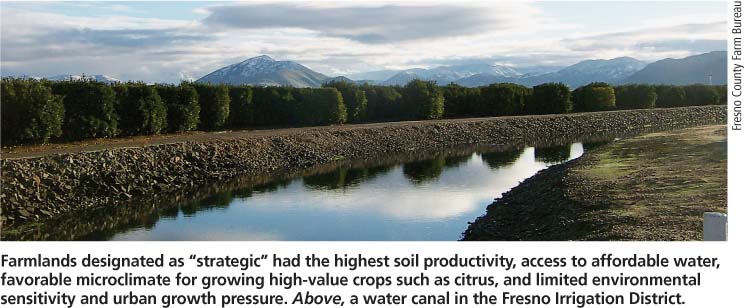
Farmlands designated as “strategic” had the highest soil productivity, access to affordable water, favorable microclimate for growing high-value crops such as citrus, and limited environmenta sensitivity and urban growth pressure. Above, a water canal in the Fresno Irrigation District.
Fresno County study
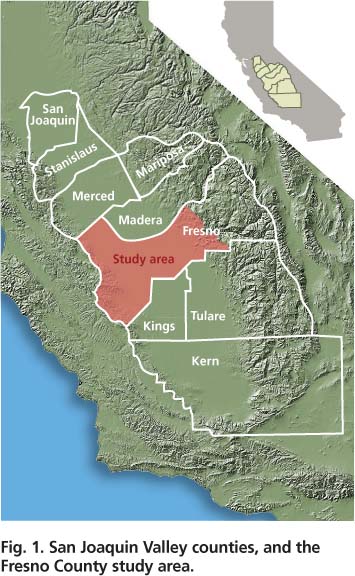
The development of agricultural lands to urban uses is a particular problem in Fresno County. Located in the San Joaquin Valley (fig. 1), Fresno County has the highest market value of agricultural goods sold in any county in California or the United States (Census of Agriculture 2007). Between 1990 and 2004, 12,524 acres of high-quality agricultural land were converted to urban development in Fresno County, the third-highest conversion rate in California (AFT 2006). Fresno County's population is projected to increase from more than 900,000 in 2008 to nearly 2 million by 2050 (DOF 2007), which will increase its urban footprint. This growth may also fragment existing farmland, increase restrictions on farming methods and provide further economic incentives for conversion (Sokolow 2003; Jackson-Smith and Sharp 2008).
In recognition of potential impacts from human population growth, Governor Schwarzenegger established the California Partnership for the San Joaquin Valley (SJV Partnership) to attempt to mitigate negative outcomes. The Land Use, Housing and Agriculture work group created by the SJV Partnership is assessing current land use and suggesting policy changes (Schwarzenegger 2005). Fresno County participates through the San Joaquin Valley Blueprint Planning Process. This voluntary effort includes the eight San Joaquin Valley county councils of governments (COGs), the San Joaquin Valley Air Pollution Control District and the Great Valley Center, a nonprofit organization. The process is intended to chart a 50-year course for land-use planning and transportation in the region.
This process provides an opportunity to create a regionally cohesive and strategic farmland conservation plan with specific targets and priorities. To complement the San Joaquin Valley Blueprint Planning Process, and in order to avoid future losses of world-class farmland and the decline of agriculture as a major source of revenue, Fresno County is conducting regional land assessments and developing its strategic plan for agricultural conservation, urban development and transportation (SJV Partnership 2006).
Modeling farmland conservation
In 2007 and 2008, the Council of Fresno County Governments (Fresno COG) commissioned the American Farmland Trust (AFT), a nonprofit farmland-conservation organization, to design a model farmland conservation program that facilitated public participation in the program design, documented and assessed current agricultural conditions and trends, and made policy recommendations. For this effort, and in conjunction with AFT, we developed a strategic farmland-conservation assessment model for Fresno County by identifying environmental and human variables that have an impact on the viability (the potential to maintain agricultural productivity in the future) of existing farmland.
The highest ranked and most viable farmland, based on these variables, was determined to be strategic farmland that would be prioritized for conservation (Thompson 2008). We integrated a series of environmental and human variables into a GIS, ranked the results and excluded lands classified as nonagricultural by the FMMP (2007) to create a countywide strategic map of Fresno County farmland.
The factors that we considered were land characteristics that typically influence future farming viability, and were identified by agricultural professionals and local experts who participated in the San Joaquin Valley Blueprint Planning Process. The five most influential factors for the long-term economic viability of agricultural land were selected (table 1).
The first three — soil productivity, water cost and reliability, and microclimate — have a positive influence on agriculture. Soil productivity reflects soil quality as described by the FMMP. Water cost and reliability reflect its availability and vulnerability to restrictions and/or service interruptions. Microclimate, a variable chosen by local experts as critical to citrus crops, describes locations where climatic factors enable the growth of citrus, an important and high-value crop in Fresno County.
The remaining two factors, environmental sensitivity and urban growth pressure, have potentially negative impacts. Environmental sensitivity refers to the regulations accompanying the presence of wetlands, vernal pools and/ or endangered species. The projected urban growth pattern was based on a model to identify areas of expected urbanization over the next 50 years, based on a zoning policy scenario selected by the SJV Partnership (2006) that concentrates future growth into and around existing urbanized areas. The Partnership's policy aims to use the benefits of increased urban density as an incentive to reduce land consumption and environmental impacts, and increase mass transit. Urban growth is assigned to occur within or adjacent to existing cities. This scenario would reduce the consumption of agricultural land compared with the status quo (i.e., no change in current land-use policy).
We used the UPlan land-use allocation model, a spatially explicit urban growth model, to project future urban growth (Johnston et al. 2002). UPlan uses county and city general plans (including zoning), projected human population growth, and development attractor and detractor values to model where development is likely to occur. We believe that the UPlan approach is preferable to traditional methods of assessing threats to farmland, such as proximity to a city's sphere of influence, which in California has legal meaning as a plan for the probable physical boundaries and service area of a local agency, sewer lines or other urban development. UPlan permitted us to more completely assess conditions that influence future development patterns.
Blueprint planning participants in Fresno County — who selected the key variables used in this study — identified similar drivers to those noted in the literature. Zurbrugg and Sokolow (2006) identified soil productivity and urban growth pressure as important variables in determining parcel suitability for national agricultural conservation easement programs. Soil productivity and urban growth pressure were also identified as key variables in this study. Additionally, according to Zurbrugg and Sokolow, conservation-easement program directors often value flexibility for individual programs to determine important and locally unique variables. The other variables in this study, including microclimate, water accessibility and environmental regulatory actions, were local features that blueprint planning participants agreed were specifically influential to future farming viability in Fresno County.
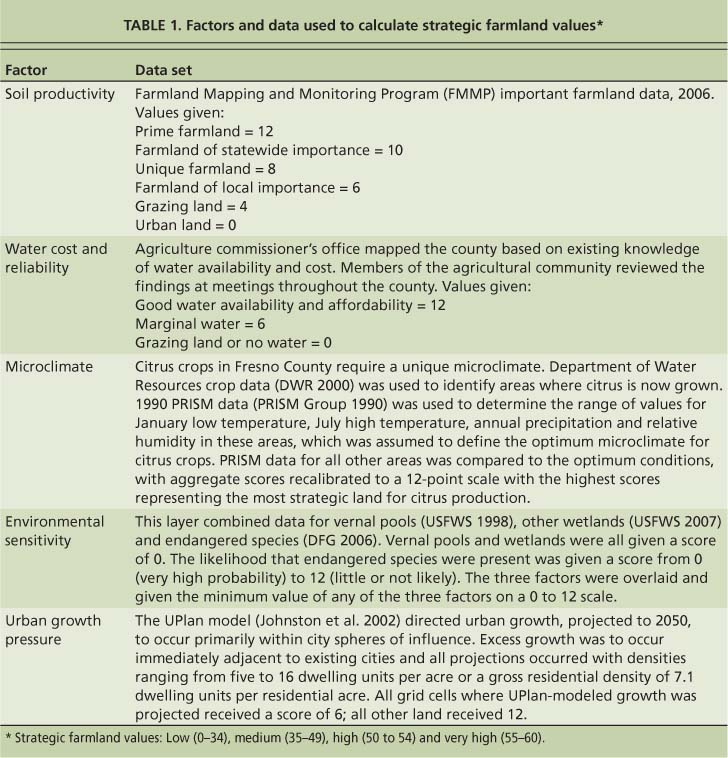
We developed GIS maps of the five model variables by combining the multiple data sources for each into a single GIS layer (table 1). Each variable layer was converted to a 100-by-100-meter grid. The variables were classified by scoring them from 0 to 12 for each grid cell, with positive factors weighted on an increasing scale and negative factors on a decreasing scale. Scores from all grids were added, producing an aggregate value for each grid cell, which was portrayed as an output grid scaled from 0 to 60. The output values were classified into four categories representing strategic farmland values: low (0 to 34), medium (35 to 49), high (50 to 54) and very high (55 to 60).
We reclassified FMMP prime soil as present or absent (1 or 0), and high and very-high strategic farmland designations as present (10) or absent (0). Using spatial analysis, we then summed the two classifications, which resulted in four farmland categories: 0, no prime or strategic land present; 1, prime land present; 10, strategic land present; and 11, prime and strategic land present. We then compared the location and extent of FMMP prime soil and strategic farmland model outputs.
Value of farmland estimated
The strategic farmland analysis identified the extent and location of very-high, high-, medium- and low-value farmlands, representing the combined soil, water, citrus microclimate, urban pressure and environmental sensitivity values (fig. 2).
Very-high-value farmland (55 to 60) makes up about 343,321 acres (8.9%) of the total study area, concentrated in the eastern and southeastern portion of Fresno County (fig. 3), in areas without existing or projected urban development. Very-high-value farmland is located in places with high-quality soil, reliable and low-cost water, and a citrus microclimate. Some areas with values of 55 to 60 extend to the west of the city of Fresno, and one very-high-value band runs through the western side of the county, reflecting locations where high-quality crops are being grown along an aqueduct.
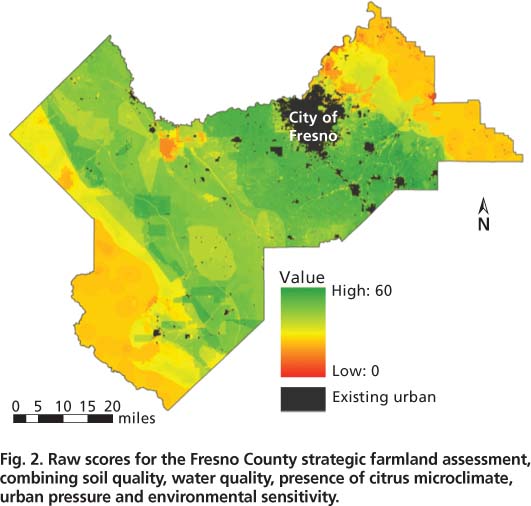
Fig. 2. Raw scores for the Fresno County strategic farmland assessment, combining soil quality, water quality, presence of citrus microclimate, urban pressure and environmental sensitivity.
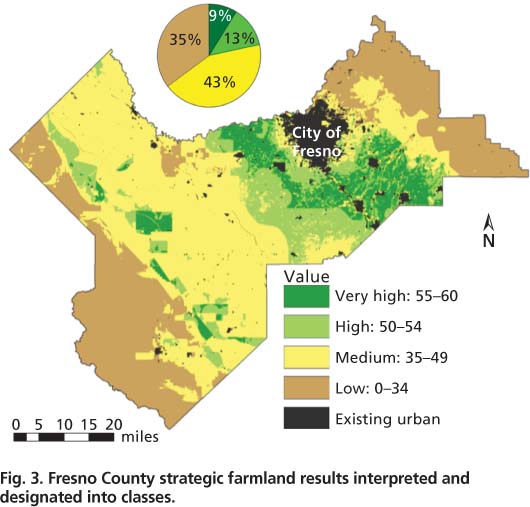

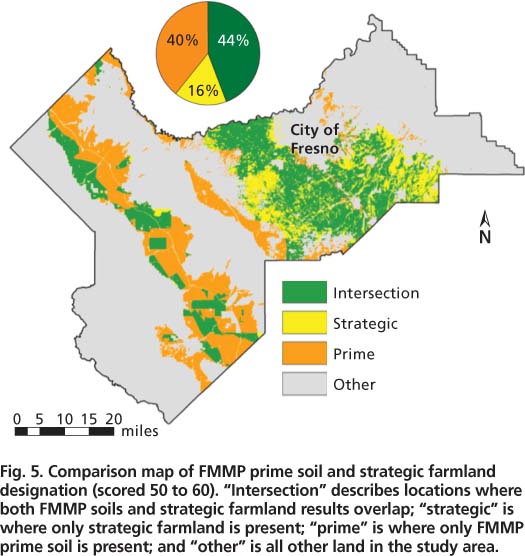
Fig. 5. Comparison map of FMMP prime soil and strategic farmland designation (scored 50 to 60). “Intersection” describes locations where both FMMP soils and strategic farmland results overlap; “strategic” is where only strategic farmland is present; “prime” is where only FMMP prime soil is present; and “other” is all other land in the study area.
High-value farmland (50 to 54) displayed similar patterns but had a wider extent than the very-high-value farmland. It extends further to the west and has a larger band along the county's western side. High-value farmland totaled 491,613 acres (12.8%) of the total study area. Very-high- and high-value farmland were combined to constitute the strategic farmland designation, or farmland that is given top priority in conservation efforts; 22% of the total study area fell in this category (fig. 3).
FMMP prime soils represent existing farmland conservation targets that make up 30% of the total land area and occur throughout the study area (fig. 4).
We found an 821,722-acre (44.1%, excluding the “other land” category from the calculation) overlap between FMMP prime soils and the strategic farmland designation (fig. 5). The greatest area of intersection was in the study area's eastern portion, which contains prime soils, a high degree of water reliability and a citrus microclimate (southeast portion). There was also a commonly identified area along an aqueduct on the western side, although FMMP prime soils identified a wider extent of coverage than did strategic farmland. Some 13,212 acres (16.3%, excluding “other” land) were exclusively strategic farmland, while 1,271,891 acres (39.5%, excluding “other” land) were exclusively FMMP prime soil. The strategic farmland designation identified the highest-valued land in the eastern portion of the study area. It had a wider extent in the east than FMMP prime soils, in recognition of the other positive variables, including water and microclimate. FMMP had a wider extent in the west, where prime soils are present but water is more costly or unreliable. The FMMP maps also identified some prime soils surrounding the cities of Fresno and Clovis in the northeast section of the study area. These were not designated as strategic farmland because UPlan model outputs indicated that the area was likely to be developed by 2050.
Enhancing existing frameworks
This strategic farmland analysis contributed critical information about future farmland viability compared to the prime soil assessment. The presence of prime soils was an important value for farming viability; however, water availability and microclimates were also important. Urban pressure and environmental barriers had existing and potential negative influences on long-term farmland viability. For Fresno County, where so much farmland is designated as prime soils, the use of additional assessment criteria to support farmland conservation decisions was critical.
Our study expanded on the application of GIS methods to a LESA framework. Maps for the variables used here — soil quality, climate, water availability and environmental sensitivity — can be developed regionally, and urban-development pressure can be modeled to explore how it affects farmlands. Finally, local agricultural experts and stakeholders can supply critical information about local conditions and help to fill data gaps. This combination of existing data, trend modeling and specialized local knowledge created a more nuanced and detailed map of where future farming is likely to be successful than did the FMMP prime soil classification by itself.
One important contribution to the LESA framework was the inclusion of modeled urban development to evaluate urban growth threats. Standard LESA methods examine the proximity to sewer systems and other development as a measure of potential future conflict. This approach is limited because these factors cannot always accurately predict the location of future development. UPlan modeling predicts future development more accurately by integrating current development patterns with planning policy and other development attractor and detractor variables. The urban growth outputs from UPlan illustrate how current planning policy, as defined by zoning designations in a county's general plan, can affect agricultural viability. The UPlan scenario we used allocates growth by considering compact growth densities and filling spheres of influence first, before allowing growth to overflow sphere-of-influence boundaries. In Fresno County, we found that the majority of growth to 2050 could fit into existing spheres of influence. This important information challenges decision-makers to set and maintain policies that encourage compact growth and infill development in order to preserve Fresno County's highest-value farmland (see box, page 133).
San Joaquin Valley applications
The American Farmland Trust (AFT) used the strategic farmland analysis to make three main policy recommendations to the Council of Fresno County Governments (COG). The Fresno COG advisory committee subsequently integrated these recommendations and the strategic farmland analysis into their county and blueprint planning processes:
Create a strategic agricultural reserve. This reserve would be made up of land designated as strategic farmland. Nonagricultural development, transportation projects and public construction projects would not be permitted within the reserve unless there were no feasible alternative locations.
Set objective criteria. Fresno County policymakers and the Fresno County Local Agency Formation Commission (LAFCo) should set objective criteria for expanding each local agency's sphere of influence and evaluating development in unincorporated areas. This would ensure that infill growth and compact development are prioritized before the development footprint is expanded. These policies would severely limit a city or unincorporated area from expanding its sphere of influence or development zones, except in rare circumstances.
Establish a stewardship council. A nonregulatory, public-private stewardship council consisting of 15 community leaders should be created to oversee the strategic agricultural reserve, provide accountability and facilitate the effective implementation of policies.
This assessment served as a pilot for a regionwide strategic farmland analysis of the San Joaquin Valley. The methods tested in Fresno County are usable in other counties, and reactions to the strategic farmland analysis by the agricultural community in Fresno have helped guide efforts to analyze farmland prioritization in the San Joaquin Valley. One problem that was noted in Fresno County was incorporating the urban growth pressure layer into the model as one of the five variables. A preferred approach would have been to add the other four layers, and then overlay the urban pressure layer to look for intersections. This change is being made in the San Joaquin Valley assessment.
Making informed decisions
Land assessment for future farming viability is a critical component of farmland conservation and land-use planning. Policy programs and local planning agencies must assess farmland before implementing policies and programs aimed at farmland conservation. Decisionmakers need to account for multiple types of variables when making assessments. LESA provides a framework for land assessment, but is not designed as a strategic planning tool. The application of GIS to existing land-assessment practices can update and reinvigorate these techniques. The landscape modeling approach presented here can provide informed decision support for regional planning efforts.
A new method is used to evaluate the strategic value of Fresno County farmland

