


All Issues
Video market data for calves and yearlings confirms price discounts for Western cattle
Publication Information
California Agriculture 63(4):225-231. https://doi.org/10.3733/ca.v063n04p225
Published October 01, 2009
PDF | Citation | Permissions
Abstract
We used 11 years of data from video auction sales across the western United States to address two long-standing questions posed by California cattle ranchers. First, as expected, ranchers receive lower prices for cattle sold here compared to prices received by ranchers in the Midwest. Second, some (but not all) “value-adding” production and marketing practices raise prices received by ranchers. We report the average amount of location discounts and quality premiums for several market regions.
Full text
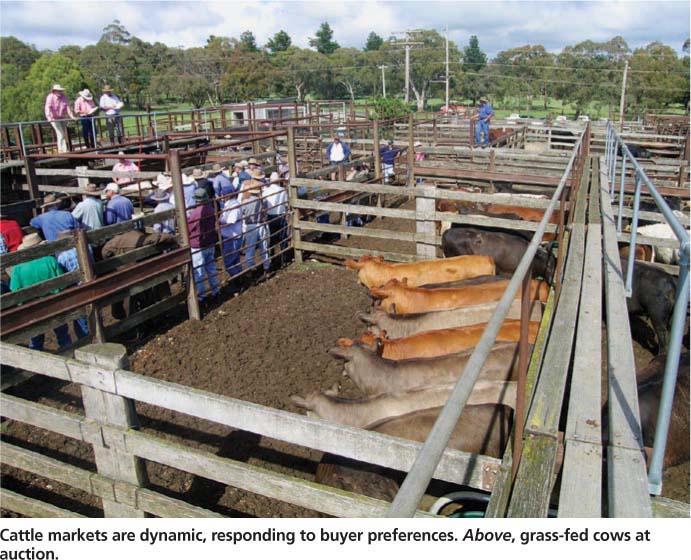
Cattle markets are dynamic, responding to buyer preferences. Above, grass-fed cows at auction.
For years, California cattle ranchers suspected that buyers offer lower prices here than for similar cattle in the Midwest. They were correct. A study conducted in 2004 and 2005 by UC scientists showed that feeder cattle prices were discounted by increasing amounts in markets located farther west, relative to Midwestern prices (Blank et al. 2006). The primary reason is the Midwestern location of most feedlot, slaughter and packaging facilities; ranchers in California and other Western states are essentially paying to ship calves to these facilities. Transportation costs are the basis of these price discounts (Goodwin and Schroeder 1991; Clary et al. 1986). These results are alarming for California cattle ranchers because, with transportation costs increasing rapidly, their cattle price discounts can be expected to increase over time.
Western ranchers have long sought to counter location price discounts by applying management practices that add value to cattle. Cattle markets signal what they value by offering a price premium for the desired characteristics (Mintert et al. 1990; Schroeder et al. 1988; Faminow and Gum 1986). For example, Blank et al. (2006) found that preconditioning weaned calves adds to their sales value. (Preconditioning is a vaccination management program that makes calves more valuable to buyers.)
Cattle that are weaned and have recieved respiratory vaccines generally receive higher average prices than unvaccinated calves (King 2003; Bulut and Lawrence 2007; Chymis et al. 2007). However, an Oklahoma State University study found price premiums for preconditioned calves, but not enough to cover preconditioning costs (Avent et al. 2004). Blank et al. (2006) warned that this was increasingly likely as preconditioning changed from market niche to market norm. Their results also showed that many interactive factors influence cattle prices. In fact, when preconditioning and weaning effects were evaluated separately, weaning had a larger positive effect on feeder cattle prices. The price premiums for preconditioning, weaning and other value-adding factors changed over time, indicating the dynamic nature of Western cattle markets.
In 2008, we conducted research broadening Blank et al. (2006) to include yearling sales and found that Western cattle markets are indeed dynamic, as evidenced by several changes in management practices applied by ranchers and the pricing observed in calf and yearling cattle markets. Our study focused on price differences across locations and estimated average transport-based price discounts and individual value-added-program premiums received by ranchers. The new analysis shows that transportation-based discounts are increasing over time, and the pricing of value-adding factors such as preconditioning is changing as markets adapt to new supply-and-demand conditions. Our analysis included both calves and yearlings because previous studies have indicated that these two cattle-market segments have unique prices (Marsh 1985; Garoian et al. 1990).
New, expanded study
Western Video Market provided us with anonymous information on steers from 4,116 lots of calves and 5,147 lots of yearlings sold in all of their video auctions from 1997 through 2007. All calf lots had a flesh score of medium, a frame score of medium or medium-large and average weights from 500 to 625 pounds, to focus on the price effects of calf management at weaning. Yearling lots averaged from 750 to 925 pounds. No calves or yearlings between 625 and 750 pounds were considered, to limit and focus the study.
The number of calf lots sold per year increased from 154 in 1998 to 540 in 2007, and yearling lots from 234 in 1997 to 590 in 2007. In total, our data included approximately 571,000 calves and 874,000 yearlings. Cattle from split loads, the Holstein breed or of Mexican origin were not considered.

We used sales information from video auctions because they operate much like a traditional auction, but with a much larger pool of potential buyers from across the country. Cattle sale prices observed in video auctions are often more indicative of national prices than local cash sales (Bailey et al. 1991). The data enabled us to analyze sales made at the same time at different locations across the West. Western Video Market is operated in a manner typical of video sales operations, with auctions broadcast via satellite almost every month of the year ( www.wvmcattle.com ).
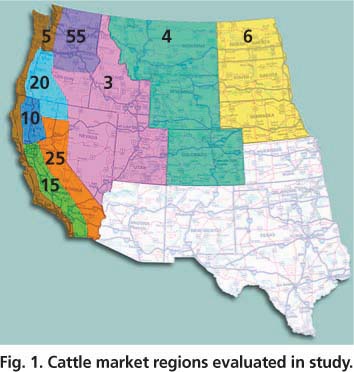
Our analysis was simplified by grouping the sales data into market regions based on the pooling and flow of cattle over recent years (fig. 1) (Bailey et al. 1995). The out-of-state regions (3, 4, 55 and 6) are large, often covering entire states, whereas California was divided into three regions (10, 15 and 25) to enable detailed analysis. For example, region 20 covers western Oregon, the northwest corner of Nevada and the northeast corner of California. Also, a new region (5) was added, the coastal areas of California, Oregon and Washington. Blank et al. (2006) did not evaluate this “fog” region, but in recent years ranchers have indicated that the coastal area may be receiving price discounts even larger than neighboring areas.
Other information available for each of the lots included animal characteristics, such as breed, and details about each sales contract. Statistical regression models enabled us to estimate the effects on sales price of not only location, but also other variables that commonly influence cattle prices.
Regional price discounts
Blank et al. (2006) explained that according to economic theory, cattle prices are expected to be highest nearest to the feedlot and meat processing facilities, which are located mostly in the Midwest. The economics of transporting inputs (including calves and yearlings) make it most cost effective to ship the most valuable input (on a per-pound basis) to the least valuable (or most bulky) input, the feed grains. Therefore, facilities that combine inputs, called feedlots, are mostly located near the source of feeds. Likewise, the output of feedlots, fed cattle, are the primary input for slaughterhouses and other meat processing operations, so those facilities are usually located near feedlots to reduce the costs of shipping live cattle.
The structure of the cattle and meat industries developed to minimize total transport costs (Clary et al. 1986). The bottom line for cattle ranchers is that the price received depends on their location relative to the buyer's location. Our study results are consistent with this theory (table 1), based on the average price discount or premium received by cattle producers in each market region after accounting for price effects due to other factors from 1997 through 2007. For example, calf prices in region 10 (northwestern California, except the coast), show an average discount of $8.77 per hundredweight (cwt) relative to region 6, which was used as the base because it includes the active cattle market in Nebraska.
Regional results for both calves and yearlings were generally consistent with the theory that average price discounts will be larger the farther away the seller is from the Midwest (fig. 1). The regional discounts were smaller for yearlings than calves, but with the same geographic pattern.
We evaluated the location price discounts by year to see if they changed over time (tables 2 and 3), and found differences in average discounts from one year to the next in 11 sets of regression results. Those changes imply that transportation costs are not the only source of price discounts between the Midwest and other regions; they also reflect changes in relative supply and demand. However, the fact that the discounts were usually higher for regions farther from the Midwest supports the conclusion that transportation costs are a major source of observed price differences.
To formally test whether the regional discounts increase over time, we performed separate regression analyses (tables 2 and 3). First, the amounts were adjusted for inflation by converting them into “real” terms using the Consumer Price Index, then the real discounts for each region were plotted over time (fig. 2). For both calves and yearlings, there was a clear downward trend, indicating that the discounts were indeed growing larger, on average, over time. Finally, the 11 annual observations for each region were regressed against a time trend, and for both calves and yearlings in nearly every region there was a statistically significant result. The average real increases per year in the discounts were about $0.35 to $0.77 per hundredweight for calves and about $0.29 to $0.39 per hundredweight for yearlings in the far western regions, but much less in region 4.


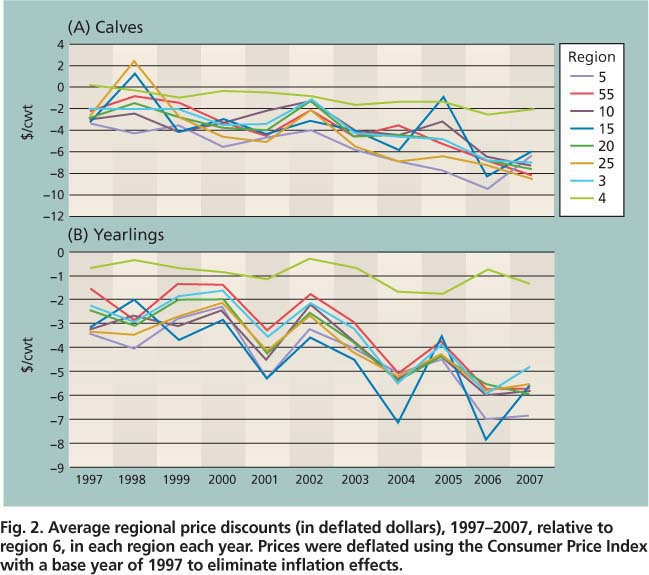
Fig. 2. Average regional price discounts (in deflated dollars), 1997–2007, relative to region 6, in each region each year. Prices were deflated using the Consumer Price Index with a base year of 1997 to eliminate inflation effects.
We found that mean price discounts increased over time, with transportation cost increases adding approximately $0.30 to $0.40 per hundredweight annually to the average discount to Western cattle producers, compared to their Midwestern competitors.
Value-added programs
In addition, we evaluated location and price effects of several value-adding programs (table 1). Reasons for not adopting these programs vary widely (Gillespie et al. 2007), and can include a rancher's unfamiliarity with a practice, nonapplicability of the program, cost and preference. Some programs became more popular from 1997 to 2007, whereas others grew and then faded. For example, preconditioning grew from a niche to the norm — in 1997, only 11% of calf lots and 17% of yearling lots sold were preconditioned, but by 2007 the market share had expanded steadily to 68% and 60%, respectively.
Natural beef.
An interesting comparison is “natural beef,” which means no implants, antibiotics or ionophores (another medication) are given to the animal, versus the use of implants (hormone delivery tools that stimulate growth). No calves were sold as “natural” until 1999, but lots of such calves increased slowly to 13% in 2003 before increasing rapidly to 38% in 2007; the pattern in yearling sales was similar, increasing from 1% in 1997 to 7% in 2003 and 28% by 2007. This uptrend in natural cattle approximately mirrors a downtrend in the use of implants. Forty percent calf lots and 65% of yearling lots were sold as implants in 1997, but those market shares declined steadily to 14% for calves and 47% for yearlings in 2007. Clearly, the two market segments view implants differently, with demand always higher for use with yearlings.
Market fads.
Finally, a few value-adding programs were market fads that came and went quickly. One example is the industry's “Born and Raised in the USA” program (domestic born in table 1). It was created in response to the BSE (bovine spongiform encephalopathy or “mad cow” disease) events that adversely affected cattle prices early in this decade (Marsh et al. 2008), but disappeared as soon as the issue was resolved. The domestic-born program represented almost 9% of calf lots and just under 1% of yearling lots sold during 2003, but by 2004 only 1.5% of calves and no yearlings were sold. The program disappeared as the new USDA Country of Origin labeling program was being developed.
Program price premiums
Our study results indicate how much the average price received was affected by the presence of an attribute (table 1). Nearly all factors had a significant effect on calf and yearling prices. For example, calves that had not been weaned at the time of sale received an average price that was $3.59 per hundred-weight less than calves weaned 30 days or longer. For yearlings, we found a $0.72 per hundredweight discount for cattle fed from hay lots only, compared to cattle fed on pasture only.
With regard to three value-adding factors — preconditioning, implants and natural beef — our results were similar to those of Blank et al. (2006) and consistent between the market segments for calves and yearlings. Preconditioning and natural beef each got a larger price premium during our study period than in Blank et al. (2006) for their shorter study period, while implanting programs again had no significant effect on prices over the entire 1997 to 2007 period (table 1).
The catalyst for these changes was the dynamics of a competitive market, with sellers responding to buyers product preferences. Buyers wanted preconditioned and natural cattle during the 1990s, but few sellers were aware at first, so few ranchers were supplying such animals to the market. Over time cattle ranchers learned of the new market demands and began supplying those products.
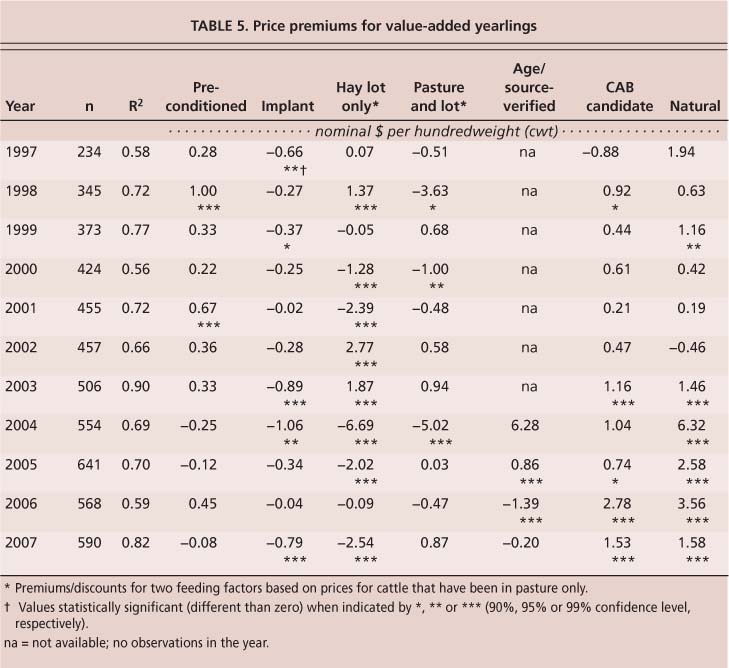
To see how cattle markets evolved with regard to value-adding programs, we estimated separate regression models for each of the 11 years for calves (table 4) and yearlings (table 5). The results show the volatility in cattle markets; no factor was statistically significant in every year. Due to the smaller number of observations (lots sold) each year, some factors had few significant annual results (tables 4 and 5) even though they had strongly significant results over the entire period (table 1).
ASV program.
The age and source-verified program (ASV), in which the rancher submits written verification of the animal's age and genetic source, is an example of this problem. Calves received a statistically significant price premium averaging $5.31 per hundredweight overall (table 1), but had a significant result in only 1 of the 3 years the program had been available at the time of the study (table 4). For ASV yearlings the problem is similar, with only two of four annual results statistically significant (table 5). With hundreds of observations for calves and yearlings each year, ASV lots constituted 62.5% of calf sales and 36% of yearling sales in 2005, but the shares fell to less than 15% for both markets in 2007. The small number of ASV observations per year made it difficult to measure price effects in separate years, but it appears that producers did receive a premium, on average, from the program. Also, the current ASV program is much different than the one operating during our study.
Preconditioning.
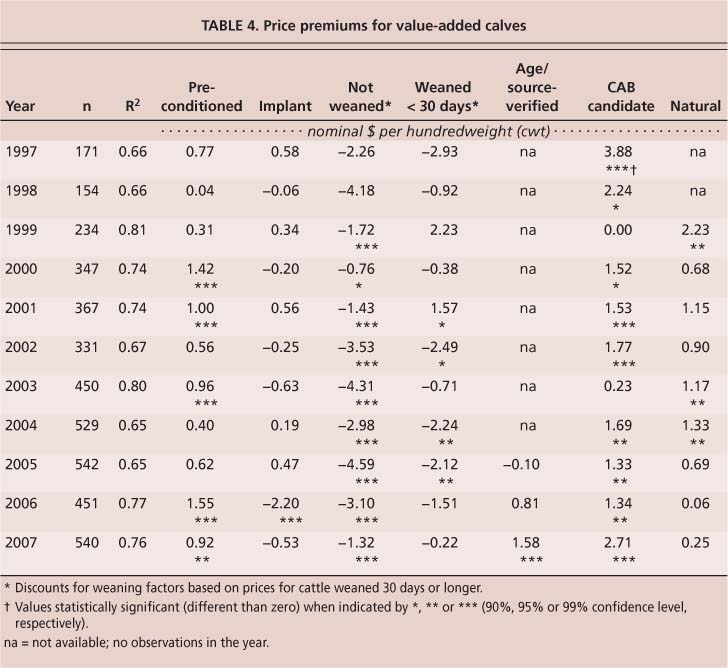
Annual results reflect the opposite trend compared to ASV, with preconditioning expanding during the study period to become the market norm (tables 4 and 5). With 68% of calves sold during 2007 being preconditioned, as well as 60% of yearlings, it appears that nonpreconditioned cattle are being discounted. For example, there was a price premium for preconditioning calves, but it was statistically significant in only 5 of the 11 years (table 4). With the small number of nonpreconditioned lots sold in some years, it was not possible to clearly detect how much market price was affected. This problem was even stronger for yearlings, where only 2 of 11 years had a statistically significant premium for preconditioning (table 5), ranging from $0.92 to $1.55 per hundredweight for calves and $0.67 to $1.00 per hundredweight for yearlings. However, over the entire data period preconditioning clearly brought ranchers an average premium of $1.37 per hundredweight for calves and $1.03 per hundredweight for yearlings.
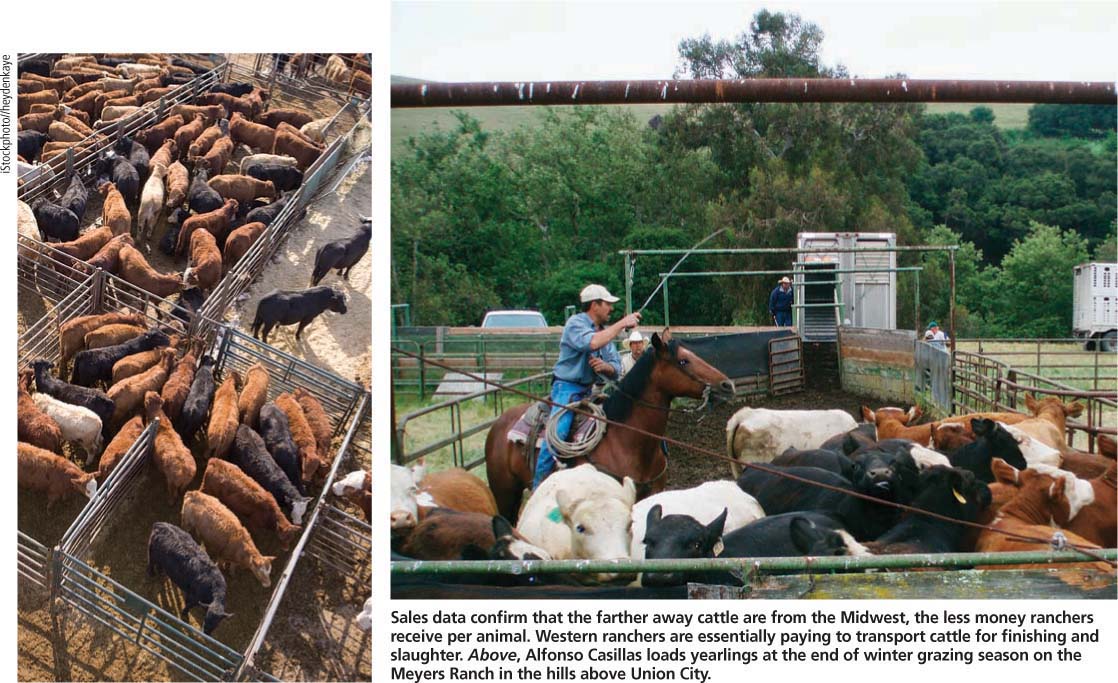
Sales data confirm that the farther away cattle are from the Midwest, the less money ranchers receive per animal. Western ranchers are essentially paying to transport cattle for finishing and slaughter. Above, Alfonso Casillas loads yearlings at the end of winter grazing season on the Meyers Ranch in the hills above Union City.
Certified Angus Beef.
Good statistical results were found for Certified Angus Beef (CAB) candidates, for which the rancher must provide written certification that the animal is pure Angus. Blank et al. (2006) did not evaluate this factor, but we added it to account for what appears to be a strong market preference (Jones et al. 2008). There were CAB candidate premiums for both calves and yearlings (table 1), but calves had statistically significant premiums in 9 of the 11 years (table 4) while yearlings had statistically significant premiums in only 5 of the 11 years (table 5). The conclusion that cattle markets preferred the Angus breed over the study period is supported by the results for other breeds (table 1), which received price discounts relative to Angus cattle, on average.
Weaning and natural beef.
Our study confirmed and expanded on the results of Blank et al. (2006) regarding two characteristics that received a price premium over the data period. First, our analysis gave similar results for calves, showing that unweaned cattle are discounted an average of $3.59 per hundredweight (table 1). However, increasing the length of time since weaning on the sale date did not always increase average prices further.
In our analysis, calf lots were divided into three categories: weaned the day of sale (“weaning 0”), weaned less than 30 days before sale (“weaning 1”) and weaned more than 30 days before sale (base group). In general, our results showed that the premium varied from one year to the next (table 4), but was statistically significant each year beginning in 1999.
We extended a similar analysis to yearlings and found that cattle fed from hay lots are discounted compared to those fed in pastures (table 1). Ranchers have hypothesized that yearlings purchased off grass pastures have more compensatory gains than yearlings in hay lots. To test this we divided yearling lots into three groups: those coming off pasture only (base group), hay lots only (“feed 1”) and both pasture and hay lots (“feed 2”). Yearlings fed in hay lots only were discounted in 8 of the 11 years (table 5).
Second, calves and yearlings that met the natural beef program requirements received a statistically significant premium, on average, but the premium's size and price was larger for yearlings than for calves (tables 4 and 5). This is consistent with prior studies (Boland and Schroeder 2002). Also, industry participants note that it is more difficult for cattle to remain “natural” as they advance through production (Brad Peek, Western Video Market, personal communication, Oct. 3, 2008).
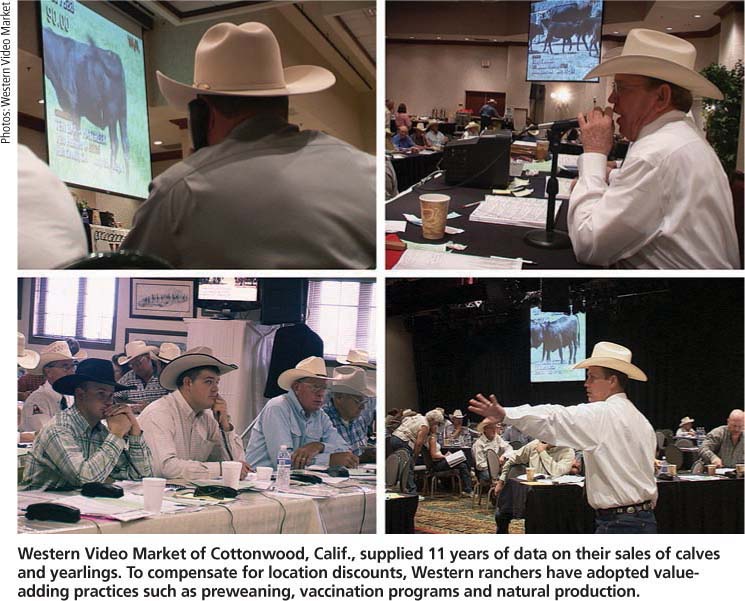
Western Video Market of Cottonwood, Calif., supplied 11 years of data on their sales of calves and yearlings. To compensate for location discounts, Western ranchers have adopted value-adding practices such as preweaning, vaccination programs and natural production.
In the future, natural beef premiums and their amounts will depend on competitive responses within the cattle market. If buyers continue to expand their demand for natural beef, price premiums will continue. However, as ranchers provide increased supplies of natural beef to the market, this natural niche may become the norm, and premiums will be competed away. This may already be occurring for calves, as indicated by price premiums in recent years. On the other hand, natural beef is still very much a niche for yearlings, as indicated by the larger and statistically significant premiums in recent years.
Cattle market structure
In the future, the existence of location discounts and their amounts will continue to depend upon the cattle market structure. As long as most feedlots and meat processing facilities are located in the Midwest, calves and yearlings raised in California will be sold at a price discount and shipped out of state.
This leaves ranchers in California and other Western states with few ways to raise the average price recieved other than value-adding innovations, such as weaning calves before they are sold, or by using natural production methods for calves and yearlings. These factors can result in higher average market prices. However, ranchers will have to determine for themselves whether the associated costs are lower than the price benefits.
Beef producers are moving toward more standard use of preconditioning programs involving more value-adding use of vaccinations, and buyers are beginning to reflect consumers' preferences for cattle that are free of rancher interventions. The Western cattle industry's future may involve discovering new market trends and quickly changing practices to produce a profitable niche product.
Video market data for calves and yearlings confirms price discounts for Western cattle

