


All Issues
Most West Coast agricultural cooperatives are financially competitive
Publication Information
California Agriculture 61(4):172-176. https://doi.org/10.3733/ca.v061n04p172
Published October 01, 2007
PDF | Citation | Permissions
Abstract
Agricultural producers and lenders have expressed concerns about the highly publicized financial difficulties experienced by some agricultural cooperatives. This study analyzes the comparative financial performance of cooperatives and investor-owned firms in four sectors: fruits and vegetables, dairy, farm supply and grain. Standard financial ratios measuring profitability, liquidity, leverage and asset efficiency were analyzed for 1991 through 2002. The overall financial performance of cooperatives on the West Coast was on par with that of similar investor-owned firms.
Full text
Cooperatives are corporations that are owned and governed by the firms or people who use them; they differ from other businesses because they operate for the benefit of their members, rather than to earn profit for investors. Cooperatives have played an important historical role in promoting the economic welfare of California's agricultural producers. Recently, however, reports regarding the financial difficulties experienced by U.S. agricultural cooperatives have been much more common than news of their successes. In particular, the 2002 bankruptcy of Farmland Industries — a federation of 1,700 independent Midwestern cooperatives and the nation's largest agricultural cooperative — received considerable media attention. In California, news about cooperatives has centered on the bankruptcy of Tri Valley Growers in 2000; the dissolutions of Blue Anchor and the Rice Growers Association of California in 2000; and the conversions of Calavo in 2001 and Diamond Walnut Growers in 2005, to publicly traded, investor-owned corporations.
Such news has raised concerns among producers and lenders regarding the viability of the cooperative form of agricultural business. In the agricultural sector, producers use cooperatives to market and process their crops and livestock, purchase supplies and services, negotiate terms of trade with processors of their raw product, and provide credit for their operations. An international management consulting firm, McKinsey & Company, issued a report in 2002 alleging that agricultural cooperatives “destroy value” because few cooperatives “have changed the way they operate” (Dempsey et al. 2002). This report received considerable attention from the management and boards of numerous large cooperatives, despite the fact that its analysis was based on only 2 years of data. Some cooperative researchers also noted other technical limitations.
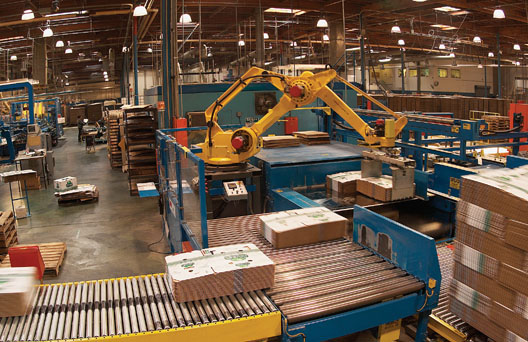
Agricultural cooperatives were created to benefit member farmers, rather than investors. Above, Fruit Growers Supply Company is a 100-year-old cooperative that supplies citrus packinghouses with cartons from its plants in Ontario and Visalia, Calif.
Was McKinsey & Company's claim that agricultural cooperatives destroy value justified? Or do cooperatives benefit California's agricultural producers? What is the future for agricultural cooperatives in California?
Economic role of cooperatives
Cooperatives have been part of the agricultural sector in the United States for approximately 200 years. They can benefit their members in several different ways. In the Midwest, cooperatives were formed primarily to maximize the welfare of their individual members. These cooperatives handle the entire output of their members regardless of market needs, and are clearly extensions of their members' farming businesses. Conversely, many of the marketing cooperatives formed in California during the first quarter of the 20th century were designed to create market power by improving product quality and restricting raw product flows. Such market power-oriented cooperatives seek to maximize the profitability of the firm, rather than the welfare of individual members.
These different objectives can have vastly different impacts on the operations of cooperatives. A cooperative with a market-power structure could operate in niche markets with a strong brand identity and handle limited volumes of member product to maximize its profitability as a firm. This type of cooperative would then distribute some or all of its earnings to its members. Some of these cooperatives, such as Mountain States Lamb, require members to buy enough delivery rights to match their delivery volumes. Members must invest in a delivery right for each lamb they deliver annually to Mountain States Lamb for processing and marketing. The delivery rights control the amount of raw product delivered by members; they depend on the processing capacity of the cooperative's plant. Investment in delivery rights is part of a producer marketing agreement. If a producer is unable to deliver the agreed amount of raw product, purchase of commodities is authorized by the cooperative for undelivered obligations. Such delivery rights are marketable and can appreciate in value if the cooperative is successful. For example, the founding members of Dakota Growers Pasta paid $3.85 in 1991 for a right to deliver a bushel of durum wheat annually to the cooperative. By 1998, the cooperative's strong earnings enabled retiring members to sell a delivery right for $7.50.
In contrast, a Midwestern-style marketing cooperative could maximize benefits to its members by accepting their deliveries up to its break-even point, which would provide as much of a home for their product as possible without incurring losses. While this decreases the members' potential earnings from the cooperative, it also reduces the risk they face.
Comparative financial analysis
Past nationwide studies
It is inappropriate to assume that all cooperatives are seeking to maximize their profitability as firms. Nonetheless, various national studies were conducted during the late 1980s that compared the financial performance of agricultural cooperatives and investor-owned firms (IOFs). The findings from these studies varied widely (Lerman and Parliament 1990; Parliament et al. 1990; Schrader et al. 1985).
These financial performance studies used ratio analysis, including profitability measures. Ratio analysis is a tool used to evaluate a firm's financial performance by taking data from its financial statements and comparing the ratios over time, and/or with those for other firms or the industry. However, Sexton and Iskow (1988) pointed out how analyses of cooperatives based upon financial ratios, although popular, were not based on economic theory. Specifically, they noted that since cooperatives are extensions of their members' businesses, a cooperative could be less profitable than an investor-owned firm and still be beneficial to a member — as long as the member's discounted stream of returns from the cooperative was greater than those from marketing the commodity directly or through an investor-owned firm. For example, membership in an almond marketing cooperative that is averaging a 6% operating margin while one of its investor-owned competitors is averaging a 10% operating margin could still be beneficial to the cooperative's members. Members could receive a higher price for their almonds from the cooperative than if they sold their crop to the investor-owned firm; the investor-owned firm strives to minimize its costs, including the price it pays for its almonds.
Glossary
Glossary
Asset efficiency: Ability to generate revenue from assets.
Current ratio: Current assets divided by current liabilities; an indicator of liquidity.
Debt-equity ratio: Long-term debt divided by total equity; an indicator of degree of leverage.
Equity: Net worth; total assets less total liabilities.
Investor-owned firm (IOF): A business owned by multiple investors seeking to maximize their returns, as opposed to a sole proprietorship, member-owned cooperative or public agency.
Leverage: Use of debt to finance a firm's assets.
Liquidity: Ability to convert assets into cash in order to meet debt repayment obligations.
Operating margin: Measure of what proportion of a company's revenue is left over after paying for variable costs of production (such as wages and raw materials) to pay its fixed costs (such as interest on debt); a measure of profitability.
Profitability: Ability of a firm to generate net income.
That said, critical stakeholders of cooperatives — members, management and lenders — are used to measuring performance; financial ratios provide the most readily available tool to compare cooperative and investor-owned firms.
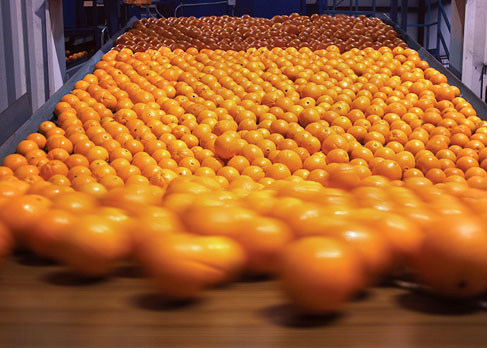
A 12-year economic comparison of cooperatives and investor-owned firms on the West Coast found that fruit and vegetable cooperatives had higher operating margins but also more annual volatility. Above, oranges at the Sunkist Growers cooperative, which was formed 114 years ago to market California and Arizona citrus.
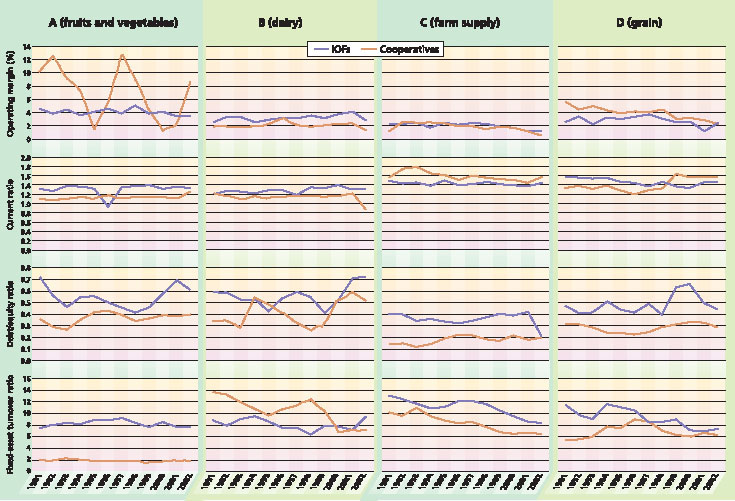
Fig. 1. Comparison of financial ratios for West Coast agricultural cooperatives and U.S. investor-owned firms (10Fs) in (A) fruits and vegetables, (B) dairy, (C) farm supply and (D) grain sectors, for 1991–2002.
Current West Coast study
Given recent concerns expressed about the viability of cooperatives, we compared the financial performance of agricultural cooperatives and investor-owned firms in similar sectors, and of comparable size as measured by total assets. The sample was 41 cooperatives in four West Coast sectors: 11 from fruits and vegetables, 5 from dairy, 14 from farm supply and 11 from grain. Due to the small number of cooperatives in some California sectors, the analysis was expanded to include Oregon and Washington to protect confidentiality.
The specific financial ratios analyzed are indicators of profitability, liquidity, leverage and asset efficiency (; table 1). Annual financial ratios were calculated for each sector by aggregating data for the 1991 to 2002 study period. Data from the financial statements of the 41 cooperatives was provided by CoBank, the largest lender to agricultural cooperatives in the United States. Aggregated financial data for the investor-owned firms was obtained from various issues of the Risk Management Association publication Annual Statement Studies (RMA 1991–2001). Over the time period covered by the study, the number of investo–owned firms included in the RMA reports ranged by sector from: 27 to 268 for fruits and vegetables, 20 to 162 for dairy, 297 to 1,024 for farm supply, and 28 to 291 for grain.
Average financial ratios
There was considerable variation between sectors in the averages for the ratios studied (table 2). Except for grain, there were no consistent results for the three profitability measures. For example, the fruits and vegetable cooperatives had higher average operating margins but lower average rates of return on assets and equity than their investor-owned-firm counterparts.
The average liquidity of dairy cooperatives was lower, but their average leverage was also lower and their asset efficiency was higher than those for their investor-owned-firm counterparts. There were similarly mixed results in the farm supply and fruits and vegetables sectors. The grain cooperatives had higher averages than the investor-owned firms for all three profitability measures, but the averages were mixed for other ratios. The most consistent result was that, in all four sectors, cooperatives averaged lower levels of leverage than their investor-owned-firm counterparts.
Performance trends
Based solely on visual observations, we compared trends in the financial ratios of cooperatives and their investor-owned-firm counterparts. For each sector, we reviewed trends in four financial indicators: the operating margin (one of the three profitability measures), as well as liquidity, leverage and asset utilization. A more rigorous analysis is presented in a detailed research paper, which is available from the lead author ( http://hardesty.ucdavis.edu ).
Fruits and vegetables
Some of the fruit and vegetable cooperatives and investor-owned firms included in this study market only fresh produce, while the others are involved in drying, canning and/or freezing. Compared to the investor-owned firms, the cooperatives had a higher average operating margin, but with greater volatility from year to year (fig. 1A). Similarly, the rates of return for cooperatives on equity and assets were cyclical. The fruit and vegetable cooperatives also had less liquidity, averaging 0.2 points less than the investor-owned firms for the current ratio. However, the fact that the cooperatives averaged $0.20 less in current assets than their investor-owned counterparts to cover each dollar of their current liabilities was counteracted by the cooperatives' lower use of debt. The most noticeable difference was that the investor-owned firms had significantly higher asset utilization, generating an average of $6 more in sales per dollar of fixed assets than the cooperatives.
Dairy
The dairy cooperatives and investor-owned firms process fluid milk into cheese, butter and other dairy products. Overall, the financial performances of cooperatives and investor-owned firms in dairy were comparable (fig. 1B). The investor-owned firms had better margins on operations and maintained higher liquidity than cooperatives during the entire study period. On the other hand, the dairy cooperatives were less leveraged than the investor-owned firms and had higher rates of asset utilization until the final 3 years of the 12-year study period.
Farm supply
The farm supply cooperatives and investor-owned firms primarily sell seed, packing materials, fertilizer and equipment. Again, the overall financial performances of the two types of firms in the farm supply sector were comparable (fig. 1C). The operating margins of the two types of firms were very stable and similar throughout the 12-year study period. These cooperatives had higher liquidity, but this advantage diminished over time. Farm supply cooperatives consistently had less leverage than their investor-owned-firm counterparts. However, their asset efficiency rates were also consistently lower than those of the investor-owned firms.


TABLE 2. Average financial ratios by sector and firm type (cooperatives and investor-owned firms), 1991–2002
Grain
The grain cooperatives and investor-owned firms are mainly engaged in storage and milling. The overall financial performance of the two types of firms was comparable over time (fig. 1D). The cooperatives had higher, but declining, operating margins than the investor-owned firms. While the investor-owned firms initially had higher liquidity, this situation reversed itself in the late 1990s. As in the other sectors, grain cooperatives carried lower levels of leverage than their investor-owned-firm counterparts. The advantage of investor-owned grain firms with regard to asset efficiency has diminished.
Performance is comparable
Contrary to popular belief, we found that the overall financial performance of cooperatives was on par with that of similar investor-owned firms. The only consistent difference regarding profitability was that all three of the profitability ratios of grain cooperatives were higher than those of their investor-owned-firm counterparts; however, the relative advantage of grain cooperatives has been declining over time. Although fruit and vegetable cooperatives averaged higher profitability levels than the investor-owned firms, their profitability was noticeably cyclical. Liquidity levels were relatively stable, and differences between the two types of firms were small during the 12-year study period.
Cooperatives in all sectors had lower debt/equity ratios than their investor-owned-firm counterparts. This finding is surprising for several reasons: (1) cooperatives have access to fewer sources of equity capital than investor-owned firms, (2) members want to maximize cash payments from their cooperatives, and (3) members do not value the equity they have within cooperatives. The lower leverage levels of cooperatives warrant further research.
The fact that cooperatives had lower asset efficiency than their investor-owned-firm counterparts in three of the four sectors evaluated (grain, fruits and vegetables, and farm supply) appears problematic initially. However, this result is consistent with the economic role of cooperatives: many are expected to provide a home for their members' product and need to maintain excess capacity. It is not surprising that this hypothesis did not hold for dairy cooperatives, since dairy producers tend to have consistent production volumes and market their production through only one source, thus reducing their cooperative's need for excess capacity.
Among the four sectors included in this analysis, only the fruit and vegetable cooperatives displayed general weakness. Cooperatives in general have a tendency to market a high proportion of undifferentiated, low-value-added products (Sexton and Iskow 1988). Clearly, this tendency could explain both the sharply lower asset-utilization rates and cyclical profitability of fruit and vegetable cooperatives. If the investor-owned firms market a higher proportion of value-added products, they are more likely to maintain year-round utilization of their processing equipment and to have returns that are less susceptible to the highly competitive international market for undifferentiated canned fruits and vegetables.
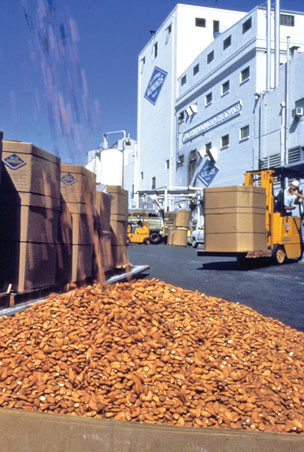
In general, the overall financial performance of agricultural cooperatives was similar to that of investor-owned firms, indicating that this is still a viable business model. Above, Sacramento-based Blue Diamond is owned by about 3,000 growers and is the world's largest tree-nut marketer and processor.
Although Hariyoga and Sexton (2004) concluded that the cooperative structure of Tri Valley Growers was not a major factor in its bankruptcy, this sector warrants further analysis. Given the declining business volumes and membership levels of all cooperatives, their long-term viability may depend on their ability to reduce costs substantially as processors of undifferentiated products or to enhance their capabilities as marketers of value-added products.
With the exception of the fruit and vegetable sector, this study found that the overall financial performance of agricultural cooperatives on the West Coast has been comparable to that of investor-owned firms over the 12-year study period. These findings should alleviate the concerns expressed by producers and lenders regarding the viability of most agricultural cooperatives.
Furthermore, use of the cooperative structure in California's agricultural sector continues to evolve. Earlier this year, tomato growers in California formed a cooperative to gain market power by improving quality and food safety standards. Its members are required to pass field and packinghouse audits and are expected to adopt a comprehensive set of good agricultural practices regarding pesticide use as well as fair treatment of farm and packinghouse workers. Orange marketers recently created a marketing agency in common called the California Citrus Growers Association. The objective of this “cooperative of cooperatives” is to voluntarily control product flows and restore the market power lost by producers when the federal marketing order was eliminated. Meanwhile, cooperative bargaining associations are branching out and collaborating with their bargaining partners to fund research and marketing programs to strengthen markets for their members' products ( see page 177 ). These recent developments, along with this review of how cooperatives perform financially, clearly indicate that cooperatives continue to promote the economic welfare of agricultural producers on the West Coast.
Most West Coast agricultural cooperatives are financially competitive

