


All Issues
Dietary quality is not linked across three generations of black women
Publication Information
California Agriculture 60(3):154-159. https://doi.org/10.3733/ca.v060n03p154
Published July 01, 2006
PDF | Citation | Permissions
NALT Keywords
Abstract
Many nutritionists believe that food habits are passed on from one generation to the next, influencing dietary quality. However, we studied the food habits and dietary quality among three generations of biologically related black women and found that there was no correlation or relationship. In addition, we identified culturally acceptable food sources of nutrients most likely to be lacking in the diets of black women. The increased consumption of these foods may help reduce the high rates of chronic diseases among black women in California.
Full text
For many health conditions, African-Americans bear a disproportionate burden of disease, injury, death and disability, and thus suffer from health disparities. In 2001, for example, about 40% of black males and females had cardiovascular disease, versus 30% for white males and 24% for white females in the United States (AHA 2006). In the same year, the age-adjusted incidence rates per 100,000 of cancer were substantially higher for black females than white females for colon/rectal (54.0 versus 43.3), pancreatic (13.0 versus 8.9) and stomach (9.0 versus 4.5) cancers (ACS 2000). The prevalence of diabetes is 70% higher among blacks as compared to whites in the United States, and among those with diabetes, blacks are 1.5 to 2.5 times more likely to suffer from lower limb amputations and 2.6 to 5.6 times more likely to suffer from kidney disease (ADA 2006).
These health risks are partly due to poor dietary habits, including diets high in fat, calories (Tibbs et al. 2001), sodium and cholesterol (Hargreaves et al. 2002), and low in fruits and vegetables (Tibbs et al. 2001) and dietary fiber (Hargreaves et al. 2002). Improving the diets of African-Americans is one of the simplest and most effective ways to reduce their risk of chronic disease and improve their overall health.

To gauge how food habits are passed down through generations, the authors studied the diet and nutritional status of 58 triads (daughter, mother and grandmother) of biologically related California black women. Left to right, study participants Rhonda Carter (mother) and Mildred Ross (grandmother) of Victorville, and Catrice Mitchell (daughter) of San Bernardino.
The successful promotion of nutrition awareness among African-Americans should include health education programs that are tailored to their community, because the need for cultural appropriateness in such programs is well documented (Marin et al. 1995). In addition, research to identify influences on disease and disease management is essential for successful national prevention efforts (Clark and McLeroy 1995). Research on psychosocial characteristics is critical and should focus on attitudes, norms, values and expectancies related to health-damaging or health-protecting behaviors. Such research, investigating health-damaging behaviors and the avoidance of prevention-oriented actions, is urgently needed if these behaviors are to be reduced (Marin et al. 1995). Certainly, improvement in nutrition status and disease prevention in blacks should include research into cultural and psychosocial factors that affect food habits and dietary quality.
Generational dietary studies
One possible influence on dietary quality is the passing down of food habits in families from one generation to the next, a notion often promulgated by nutritionists. If that were the case, one would expect to see some relationship between the dietary intakes of succeeding generations. Surprisingly, there are few published studies examining resemblances in food habits, dietary quality and nutrient intakes across generations of biologically related adults.
A study of three generations of Dutch women living separately found weak correlations of nutrient intake (energy, fat and cholesterol) between generations (Stafleu et al. 1994). Similarly, a study of parents and children in France found weak correlations for energy and macronutrient intakes between generations (Vauthier et al. 1996). In contrast, a study of three generations of Canadians (children, mothers and maternal grandmothers) found differences in dietary patterns between generations, and the researchers suggested that generations may respond differently to nutrition recommendations and dietary guidelines (Lemke et al. 1998). For example, the mothers' number of servings of fats and oils was significantly higher than that of the children and grandmothers, while children had the highest number of servings of sweets and desserts.
Researchers often report differences in food habits or nutrient intakes between ethnic or cultural groups (Clark and McLeroy 1995; Lovejoy et al. 2001; Huang et al. 2002; Forshee et al. 2003). We wanted to look at differences within one ethnic group. Significant differences have been found within an ethnic group (Native Americans) by dividing the women into two groups: more adequately nourished and less adequately nourished (Ikeda et al. 1998). The researchers identified eating habits that were associated with the more adequately nourished women, and then used them as the basis for nutrition education within the Native American community. In other words, the positive habits of the more adequately nourished women were held up as models for less adequately nourished women within the same ethnic group.
UC Cooperative Extension nutritionists conducted a survey of food habits and dietary quality among three generations of biologically related black women: daughters, mothers and grandmothers. The purpose of the survey was to identify generational relationships and information about attitudes, beliefs and dietary practices that could be used to design culturally appropriate approaches to nutrition education for black women. The study was intended to help determine whether different approaches and messages need to be tailored for each generation. The researchers also wanted to identify health perceptions and practices related to food acquisition and preparation that could be used to design culturally appropriate nutrition education materials for black women.
ABBREVIATIONS
AI: Adequate Intakes
DRI: Dietary Reference Intake
LAN: Less adequately nourished
MAN: More adequately nourished
RDA: Recommended Dietary Allowance
Nutrition survey
An advisory committee of Nutrition Advisors (Cooperative Extension Nutrition, Family and Consumer Science Advisors), most of whom were black, guided the study. Based on their extensive professional experience, these advisors determined the kinds of information most useful in designing culturally appropriate nutrition education programs for black women. (Permission to conduct this study was obtained from the Committee for the Protection of Human Subjects at UC Berkeley.) The committee chose to focus on food acquisition practices, food preparation skills, meal and snack patterns, and health practices and beliefs. A questionnaire was developed and reviewed by the advisory committee for cultural relevance and appropriateness. The revised questionnaire was pilot-tested on five women from the target population.
The Nutrition Advisors could not identify a food frequency questionnaire designed specifically for blacks, so a 24-hour food recall was used to collect dietary intake data. The 24-hour food recalls were used to determine nutrient intake and the number of servings from the major food groups.
Study participants were recruited through the Expanded Food and Nutrition Education Program (EFNEP), churches and other organizations serving black communities. Participants were interviewed in their homes, unless they preferred another location.
The Nutrition Advisors measured the heights and weights of participants, using electronically calibrated scales and stadiometers (used to measure height). This information was used to investigate the relationship between body mass index (BMI) and self-reported food habits and dietary quality. Demographic information collected included age, county of residence, birthplace, length of time in California, education, family size, income and participation in federal food-assistance programs. Nutrition Advisors responsible for data collection attended an all-day training meeting on instruments and the standardized methods of implementation.
All data was sent to the Department of Nutritional Sciences and Toxicology at UC Berkeley for coding, computer entry and data analysis. The food recalls were coded by a dietitian, who also determined the number of servings from each of the major food groups. To assess dietary quality, the 24-hour food recalls were analyzed using the U.S. Department of Agriculture (USDA) Nutrient Database for Individual Intake Surveys (v. 4, 1991, Human Nutrition Information Service, Hyattsville, Md.). Mean and median values were calculated for 15 nutrients, as were the percentages of the 1997 to 2003 Dietary Reference Intakes (DRIs), specifically using Recommended Dietary Allowance (RDA) and Adequate Intake (AI) values (U.S. Institute of Medicine 1997, 1998, 2000a, 2000b, 2005). DRIs are a set of at least four nutrient-based reference values that can be used for planning and assessing diets and for many other purposes. They are meant to replace the former RDAs. Due to the large standard deviations in nutrient intakes, the women were categorized on the basis of the number of nutrients at or above two-thirds of the DRI. This yielded a more accurate description of dietary quality, and a score was given to each participant based on the number of nutrients at or above two-thirds of the DRI.

While the dietary quality of grandmothers appeared to be related to that of the mothers, by the next generation of daughters this positive influence had waned. Left to right, study participants Michelle Beauregard (mother), Valerie Pope-Ludlam (grandmother) and Valerie Beauregard (daughter), all of San Bernardino.
Women were categorized as “more adequately nourished” (MAN) if their diets contained two-thirds or more of the DRI for at least 12 of the 15 nutrients, or as “less adequately nourished” (LAN) if their diets did not meet two-thirds of the DRI for at least three of the 15 nutrients. Even though using two-thirds of the RDA/AI as a criterion to define nutrient adequacy is not a common procedure, this value was selected as a convenient cut-off point to distinguish nutrients that were very low in a diet, such that the LAN scores could be derived to describe diets that were inadequate in multiple nutrients. The data was collected in 1995 and reanalyzed for the RDI amounts issued in 1999. This data reflects the dietary relationship of three generations at a point in time when health disparities were becoming an important issue in minority communities.
The food habit questionnaires were also analyzed to determine which habits were related to dietary quality (including dieting history, attitudes toward and perceptions of healthy food practices, and food security issues), and which habits were related to the frequency of specific eating patterns (such as snacking, eating at fast food restaurants and watching television during meals).
Statistical analysis
Chi-squared methods were employed to evaluate the relationship of dietary quality with categorical variables, while two sample t-tests were used for continuous variables. Multiple regressions techniques were used, adjusting for energy/calorie intake. Because subjects from the same family are not statistically independent, a generalized estimating equation program was used to adjust for correlations within families (Karim and Zegen 1988). Repeated measures analyses of variance (RANOVA) were conducted to compare the three generations for food group intakes. For all statistical tests performed, P < 0.05 was considered to be statistically significant.
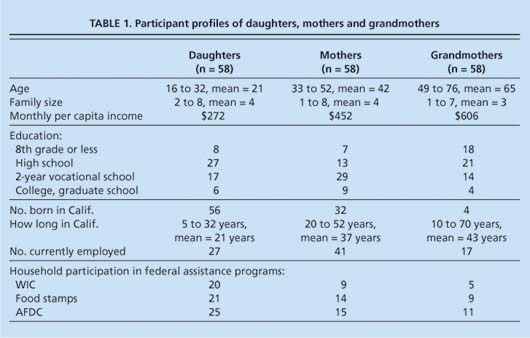

Fig. 1. Dietary quality by generation (n = 58 triads). MAN = more adequately nourished; LAN = less adequately nourished.
Diet quality not linked in families
We were able to profile 58 triads of biologically related daughters, mothers and grandmothers (174 women total) (table 1). The number of participants born in California increased with each generation. Almost all of the daughters were born in California, whereas most of the grandmothers were born in the South. Each generation of daughters was increasingly dependent on WIC and food stamps; the impact of this trend on dietary quality was investigated and found to be null. When choosing our subjects, we made sure that there was little overlap between the ages of the three generations, so that each generation would have experienced social, cultural and political influences distinct from those of the other two generations. Distinct separation of the ages of each generation is important in cross-generational studies, because the time period experienced by each generation needs to be different (Jackson and Hatchett 1986).
Related factors
In determining which factors were correlated with dietary quality, each generation was analyzed separately, and the entire sample was analyzed together. Unless noted, the factors associated with dietary quality were significant when looking at all three generations at one time without separating them from one another.

Fig. 2. Percentage of Dietary Reference Intake (DRI) for selected nutrients, adjusted for caloric intake (n = 174). Mean percentage DRI of each nutrient was determined by dividing average intake by DRI value. Statistical difference between MAN (more adequately nourished) and LAN (less adequately nourished) determined by analysis of covariance, adjusted for caloric intake.
Out of the entire sample of women from all three generations, 132 women (76%) were LAN and 42 women (24%) were MAN (fig. 1). When each generation of women was analyzed separately, there was a consistent trend of more LAN than MAN women. When the three generations were compared to each other, the difference in the number of women in each generation who were MAN and LAN was not significant. One generation was no better nourished than another.
Mean caloric intake was positively related to dietary quality. The mean caloric intake of MAN women was 2,841 calories, and the mean caloric intake of LAN women was 1,574 calories (P < 0.001). Interestingly, weight status was not an indicator of dietary quality, as many normal weight and severely overweight women were less adequately nourished. Nutrient intakes were analyzed while adjusting for energy intakes in order to identify differences in nutrient density of the diet. With the exception of vitamins C and B12, the data showed significant differences in the nutrient intake between the MAN and LAN groups. The diets of MAN women had significantly greater nutrient density for protein (not shown), phosphorus (not shown), calcium, magnesium, iron, zinc, thiamin, riboflavin, niacin, folate, and vitamins A, E and B6 (fig. 2). The numbers of servings of the major food groups in the Food Guide Pyramid (USDA 1992) for the three generations showed statistically significant differences between the MAN and LAN groups in the number of servings of vegetables and dairy (P < 0.05), but not of fruits, grains or meat (fig. 3). The number of meals eaten each day was related to dietary quality (P < 0.01), with three or more per day reported by 57% of MAN women but only 31% of LAN women. Many other factors were not related to dietary quality in this study, either for all generations together or for each generation separately.
Generational comparison
The dietary quality scores of participants within each triad, defined as the total number of nutrients at or above two-thirds of DRI, were compared to determine if one generation influenced the quality of the dietary intake of another generation. The dietary quality scores of the grandmothers were positively related to those of the mothers (P < 0.05). However, this positive influence tended to disappear by the next generation. In fact, the dietary quality scores of the grandmothers were negatively related to those of the daughters (P < 0.01). The significance of a negative correlation was unclear, but this result confirmed that the dietary quality of the grandmothers did not positively influence that of the daughters. Additionally, there was no relationship between the dietary quality scores of the mothers and the daughters, even though they may have lived together. This was a surprising finding because it was previously assumed that female family members in the same household would have similar food intakes and similar dietary scores.
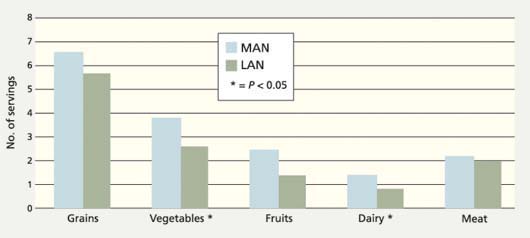
Fig. 3. Influence of number of daily servings from Food Guide Pyramid food groups on dietary quality, adjusted for energy intake (n = 174). Statistical difference determined by analysis of covariance, adjusted for caloric intake. MAN = more adequately nourished; LAN = less adequately nourished.
Milk and meat consumption
When all three generations were considered together, women who reported drinking milk on a regular basis had 24-hour recalls with significantly higher calcium intakes (672 milligrams per day) than those who did not (498 milligrams per day) (P < 0.01). When individual generations were analyzed for differences in calcium intake between women who regularly drank milk and those who did not, the only significant difference was found among the mothers. Mothers who reported drinking milk on a regular basis had an average daily calcium intake of 641 milligrams, compared to 462 milligrams for mothers who did not drink milk regularly (P < 0.05).
We compared the number of servings of each of the major food groups of the Food Guide Pyramid by generation. Daughters consumed significantly fewer servings from the meat group (1.5 servings) than mothers (2.2 servings) or grandmothers (2.5 servings) (P < 0.001). Generational differences in consumption of other food groups were not significant.
At-risk nutrients
Vitamin E was an at-risk nutrient for the greatest number of women when all three generations were considered together (table 2). Overall, the greatest numbers of all participants had less than two-thirds of the DRI for vitamin E (144 of 174; 83%), calcium (122 of 174; 70%), folate (120 of 174; 69%) and magnesium (91 of 174; 52%).
Comparison with other studies
Before the second half of the 20th century, food habits may have been passed down from one generation to the next, influencing dietary quality. This may still be the case in rural areas of less rapidly developing countries, where people's lifestyles and environment are not much different today compared to 50 years ago. However, dramatic changes in lifestyle and environment in the United States appear to have had a tremendous impact on eating patterns and food choices (Crockett and Sims 1995). Any influence that one generation might have on the food habits and food choices of subsequent generations appears to be nullified by an ever-changing food supply and an increasingly complex lifestyle.

TABLE 2. Ten at-risk nutrients most lacking in the diets of each generation; number of women who consumed less than two-thirds of the DRI for these nutrients
Therefore, it is not surprising that we did not find a positive relationship between the dietary scores of biologically related grandmothers and granddaughters. The weak relationship between the dietary scores of grandmothers and mothers may be indicative of the stronger influence of family relationships in the past. The null relationship between the diets of mothers and daughters is indicative of the reality of parents and children eating more meals apart and making more independent food choices. These findings are consistent with those mentioned earlier from other studies of dietary habits across generations (Stafleu et al. 1994; Vauthier et al. 1996; Lemke et al. 1998).
Several studies in the United States have followed cohorts of black women, as well as women of other ethnic groups. Researchers reported dietary variations among ethnic groups (Lovejoy et al. 2001; Huang et al. 2002; Forshee et al. 2003). However, most researchers did not distinguish between the more adequately nourished and less adequately nourished women within ethnic groups.
Because other studies have reported mean intakes on an entire group of black women, it is difficult to make many comparisons with our results. However, there are several nutrients in which comparisons are possible. Our finding that the protein intake of black women exceeded the DRI is consistent with the results of other studies (Lovejoy et al. 2001; Huang et al. 2002; Forshee et al. 2003). Our data showing adequate intakes of zinc, thiamin and vitamins A, C and B6 in the more adequately nourished women were consistent with the previous results. Similarly, the low intakes of vitamin E, folate and calcium found in this survey were consistent with those reported in these other surveys.
It is generally recognized that estimating intake of fat-soluble vitamin E is difficult, because both caloric and fat intakes are probably underreported, and the amounts and types of fats and oils used in food preparation are difficult to assess. Mean intakes of apparently healthy adults in the United States are likely to be above the RDA of 15 milligrams of $$alpha$$-tocopherol (the only form of vitamin E maintained in human blood plasma). Current dietary patterns appear to provide sufficient vitamin E to prevent deficiency symptoms (Monsen 2000).
There are some possible limitations to our study, as the data is based on self-reported 24-hour dietary recalls and questionnaires. Inaccurate estimation of dietary quality may result from atypical diets on the day of the recall or errors in self-reporting. Self-reported dietary recall data may be skewed from underreporting, which would lead to the underestimation of calories and nutrients. Self-reported estimates of other factors, including food habits and socioeconomic factors, may also be biased.
Improving food habits
In our study, no individual generation of black women was better nourished than another generation. The dietary quality of all three generations of black women could be improved substantially by mimicking the food choices of more adequately nourished black women. In this study, women from all three generations who were more adequately nourished ate three or more times a day, selected a variety of foods from the Food Guide Pyramid and did not restrict caloric intake to the point that it had a negative impact on nutrient intake. Women who reported drinking milk on a regular basis had higher intakes of calcium than those who did not.
Nutrition professionals should encourage black women to adopt the eating habits of these better-nourished women. When working with black women, nutrition professionals should also pay particular attention to encouraging foods that contain nutrients likely to be lacking in the diets of all three generations, including calcium, folate and magnesium. On the 24-hour food recalls, participants reported a number of foods that are rich in these nutrients, including nuts and seeds, dry beans, greens, broccoli, melon, fish, reduced-fat milk, cheese, oatmeal and cornbread. Since the better-nourished women in the study consumed these foods, they are likely to be acceptable to other black women.

In this study, the more adequately nourished women ate three or more meals a day, consumed a wide variety of foods and drank milk regularly.
Dietary quality is not linked across three generations of black women

