


All Issues
Central Coast consumers want more food-related information, from safety to ethics
Publication Information
California Agriculture 60(1):14-19. https://doi.org/10.3733/ca.v060n01p14
Published January 01, 2006
PDF | Citation | Permissions
NALT Keywords
Abstract
Information is lacking on what consumers want to know about food production, processing, transportation and retailing. Focus groups and a random-sample mail survey of consumers in the Central Coast region indicate that food safety and nutrition generate the most interest. However, ethical concerns such as the humane treatment of animals, the environmental impacts of food production and social justice for farmworkers also have strong support. The results suggest that voluntary food labels on these issues may be a promising way to meet consumer needs for more information.
Full text
Consumers are increasingly able to influence the way food is produced, processed, transported and sold through their purchasing decisions (Kinsey 1999). It is therefore surprising that few studies have attempted to find out what these potentially powerful consumers want to know about the food system, in order to anticipate these changes. Most consumer research related to food and agriculture is conducted by organizations with specific interests, such as the promotion of a particular commodity or type of production. Researchers typically decide what people ought to know, and then proceed to measure their knowledge (or lack of knowledge) to identify where education and marketing efforts should be targeted (James 2004). Such an approach may risk missing what the public actually wants to know — information that could help growers, processors and retailers plan for consumer-driven changes.
We asked consumers themselves what aspects of food production, processing, transportation and retailing they were most interested in knowing more about. Our research involved two methods: a series of five focus groups, and a random-sample mail survey of 1,000 households. A focus group is a structured roundtable discussion with a small number of people, usually 6 to 10, to elicit in-depth information (Morgan 1998). The focus group results informed many of the survey questions, and helped reveal the meaning behind the survey responses. The survey, on the other hand, quantified the level of interest in specific food-system topics. Both components were conducted in the Central Coast region of California, which we defined as San Mateo, Santa Clara, Santa Cruz, San Benito and Monterey counties. This comprises the study area for a U.S. Department of Agriculture (USDA)-funded project exploring ways to improve the sustainability of the food and agricultural system in the region; this project supported our research.
In a survey of Central Coast consumers, nearly 60% reported that they find it difficult to learn about how their food is produced.
Measuring consumer interests
Focus groups
Focus group participants were recruited in person from two large supermarket chains in Seaside and Salinas, a discount grocery store in San Jose, a farmers' market in Aptos and a natural foods store in Monterey. These sites were chosen in order to ensure that a diverse group of consumers from the Central Coast region participated. To be eligible for the study, participants had to be the primary food purchaser for their household and at least 18 years old. A total of 27 people participated in these discussions in April and May 2003. Because focus group research is conducted to obtain qualitative information that cannot be obtained through survey research, a fully representative population was not expected. Seventy percent of the participants were female, largely due to the fact that women were encountered more often at the recruitment sites. Indeed, research suggests that women make 69% of food purchases in the United States (FMI 2003). Thirty percent of participants classified themselves in ethnic groups other than non-Hispanic white.
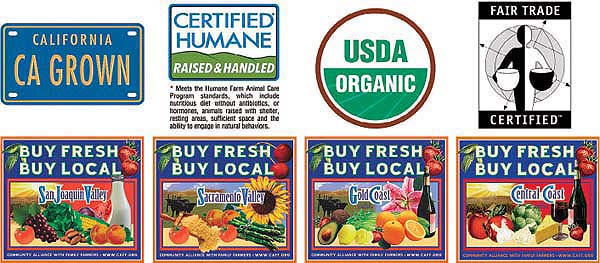
“Eco-labels” have grown in popularity as a way to provide consumers with information on how food was produced. Top, left to right, the “California Grown” campaign identifies crops and other goods produced in-state; the Humane Society of the United States partially funds a humane-farming certification; the USDA's organic seal is the most prominent eco-label in the United States; the “Fair Trade” label certifies that growers receive a fair price for crops and workers are paid a fair wage. Bottom, the Community Alliance with Family Farmers' “Buy Fresh, Buy Local” campaign highlights agricultural products from four different California growing regions.
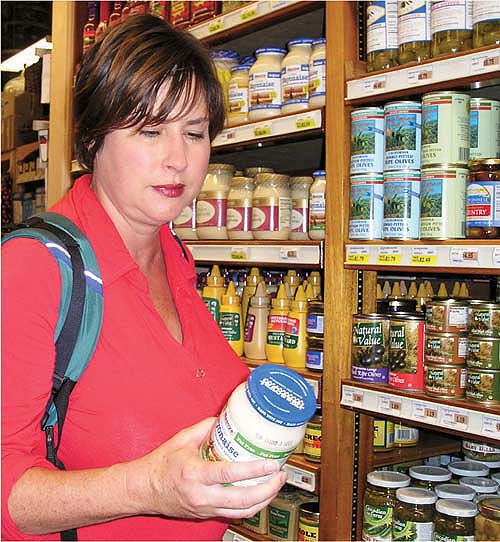
Surveyed consumers wanted information about their food to be available at the point of purchase. Product labels, brochures and retail displays, above, were the most-preferred options.
The focus group questions included, “If you could find out anything about your food, or any of the steps involved in getting food to your plate, what would you like to know?” and “How would you prefer to get this information?” Many of the participants expressed surprise that their input was being gathered, and were thankful for the opportunity to provide their opinions.
Survey
Themes identified in the focus groups informed the design of the survey. Transcripts of the focus groups were analyzed, using the software NVivo 2.0, and statements were classified into categories. Categories that were discussed in all five focus groups were included in several sections of the survey. These sections included: a list of topics defined as food-system interests (such as nutrition, environmental impacts and working conditions); a list of information sources from which respondents could choose to learn more about these interests (such as radio, the Internet and product labels); and a list of five potential standards that could be represented by voluntary food labels (such as local, small scale and humane). The survey was pretested in person with 20 consumers recruited at an independent grocery store in Santa Cruz to improve its clarity and reliability.

TABLE 1 Demographic characteristics of mail survey respondents compared to 2000 U.S. Census figures in five-county Central Coast region
In April 2004 the survey was sent to 1,000 households in the study area, using randomly sampled names and addresses provided by the marketing firm USADATA. A modified Tailored Design Method was employed, which involved four mailings: (1) a pre-notice letter, (2) the survey with a $1 bill incentive and stamped return envelope, (3) a follow-up postcard and (4) a replacement survey and return envelope (Dillman 2000). While this method typically also employs a second replacement survey mailing, this step was omitted due to budget constraints. The final response rate was 48.3%. The survey instructions indicated that the primary food purchaser for the household was to complete the questionnaire. Respondents' demographic characteristics were generally similar to those identified in the 2000 U.S. Census, except that the number of Hispanic respondents was lower, the number of respondents age 65 and over was higher, and reported education levels were higher than would be proportionate for the region (table 1).

Food-system concerns identified
Only 15.8% of survey respondents felt they already knew enough about their food, while most (59.8%) felt they did not know enough (table 2). In addition, a majority of respondents (59%) agreed that it is difficult to find this information. These results point to a need for growers, processors and retailers to provide consumers with more details about their products.
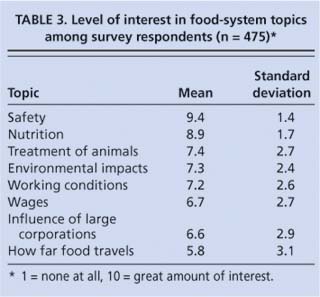
Eight topics were presented to survey respondents: safety, nutrition, the treatment of animals, environmental impacts, working conditions, wages, the influence of large corporations and how far food travels. Respondents ranked them on a scale from 1 to 10, with 1 indicating no interest and 10 indicating a great amount of interest (table 3). Not surprisingly, the scores indicated that survey respondents were most interested in food safety and nutrition: nearly all respondents ranked these topics near the top of the scale. A number of previous surveys have consistently shown food safety and nutrition to be important concerns, even for people with few other food-related interests (Steptoe et al. 1995; McBride 1997).
A review of the focus group results provided a more in-depth understanding of the survey results. For example, one focus group participant stated, “Who knows what the heck is in half the stuff we buy, I mean I don't … Frankly, I don't care as long as it doesn't get me sick.” This was a minority view, however, as most focus group participants also had a number of concerns beyond their personal health. The survey results supported this broader concern. The treatment of animals involved in food production, environmental impacts and working conditions all received mean scores of greater than 7 on a scale of 10 (table 3).
In the focus groups, the treatment of animals elicited the most emotion. Several participants had toured slaughterhouses and said this experience had a lasting effect on the way they felt about their food. Others had changed their consumption habits after learning how some animals are treated, such as veal calves. In addition, for some people the interest in animal welfare overlapped with personal health concerns. For example, a focus group participant discussing the inhumane aspects of confinement animal production asked, “Then are you eating growth hormone … or whatever you're putting in them, and what does that do? In the long run, what's that doing to you?”
On the issue of environmental impacts, focus group participants most frequently expressed concerns related to pesticides and genetic engineering. Some participants were also concerned about irradiation and the impacts of food packaging or food waste. Several participants noted that environmental impacts were much more important to them than other concerns about the food system.
For the topics of working conditions and wages, focus group participants were interested in the treatment of farmworkers, such as backbreaking labor performed for very low pay, and the exploitation of migrant workers. Workers involved in other aspects of the food system, such as processing or retail, were not discussed as frequently. When asked specifically to list criteria they would like to see improved for workers involved in the food system, participants mentioned higher wages, protection from exposure to pesticides, health care, education, adequate food, limited working hours and adequate housing.

In focus groups, the treatment of food animals elicited the most emotion.
The influence of large corporations was the next-highest ranked topic, receiving a mean score of 6.6 out of 10 on the survey. This theme emerged in all of the focus groups, though it was much more strongly held by some individuals. One participant said, “The huge conglomerates that are controlling agriculture really, really bother me,” and others named specific multinational food processors and chemical companies whose motives they distrusted. Some participants blamed these corporations for the low prices that farmers receive for their products and the loss of family farms.
In the survey, how far food travels was the lowest ranked topic, with a mean score of 5.8. Participants had varying reasons for their interest in this topic, involving economic, food safety or environmental concerns. Most wanted to know the country of origin of their food. One participant said, “I guess I'd like to know (where fruits and vegetables are from) because I'd like to know are we producing our food or are we actually reaching out into other countries?” Some participants wanted to support the U.S. economy, while others went further and expressed interest in supporting their local economies. Another stated reason for wanting to know where food came from was concern about the safety of imported food, such as the potential presence of pesticides banned in the United States or contamination with microbes that could cause human diseases. Finally, some participants wanted to know how much fossil fuel was consumed in transporting their food.

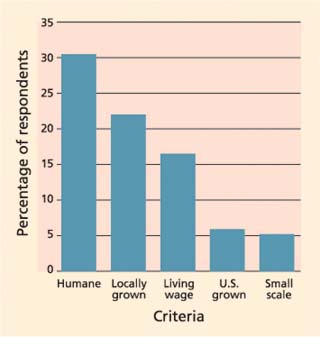
When survey respondents were asked in paired comparisons to choose which aspect of food production that they would like to see represented by third-party-certified eco-labels, 22% picked “locally grown” while 16.5% chose a “living wage” for farmworkers, left, as their top-ranked choices. Right, a grain ship transports the commodity overseas.
Of 60 survey respondents who identified additional food-system topics in a write-in section, 22% had reservations about genetically engineered food, and 15% wanted more information on pesticides. Other interests identified by more than one respondent were freshness, where food was grown and the fate of food waste.

Preferred information sources
To find out how people would prefer to obtain more information about their food, the survey presented categories suggested by focus group participants (table 4), along with instructions to choose up to four of the categories. Product labels were the most popular choice for obtaining more information about food, selected by 81.3% of survey respondents. A brochure or retail display was a close second at 76.4%. These results suggest that most consumers want information about food when they are actually making the decisions about purchases. Print media and Web-based information were selected by approximately half of respondents. A number of focus group participants also expressed an interest in labels, but also wanted more-detailed information via a Web site.
A smaller proportion of consumers surveyed (18.7%), indicated that they were interested in taking tours to see how food is produced. One focus group participant mentioned watching television shows that take viewers behind the scenes of food production, such as “Unwrapped” and “Good Eats,” which are on the cable channel “Food Network.” These are two of the highest-rated shows on this rapidly growing channel. Similar video productions might be an ideal way to reach the 26.3% of survey respondents who chose television, videotape or DVD as the way they would prefer to get more information about their food. Talking to the seller was the least preferred option, selected by only 11.8% of survey respondents.
Organic and other eco-labels
A recent trend in food marketing is an increase in “eco-labels” — seals or logos signifying that the product meets certain standards, such as environmental protection or social responsibility. Currently the most prominent ecolabel is organic, which in 2002 became a national standard accredited by the USDA. While organic food sales comprise less than 2% of all food sold in the United States, they have increased by at least 20% per year for the last 15 years, a trend that the industry expects to continue in the near future (Rawson 1998; OTA 2003).
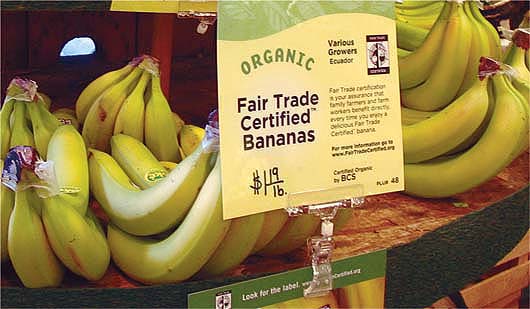
Another eco-label that is rapidly growing is “Fair Trade,” which applies only to select, imported products that are certified in the United States by a nonprofit organization, TransFair USA. The fair trade standards ensure that grower cooperatives receive a minimum price, or that workers are paid a fair wage. Although its market share is much smaller than organic, sales of fair trade products such as coffee and tea increased by more than 40% in the United States from 2001 to 2002 (FTF 2003), and have recently expanded to include fruits, such as bananas.
Participants in the focus groups were all familiar with the organic label, but most were unfamiliar with fair trade labels. Almost everyone, even those who could define fair trade and reported purchasing fair trade products, easily confused the term with “free trade.” Free trade generally refers to treaties such as the North American Free Trade Agreement (NAFTA), which eliminates certain tariffs for imported goods but does not provide a minimum price or wage.
Focus group participants wanted information on a label to be in “plain English” and easily understood. They also emphasized that any label had to “mean what it says.” They were skeptical of claims made about their food, particularly those that were not well defined, such as “natural.” A third-party certification system, such as TransFair USA's audits to verify that fair trade standards are met by suppliers and retailers, is one way to ensure consumer confidence in claims. However, most focus group participants were not familiar with the certification process. Education about how third-party certification works may be necessary to overcome current levels of consumer distrust in food marketers.
We asked survey respondents to evaluate five potential standards that could be represented by third-party-certified eco-labels. As with the food-system topics and preferred sources of information, these standards were based on the themes that emerged from the focus groups. However, we did not include criteria related to safety or nutrition because making claims in these areas can be contentious given the current state of scientific knowledge (Katan and de Roos 2003), and such claims are currently regulated by the U.S. Food and Drug Administration. We also excluded environmental criteria, because most of the issues raised by focus group participants related to this topic, such as pesticides and genetic engineering, are already prohibited under the USDA organic label.
As a result, the following eco-label standards were evaluated.
-
Humane: meat, dairy products or eggs from animals that have not been treated cruelly.
-
Living wage: provides above-poverty wages to workers involved in producing the food.
-
Locally grown: grown within 50 miles of the point of purchase.
-
Small scale: supports small farms or businesses.
-
U.S. grown: grown in the United States.
Because most focus group participants were concerned about both workers' wages and working conditions, for simplicity we chose just one of these topics. We selected a living wage because it was discussed most frequently in the focus groups. On the other hand, we included two criteria for the distance food travels because some members of the focus groups wanted to support local food production, while others were more interested purchasing food that was not imported from other countries.
We asked respondents to imagine a product that was identical except for two of the standards, and to choose the one that they preferred (for example, locally grown or humane). All possible combinations were presented in a series of pairs. We learned from pretesting the survey that these decisions were difficult for most people. Many respondents said they would prefer food that represented all of these standards. However, almost 92% of the respondents completed this section. The result was a ranking of all five standards for each respondent.
Humane was most often the top-ranked choice; it was chosen in every comparison by over 30% of respondents (fig. 1). Despite this level of interest, there are currently few options for consumers who want to support these preferences. For example, there are only three humane labels in the United States, and they apply to a small number of farms: the Animal Welfare Institute's Humane Husbandry criteria for pigs, rabbits, sheep and ducks, used by just over 300 operations; “Free Farmed,” administered by the American Humane Association for nine operations; and “Certified Humane,” partially funded by The Humane Society of the United States, which currently certifies 34 operations.
Although interest in how far food travels was not as highly rated as other topics (table 2), locally grown was the second most preferred of the five potential eco-labels. Twenty-two percent of respondents ranked locally grown as their first choice. This may be due to the fact that people prefer local products for other attributes, such as taste and freshness (Lockeretz 1986). The nonprofit organization Food Routes is partnered with organizations across the United States for “Buy Local” pilot initiatives, some of which include local labels to help consumers identify these products. In California, the local partner Community Alliance with Family Farmers has a “Buy Fresh, Buy Local” campaign. A similar, statewide effort is being funded by California and the United States, along with 27 agricultural associations, for the “California Grown” label ( see page 15 ).
Next came living wage, which was the first choice of 16.5% of respondents. Currently, consumers interested in a living wage label can seek out the “Black Eagle” label. This label identifies produce from farms that have contracts with the United Farm Workers union, which indicates “decent wages, benefits and working conditions” (UFW 2005). However, only 33 food-producing operations in the United States carry this label.
Willingness to pay extra
An additional survey question asked respondents about their willingness to pay more for strawberries that guaranteed a living wage and safe working conditions for farmworkers. After being told the regular price was $1.50 a pint, they were asked if they would pay 5 cents, 25 cents, 50 cents or $1.50 more for these standards, depending upon the version of the survey (there were four versions of the survey, differing only on this one question). The median price that people were willing to pay was $1.06, or a 71% increase over the regular price. Eighty-four percent of respondents were willing to pay 5 cents more (a 3% increase), while 67% would pay 25 cents more (a 17% increase), 56% would pay an extra 50 cents (a 33% increase), and 42% would pay $1.50 more (a 100% increase). These results should be interpreted with caution, as surveys tend to overestimate actual willingness to pay (Donaldson et al. 1997). However, these results do indicate potential consumer interest in a domestic version of “fair trade” certified foods, particularly if the price premium is small.
The U.S. grown and small-scale labels received much less support; they were the first choice of fewer than 6% of respondents. This does not mean that respondents see these criteria as unimportant, only that they rank lower than the other criteria when people are forced to choose. U.S. grown, in particular, fared poorly in comparison with another geographic criteria, locally grown. However, a recent survey reported that 93% of U.S. consumers favored country-of-origin labeling for Canadian beef (Supermarket Guru 2003). Interestingly, the focus group participants had more trust in operations that were local, even if they were very large, which may partially explain why support for small scale ranked last among survey respondents.
Consumers want more information
The survey results suggest that growers, processors and retailers could improve the amount of information available about how food is produced, processed, transported and sold. They should recognize food safety and nutrition as consumers' top concerns, but also devote attention to ethical issues, particularly the humane treatment of animals, environmental impacts and social justice issues. Because labels are the preferred source of information, eco-labels may be an appropriate way to address these matters.
A majority of respondents indicated a willingness to pay substantially more than the prevailing price for standards that embodied a living wage and safe working conditions. The rapid growth of organic food sales, as well as fair trade products from other countries, suggests that promoting the ethical values represented in food will continue to be a promising marketing strategy. Future research could explore the success of pilot projects described here in meeting consumer demands, as well as their potential to improve the economic viability of producers.
Consumers who are interested in ethical aspects of the food system should recognize that their purchasing decisions can influence the way their food is grown, processed and distributed. They should also recognize that this strategy of change works best for choices that are currently available, such as organic, and is far less effective for creating new alternatives. Consumers will have to express their concerns to growers, processors, retailers and policymakers if the current food system is not meeting their needs; to be taken seriously, this may require amplifying their voices by working with advocacy organizations, rather than relying solely on individual efforts.
Central Coast consumers want more food-related information, from safety to ethics

