


All Issues
Transparency tube provides reliable water-quality measurements
Publication Information
California Agriculture 58(3):149-153. https://doi.org/10.3733/ca.v058n03p149
Published July 01, 2004
PDF | Citation | Permissions
Abstract
We examined the efficacy of using transparency-tube measurements to estimate turbidity, total suspended solids (TSS) and particulate nitrogen and phosphorus concentrations in several California waterways. Just as lowering a black-and-white disk (Secchi disk) into a lake provides a convenient way to measure its water clarity, a transparency tube offers a practical alternative for measuring water clarity and suspended solids concentrations in California streams and waterways. While transparency relationships with turbidity and TSS are strongest within a given sampling location, these relationships are relatively robust across a wide range of water bodies displaying contrasting conditions. However, transparency-tube measurements appear to have limited value in predicting particulate nutrient concentrations, even at a given sampling site. The low cost, ease of use and excellent repeatability of measurement make the transparency tube a potentially valuable tool for anyone interested in monitoring water quality, including farmers, ranchers, citizen volunteer groups, schools and local governments seeking to get involved in watershed monitoring programs.
Full text
Suspended solids are a common source of water impairment in streams. The Clean Water Act section 303(d) list for total maximum daily load (TMDL) development in California identified 152 water bodies and river segments as impaired by sedimentrelated problems in 2002 (SWRCB 2003). These water bodies include 165,000 acres of bays and harbors, 4,513 acres of estuaries, 94,253 acres of lakes and reservoirs and 16,953 miles of rivers and streams. Although suspended solids occur naturally in stream waters, human activities can greatly increase their concentrations. Several types of materials contribute to suspended solids, including soil particles, aquatic organisms (such as phytoplankton and zooplankton) and small fragments of dead plants. Sources of suspended solids in streams include waste discharge, urban runoff, eroding stream banks, excessive algal growth and soil erosion from construction, forestry or agricultural sites. Suspended sediments have numerous effects on water quality that impact the health and integrity of aquatic ecosystems (Cordone and Kelly 1961; Kirk 1994; Lloyd et al. 1987).
Monitoring of suspended solids has become an essential part of programs to reduce nonpoint source pollution, such as those imposed by the Clean Water Act through the TMDL process. Non-point source pollution originates from diffuse and hard-to-identify sources, such as runoff from urban areas, agriculture and forestry. Regular monitoring of suspended solids, like checking your blood pressure on a regular basis, provides a measure of the general health of a water body. This data can be used to identify water bodies impaired by suspended solids, prioritize areas for additional monitoring and research, detect trends of increasing or decreasing erosion in a watershed, and document the effectiveness of stream-restoration projects.
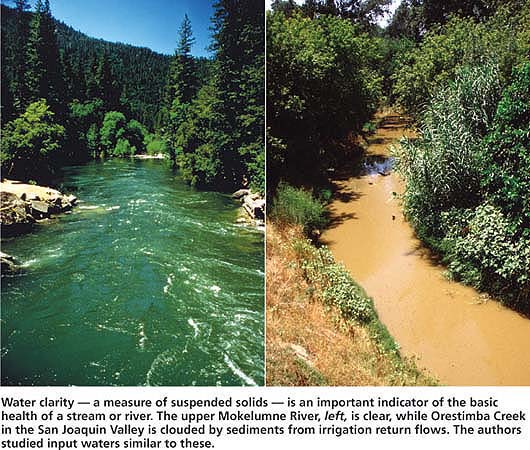
Water clarity — a measure of suspended solids — is an important indicator of the basic health of a stream or river. The upper Mokelumne River, left, is clear, while Orestimba Creek in the San Joaquin Valley is clouded by sediments from irrigation return flows. The authors studied input waters similar to these.
Three commonly used methods to evaluate stream-water suspended solids concentrations are total suspended solids (TSS), turbidity and transparency (Secchi disk and transparency tubes). TSS measurements (milligrams per liter [mg/L]) involve quantifying the mass (mg) of solids retained on a 0.45 micron (μm) filter following filtration of a known quantity (L) of stream water. This laboratory method is time-consuming and requires a high-precision analytical balance. Turbidity is a measure of light-scattering by suspended particles and provides a measure of cloudiness (or alternatively, clarity). Turbidity is measured with a nephelometer (turbidimeter, $900 to $2000) in units called nephelometric turbidity units, or NTUs. The method can be performed in the field and is highly accurate and rapid (about 1 minute). A general rule of thumb is that 1 mg TSS/L is approximately equal to 1 to 2 NTUs of turbidity.
The transparency tube (turbidity tube) is a clear plastic tube marked with a centimeter scale and a white-black pattern (Secchi pattern) painted on the bottom. Typical tubes range in length from 24 to 48 inches (60 to 120 centimeters), with an inside diameter of 1.8 inches (4.5 centimeters) and outside diameter of 2 inches (5.0 centimeters), and a water release valve at the bottom to drain the tube. Stream water is poured into the tube until the white-black pattern disappears. Water is then released from the bottom valve until the pattern becomes visible. The depth (centimeters) of water is read from the scale attached to the tube. It is important to shade the tube with your body by facing away from the sun and to perform the measurement without sunglasses.
Transparency tubes have an advantage in stream waters that are too shallow or too swift for the traditional Secchi disk measurements. Water samples can be collected safely using a bucket and rope thrown from a bridge or near shore. Similar to other water-clarity measurements, transparency measurements can be rendered inaccurate in some cases by highly colored waters (due to dissolved organic matter). Transparency readings using tubes from different sources may give slightly different readings, so care must be taken in comparing data from different sources. Transparency tubes can be purchased from scientific supply houses ($35 to $60) or they can be homemade at low cost.
This research tested the hypothesis that transparency-tube measurements may be used as a simple and inexpensive indicator of water-quality parameters related to suspended solids, such as turbidity, TSS concentration, and total particulate nitrogen and phosphorus concentrations. Water samples from three separate studies (15 Central Valley rivers, Stockton Ship Channel and Bay-Delta waterways) were utilized.
Importance of suspended solids
Suspended solids affect physical (such as temperature), chemical (such as nutrients) and biological (such as habitat and photosynthesis) properties of aquatic ecosystems (Cordone and Kelly 1961; Kirk 1994; Lloyd et al. 1987). The most obvious negative impact of suspended solids is their impairment of recreational use and aesthetic enjoyment of water bodies. For most people, clear water means clean water. In addition to making water cloudy, suspended solids serve as carriers of nutrients (such as phosphorus and nitrogen), trace metals (such as mercury, lead, cadmium, copper and zinc), toxins (such as pesticides, dioxins and PCBs [polychlorinated biphenyls]) and disease-causing microorganisms (such as E. coli and giardia). The particles may provide a mechanism for the accumulation of toxicants into the food web via ingestion. High turbidity increases the cost of purifying drinking water because particulate material must be virtually eliminated for effective disinfection. The accumulation of sediments in navigable waterways requires expensive dredging to maintain adequate channel depths.

Typical transparency tube used to make water-clarity measurements. Water is released from the outlet valve until the black-white target at the bottom of the tube becomes visible.

UC Davis graduate student John Maynard (left) and UC Cooperative Extension specialist Toby O'Geen examine the effects of wetland treatment for water-quality improvement of irrigation tailwaters in western Stanislaus County. As shown by the transparency tube, suspended solids are effectively removed by treatment in flow-through wetlands. The transparency tube provided accurate measurements of water transparency, and is a low-cost tool that is easy to use in the field.
Excessive concentrations of suspended solids have several effects on aquatic organisms. Fish gills can be clogged, which hinders gas exchange, destroys protective mucous coverings on eyes and scales, and makes fish more susceptible to infection and disease. Filter-feeding systems can be fouled, hindering the ability of aquatic predators to pursue their prey. Suspended solids may settle to the stream bottom, where they bury and suffocate fish eggs and newly hatched larvae. Fine suspended solids may cover coarser sediments and spaces between rocks and cobbles, which provide habitat for aquatic life (such as spawning gravels), especially benthic organisms (those living in or on bottom substrates in aquatic ecosystems). As a result, aquatic diversity may be greatly altered from natural conditions. To protect fish production and other beneficial uses, California's Regional Water Quality Control Plans limit controllable increases in turbidity to levels that vary with natural background turbidity. For example, in very clear water bodies (0 to 5 NTUs), turbidity increases must not exceed 1 NTU, whereas in highly turbid systems (> 100 NTUs), increases of up to 10% are allowed.
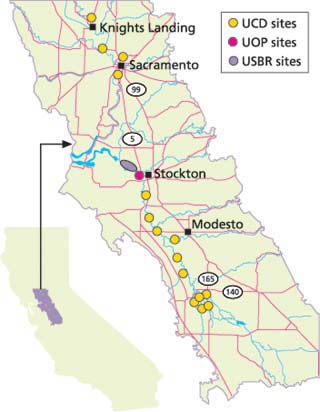
Fig. 1. Transparency-tube sampling sites. UCD includes 248 samples from 15 Central Valley rivers in the San Joaquin and Sacramento river watersheds; UOP includes 194 samples from the Stockton Ship Channel; and USBR includes 26 samples from Bay-Delta waterways.
High levels of suspended solids can also contribute to low dissolved-oxygen levels in rivers and estuaries by virtue of their effects on the production of single-celled plants called algae. In the San Joaquin River, for example, nutrients attached to suspended solids — carried by agricultural and wetland drainage — fuel extremely high levels of algae production. Bacteria decompose dead algae along with other forms of organic matter carried by the river (such as dissolved organic matter, fragmented plant materials and animal wastes) and treated sewage from cities and towns, resulting in the consumption of oxygen. Turbidity may also affect the biological oxygen demand in the San Joaquin River system indirectly through its influence on the type of algae that can grow. In low-turbidity streams, light can penetrate to the streambed, making it possible for benthic algae to predominate. Benthic algae grow in place, rather than suspended in the water, so they are not transported during the summer-fall low-flow period of high water temperature, but instead during the winter high-flow period. By contrast, in turbid systems like the San Joaquin River, a much greater percentage of the streambed material is too dark to support benthic algal production, so algae grow mostly in suspension. Suspended algae (phytoplankton) flowing with the current is transported to the lower San Joaquin River during the summer and fall months. When the phytoplankton reach the much deeper water of the Stockton Ship Channel, many die and are decomposed by bacteria, contributing to low dissolved-oxygen levels. Under these circumstances, dissolved oxygen can drop to levels low enough to delay the migration of salmon to their spawning grounds upstream.

California waterways are subject to federal total maximum daily load (TMDL) requirements for pollutants such as nutrients, pesticides and suspended solids. Wetland treatment, shown above, can improve the water quality of irrigation tailwaters before they enter the San Joaquin River. These wetlands also provide valuable wildlife habitat, groundwater recharge and temporary water storage to lessen flooding.
Water samples compared
Water samples were collected from 15 Central Valley rivers (UCD: 248 samples from 10 sites in San Joaquin watershed and five sites in the Sacramento watershed); the Stockton Ship Channel (UOP: 194 samples); and Bay-Delta waterways (USBR: 26 samples) by three independent research teams (fig. 1). All samples were analyzed for transparency (1.8 inches [4.5-centimeter] inside diameter tube), turbidity and TSS, except that TSS was not determined for the Bay-Delta waterway samples. Only samples with transparency values less than 48 inches (120 centimeters) were utilized in this comparison study. In addition, Secchi disk measurements (12-inch [30-centimeter] diameter) were made at the Stockton Ship Channel and Bay-Delta waterway sites, and particulate nitrogen and phosphorus concentrations were determined for the Central Valley river samples. Particulate nutrient concentrations were calculated as the difference between total (unfiltered) and dissolved (that passed through a 0.45-micron filter) nitrogen and phosphorus. Following persulfate-digestion, nitrogen was measured conductimetrically and phosphorus was measured with the ammonium molybdate colorimetric method. All statistical analyses were performed using SYSTAT for Windows, Version 9 (SYSTAT, Evanston, III.).
Transparency and other parameters
Method efficacy.
First, we examined the relationship of transparency to turbidity and TSS at one site to demonstrate the efficacy of the methodology across a range of hydrologic conditions. Over the course of a water year (October to September, to coincide with the rainy season), the measures of stream clarity in the San Joaquin River at Vernalis varied by a factor of two to three times (fig. 2). Maximum turbidity values tend to occur during winter storm events (January) and during summer low flows when irrigation return flows contribute an appreciable sediment load to the San Joaquin River. There is a strong linear relationship between turbidity and TSS (r2 = 0.88), with an average value of 1.7 mg TSS per NTU. Transparency was inversely related to turbidity (r2 = 0.92) and TSS (r2 = 0.78), showing an exponential decay relationship that can be transformed to a linear relationship using a log-log transformation (data not shown). The stronger relationship between transparency and turbidity compared to TSS is expected because both transparency and turbidity are visual measures and are a function of light-scattering. Their relationship with TSS depends on the particle-size distribution and on the shape, color and composition of the particulate matter.
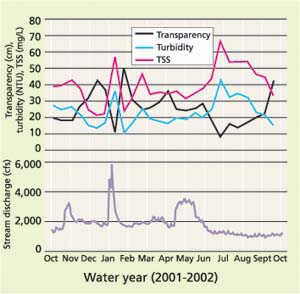
Fig. 2. Comparison of transparency, turbidity and total suspended solids (TSS) measurements over the course of a water year for the San Joaquin River at Vernalis. Transparency is inversely related to turbidity and TSS.
Measurement precision.
The precision of measurements was examined under laboratory conditions through repeated measurements (n = 5) by the same individual, as well as repeated measures by different individuals (n = 4). The coefficient of variation (standard deviation/mean) was similar between the individual's repeated measures (3% to 4%) and the variability between individuals (4% to 5%). We found that variability among first-time users of transparency tubes under field conditions can be substantially higher. Measurements under full sunlight tend to show greater transparency compared to cloudy or low-light conditions. The presence of coarse particles (such as sand grains) may also affect readings by preferentially settling to the bottom of the tube where they cover the black-white pattern. Transparency tubes from different manufacturers may also give slightly different readings due to differences in design. Care must be taken in comparing data from different sources. Due to the number of factors that may influence transparency readings, we chose to analyze the three data sets independently rather than combining them for analysis.
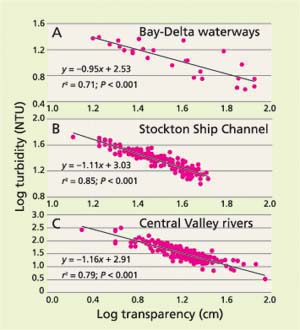
Fig. 3. Relationship between log-transformed values of turbidity and transparency for multiple sites in (A) Bay-Delta waterways, (B) Stockton Ship Channel and (C) Central Valley rivers. The tighter the clustering, the stronger the negative relationship is, showing lower transparency as turbidity increases.
Varying conditions.
Next, having demonstrated that transparency-tube measurements can be made precisely and that they show a strong relationship to turbidity and TSS at a single research site, we expanded the analysis to test the robustness of these relationships across a wider range of conditions. Transparency-turbidity relationships showed a strong correlation (r2 = 0.71 to 0.85) with similar slopes (-1.16 to -0.95) and intercepts (2.53 to 3.03) across a wide range of water samples (fig. 3). This strong relationship is even more remarkable when considering that the Central Valley river samples represent 15 different streams having a wide range in the composition of suspended solids.
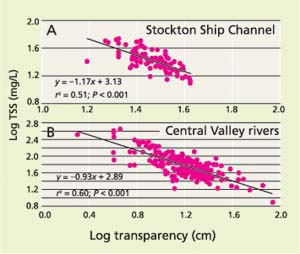
Fig. 4. Relationship between log-transformed values of total suspended solids (TSS) and transparency for the (A) Stockton Ship Channel and (B) Central Valley rivers. The tighter the clustering, the stronger the negative relationship is, showing lower transparency as TSS increases.
The relationship between TSS and transparency is not as strong as for transparency-turbidity; however, the relationship does provide substantial predictive ability (r2 = 0.51 to 0.60) (fig. 4). Again, the slopes and intercepts between these two data sets are remarkably similar in spite of large differences within and between sampling sites. In contrast, the relationship between TSS and turbidity (r2 = 0.83 to 0.84) (data not shown) is appreciably stronger than TSS versus transparency. We conclude that transparency is a robust measure of both turbidity and TSS; however, it is a stronger predictor of turbidity than TSS across our sampling sites.
Comparison to Secchi disk.
Because Secchi disk measurements have a long tradition in hydrology and aquatic biology, the relationship between Secchi disk and transparency-tube measurements of water clarity was compared for sites in the Stockton Ship Channel and Bay-Delta waterways (Davies-Colley and Smith 2001; Preisendorfer 1986). There was a strong linear relationship (r2 = 0.71) between the two measures of water clarity, with Secchi disk transparency values consistently higher (fig. 5). The relationship has a slope near unity (1.09) with an intercept of 15.6. The offset indicated by the intercept suggests that there is a fixed systematic difference between the two methods resulting from factors such as different properties of the disk (such as diameter and pattern) and surrounding light field (such as light attenuation from transparency-tube walls). This evaluation clearly demonstrates that while Secchi disk and transparency-tube measurements are strongly related, they are not directly comparable.

Fig. 5. Relationship between Secchi disk and transparency-tube measurements of water-column transparency for the Stockton Ship Channel and Bay-Delta waterways. Although both techniques involve visual detection of a black-and-white disk, the methods are not directly comparable.
Nutrient concentrations.
Finally, an additional interest was to determine whether transparency-tube measurements could be used to estimate nitrogen and phosphorus concentrations contained in the particulate (> 0.45 micron) fraction. Relationships between transparency and total particulate nitrogen (P = 0.61) and phosphorus (P = 0.07) were not significant (P > 0.05) when combining data from all 15 sites (fig. 6). When examining data by site, several significant relationships were found; however, r2 values typically ranged from 0.1 to 0.5 (data not shown). Even the relationship between particulate-matter nitrogen and phosphorus and TSS was not significant, indicating that there are between-site and temporal variations in the nitrogen and phosphorus contents of the particulate fraction (fig. 6). As such, transparency measurements had limited value in predicting nutrient concentrations of particulate matter in our study. Stronger relationships between particulate nutrient concentrations and Secchi disk measurements have been noted in waters where algae biomass is the primary source of both particulate nutrients and light attenuation in the water column (Carlson 1977; Rast and Lee 1978).

Fig. 6. Relationship between log-transformed concentrations of particulate (> 0.45 micron) nitrogen and phosphorus and transparency measurements at multiple sites in Central Valley rivers. The lack of a relationship indicates that transparency measurements cannot be reliably used to predict particulate nutrient concentrations across multiple sites.
Putting transparency tubes to work
This study demonstrates that transparency-tube measurements provide a reliable method for estimating turbidity and TSS in a wide range of California water bodies. While transparency relationships with turbidity and TSS are strongest within a given sampling location, these relationships are relatively robust across a wide range of water bodies displaying contrasting conditions. Transparency-tube measurements appear to have limited value in predicting particulate nutrient concentrations, even at a given sampling site.
The low cost, ease of use, excellent repeatability and rapidity of measurement make the transparency-tube method readily available to farmers, ranchers, schools, citizen monitoring groups and local government agencies. Transparency tubes may be applied to a wide variety of monitoring activities, such as determining the spatial patterns of pollution sources within a given watershed, tracking long-term changes in water quality, examining temporal patterns in water quality (such as seasonal and storm events) and evaluating watershed-restoration activities (such as above and below a wetland, streambank restoration or construction site). For any of these monitoring activities, we recommend calibrating transparency measurements with other water-quality parameters to document the strength of these predictive relationships. Widespread use of such monitoring tools provides an excellent opportunity for citizens to play an active role in enhancing water quality in California.
Transparency tube provides reliable water-quality measurements

