


All Issues
California's wine industry enters new era
Publication Information
California Agriculture 57(3):71-75. https://doi.org/10.3733/ca.v057n03p71
Published July 01, 2003
PDF | Citation | Permissions
Abstract
The wine industry in California and the world is entering a new era, marked by consolidation and globalization. People are drinking less but better wine. Will producers of lower-priced grapes raise quality to attract more upscale wine drinkers, putting downward pressure on all grape and wine prices, or will the wine-grape industry fragment into distinct quality and price segments? In 2001 and 2002, an increased grape supply and the recession led to declining prices for wine grapes in all areas of California except the North Coast. Predictions of a severe wine-grape glut obscure the possibility that a fragmented wine industry is developing in which some segments prosper while others languish.
Full text

Since the 1970s, when lower-quality jug wine dominated the market, U.S. consumers have developed a taste for better, more expensive wines. Concurrently, California vintners began producing world-class wines and growers planted tens of thousands of acres of new vines. Above, Many connoisseurs learn about wine and buy directly at the winery.
IN September 2002, California grape growers picketed a Gallo grape-receiving facility in Fresno, protesting the $65 a ton — just enough to cover picking costs — offered for their grapes. Meanwhile, swank restaurants were serving wines made from Napa Cabernet Sauvignon grapes worth $3,700 a ton. The wine industry in California and the world is entering a new era, as people drink less but better wine. Will producers of lower-priced grapes raise their quality enough to attract more upscale wine drinkers, putting downward pressure on all grape and wine prices, or will the wine-grape industry continue to fragment into distinct quality and price segments, allowing one segment to prosper while another languishes?
In 1976, a revolution took place in the California wine industry. A blind tasting in Paris pitted several California wines against top French vintages. To the eternal chagrin of the (French) judges, the California wines — Stag's Leap Cabernet Sauvignon and Chateau Montelena Chardonnay — were voted superior. In part because domestic wines were dramatically improving, U.S. consumers in the 1980s and 1990s took a new interest in wine and the lifestyle associated with fine wine and food ( see page 76 ). At the same time, consumers increasingly appreciated and understood that the taste of wine reflects where the grapes are grown and how the wine is made. These and other changes have contributed to a reconfiguration of the California, and world, wine economy. In the 21st century, the California wine industry is changing as a result of consumption patterns, consolidation of production and the globalization of sales and tastes.
Quality, not quantity
U.S. wine drinkers upgraded their tastes over the past quarter century as baby boomers with more leisure time and money began to explore wine. Consumption of cheaper table wines, costing $3 a bottle or less, was stable during the 1980s. In November 1991, the CBS TV program 60 Minutes aired a segment on the “French paradox,” which found that moderate consumption of red wine lowers the risk of coronary heart disease, making wine consumption more acceptable among health-conscious consumers. Wine consumption, especially of better-quality table wine, rose sharply (table 1): wines carrying labels such as “Chablis” or “Burgundy” and classified as jug wine fell from 65% of consumption in 1991 to 36% in 2001. Wines costing $7 a bottle or more were 9% of sales in 1991, and 28% in 2001 (Fredrikson 2003). The average, inflation-adjusted price of a bottle (750 milliliter [ml]) went from $3.50 in 1991 to $4.60 in 2001, 2.5% annually. This increase in consumption of higher-priced wines and decrease in consumption of jug wines led to the phrase that consumers were drinking “less but better.” The popular premium category, also known as “fighting varietals,” now has a share equal to the once-dominant jug wines.
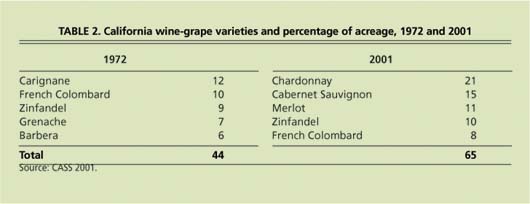
Higher grape and wine prices led to more plantings in California, especially in coastal areas associated with higher-priced wine grapes. At the beginning of the wine boom in the late 1970s, producer prices for wine grapes rose in all areas. However, increased production in the 1980s led to lower prices and a 10% reduction in acreage between 1982 and 1991. As the dollar rose in value in the 1980s, wine imports surged, achieving a 27% market share in 1984. During the late 1980s, the California wine industry again began to expand, but this time growers planted varietal grapes such as Chardonnay, Zinfandel, Cabernet Sauvignon and Merlot. The top five winegrape varieties accounted for 45% of the acreage in 1972 and 65% in 1997, but only French Colombard and Zinfandel were among the top five in both years (table 2; CASS 2001).
Wine-grape production methods also changed. In the early 1970s, most growers planted vines in rows 10 to 12 feet apart, which reduced disease risks by increasing air circulation but also limited yields on what was becoming more expensive land; rows today are spaced 8 feet or less apart. The most common trellis system during the 1970s had three wires, for the irrigation hose, cordon or vine, and a catch wire to support foliage. During the 1990s, trellises became more complex, often having wires to guide the shoots upward, fostering growth and facilitating exposure to sunlight. Some growers remove leaves by hand to increase the exposure of the grapes to sunlight. Grape clusters that are slow to ripen are removed, intensifying the flavor of the wine produced from the remaining clusters and increasing the quality of the wine.

TABLE 1. U.S. table wine consumption by retail price (750 ml bottle) and percentage of total volume, 1991-2001
Grape growers have become more sensitive to terroir, or local conditions. Rootstocks have been developed for particular areas so that vines are more disease resistant or drought tolerant, suggesting that parts of California may develop a French-style system that associates specific grape varieties with particular areas, such as Cabernet in the Napa Valley, Chardonnay in the Carneros area of Napa and Sonoma counties and Zinfandel in the Sierra foothill counties.
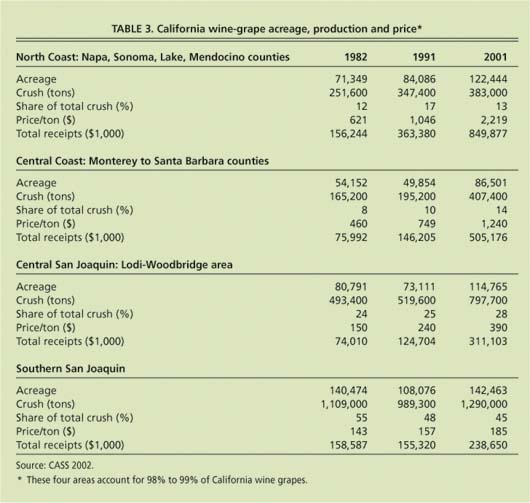
During the 1990s, the demand for wine increased and some wineries offered growers multiyear planting contracts with guaranteed prices (Goodhue et al. 2002). Plantings increased 48% between 1991 and 2001, with the fastest growth in the North Coast and Central Coast areas (table 3; CASS 2002). Non-bearing acreage increased even faster, although the exact amount remains uncertain because some growers have not fully reported their acreage.
In 2001 and 2002, the increased grape supply and the recession led to declining prices for wine grapes in all areas except the North Coast. In the southern San Joaquin Valley, the result was extremely low prices, which prompted the protests at Gallo. Over 60% of grape acreage in the southern San Joaquin Valley (Madera, Fresno and Tulare counties) is Thompson Seedless, grapes that can be marketed as table grapes, dried into raisins, or crushed to make wine or grape juice concentrate — a natural sweetener added to soft drinks and confectionery products. Many southern San Joaquin Valley growers do not have contracts with wineries, which explains why they were protesting low spot-market or harvest-time prices in 2002.
Farm, food industry consolidation
The farm and food industries are consolidating so that fewer and larger firms account for an increased share of total sales. The same squeeze on midsize players is occurring in the wine industry. The nation's top three wineries — Gallo, Canandaigua and The Wine Group — account for over 60% of the volume of U.S. wine that is shipped. In the current phase of industry consolidation, larger wineries are buying smaller ones, in part to improve their bargaining position with retailers such as Costco. For example, Constellation Brands owns Canandaigua Wine Co. — the second-largest wine producer after E. & J. Gallo — as well as Franciscan Estates, giving it a total of 51 brands in 14 market categories, including Almaden, Cribari, Inglenook, Paul Masson, Taylor California Cellars, Nathanson Creek, Dunnewood, Talus, Manischewitz, Cook's, Taylor and Wild Irish Rose. The Wine Group owns Glen Ellen, Franzia and Mogen David (Franson 2002). Consolidation enables one producer to market many labels, gaining shelf space in retail stores and facilitating exports and joint ventures.

Wine-grape production methods have changed since the 1970s. Many growers have become attuned to local growing conditions and are focusing more attention on trellising, pruning and thinning grapes in the field. As a result, high-value Chardonnay and Cabernet Sauvignon dominate the market.
Midsize wineries are at a competitive disadvantage vis-à-vis both larger and smaller ones. Small wineries in areas frequented by tourists can sell wine directly to consumers through their tasting rooms, thereby eliminating distributors and retailer markups. For example, the Napa Valley has 300 wineries, a third of California's total, and most sell much of their wine directly to visitors. Midsize wineries, by contrast, must often sell their wine via distributors, who can have considerable market power under state laws regulating alcohol sales; in some states, distributors have monopoly rights to distribute wine, and many states prohibit wine arriving from Internet sales. In the traditional, three-tiered marketing system for wine, wineries sell to distributors who sell to supermarkets and liquor stores. The markup from winery to consumer is often 100% or more, with much of the profit going to distributors. There is an ongoing effort to eliminate the distributor in wine marketing via Internet sales, but progress has been slow due to the constitutional right of states to regulate alcohol sales. Several lawsuits opposing the ban on Internet sales of wine are presently in court.
Large wineries aim to achieve economies of scale and produce uniform wines with vertical integration, growing grapes in their own vineyards or having grapes grown for them according to winery-set specifications. Many of the largest vineyards are in the Central Coast region, which lends itself to large-scale production of varietal wine grapes in areas where large parcels of grain and grazing land were converted to vine-yards. There are also economies of scale in winemaking, with more fermentation and storage capacity smoothing production and reducing wine crush and fermentation costs. Technological changes in fermentation and quality control have also made it easier to produce wine with a consistent taste, and research continues on understanding the chemical composition of wine to improve consistency.
Globalization of production
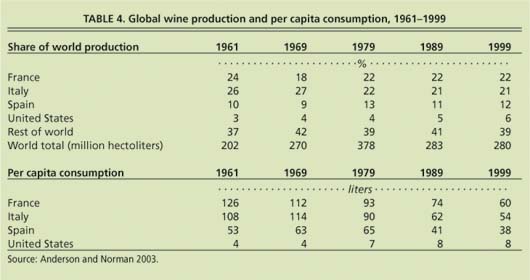
Although wine is one of the world's oldest drinks, production and consumption remain concentrated in Europe, which produces 74% of the world's 6 billion gallons of wine, equivalent to 1 gallon for each of the world's 6 billion inhabitants. The “Big Three” wine producers are France (22%), Italy (21%) and Spain (12%) (table 4). The other major European wine producers account for 19% of global wine production.
The United States is the fourth-largest producer of wine, accounting for about 6% of world production. Other major New World wine producers are Argentina (5%), South Africa (3%), Australia (2%) and Chile (2%) (Anderson and Norman 2003). They are New World countries in the sense that they share a common wine style (fresh and fruity) and were largely settled by European immigrants. The “Dynamic Trio” are Australia, Chile and South Africa; they collectively produce 10% of the world's wine, but have just 1% of the world's population, which means that most of the wine they produce is exported. Australia, for example, exports 90% of the wine it produces, and Australia, Chile and South Africa have large acreages of vineyard that are not yet producing grapes, promising more wine exports.
Import trends
The import share of U.S. wines over the last 2 decades has a V-shape: Imports made up 25% of the volume of U.S. wine consumed in the early 1980s, reached a low of 12% in 1990 and are now about 22%. Imports in the mid-1980s mostly affected U.S. producers of jug wines, as Italian imports such as Riunite and Bolla increased their U.S. sales (table 5; Fredrikson 2003). Today's import surge is led by two Australian labels, Lindemans and Rosemount Estate, which compete with wines produced in California's Central Coast and Lodi-Woodbridge region. In 2001, the United States imported 127 million gallons of wine and exported 80 million gallons; about 70% of U.S. wine exports go to Great Britain, Canada, Netherlands and Japan (table 5; Fredrikson 2003).

There is a battle fermenting between Old World European producers and New World producers. In Europe there are thousands of grape growers, many with fewer than 5 acres, and most send their grapes to co-op wineries. The famous chateaux that grow grapes and bottle wines with their own labels are exceptions. Most European wines are a blend of several grape varieties, and the wine is labeled to reflect the region in which the grapes were grown, such as Bordeaux or Burgundy. The quality and quantity of wine vary from year to year, which means that vintage charts are needed to determine the best wines.
In the New World, grape growing and winemaking are often integrated operations in which the winemaker aims for consistency so that the first and last bottle taste the same. New World wines, often produced with more technology, tend to be preferred by consumers in countries that do not produce much wine, such as the United Kingdom.
California transformation
Parts of the California wine industry have transformed themselves from producers of jug or generic wine to producers of high-quality wine; or from producers of wines labeled Chablis or Burgundy, which are winegrowing areas of France, to producers of world-class Chardonnay and Cabernet Sauvignon. UC research and individuals in the Napa Valley laid the groundwork for the 1976 Paris surprise. The wine boom they launched made some sectors of the state's wine industry extremely successful.
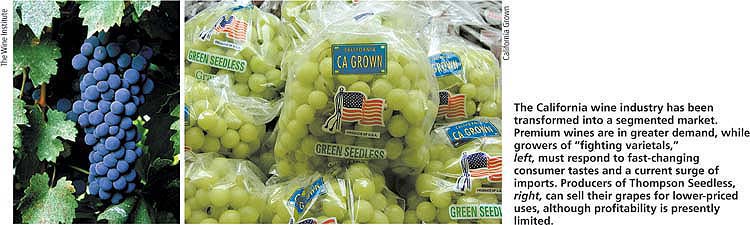
The California wine industry has been transformed into a segmented market. Premium wines are in greater demand, while growers of “fighting varietals,” left, must respond to fast-changing consumer tastes and a current surge of imports. Producers of Thompson Seedless, right, can sell their grapes for lower-priced uses, although profitability is presently limited.
The most pressing question facing the industry is how fast producers can respond to changing consumer tastes, as wine drinkers shift from jug wine to fighting varietals, fighting varietals to premium, and premium to ultra-premium wines. Analysts who do not distinguish between these different categories predict a “wine glut of historic proportions” (Palmer 1998). An article in Barron's emphasized that, with wine production rising 4% to 5% a year, and consumption rising 0% to 1% per year, "The basic laws of supply and demand guarantee that the coming glut will have a depressing effect on retail wine prices" (Palmer 2001). However, this prediction of a glut ignored the possibility of a segmented wine industry, as well as alternative outlets for lower-quality grapes. In a segmented wine industry, some parts may be booming while others go bankrupt. Displaced growers have alternatives in the grape concentrate (sweetener), raisin and table-grape markets. Thompson Seedless grapes, which account for one-third of the California grape acreage, can be sold in any one of the four markets. However, profitability in these alternatives, especially raisins and wine, is presently limited.
A related question is how long the trend toward more expensive wines will last. Today's population of senior citizens is the wealthiest in history. Many marketers feel this is the source of the shift to more expensive wines, and they note that the size of the baby boom generation is unique in U.S. history. At some point the shift to wine and to higher-priced wines may cease. Current levels of consumption, even for higher-priced wines, have been stagnant since 2000. This may be due to current economic forces and perhaps September 11, or it may foretell a plateau in wine consumption such as that experienced in the 1980s.
In addition to the change in tastes, considerable concern exists regarding the level and direction of imported wines — both bottled and bulk — which are used for blending. California vintners in partnership with foreign wineries, or California wineries with vineyards abroad, may prosper, but the fate of growers is less clear. Other concerns arise over the impact of ongoing consolidation, especially on medium-sized wineries, which could result in a few large wineries and many small wineries marketing to the agro-tourist and Internet trade.
The wine industry has been among the most successful of California's farming sectors. The growing number of educated wine drinkers, optimists emphasize, means that the demand for premium wines can continue to expand. If the demand for jug or generic wines continues to fall, the 21st-century wine industry may operate at very different speeds, with one segment enjoying record profits while another uproots unprofitable grapes.
California's wine industry enters new era

