


All Issues
Blue oak enhance soil quality in California oak woodlands
Publication Information
California Agriculture 57(2):42-47. https://doi.org/10.3733/ca.v057n02p42
Published April 01, 2003
PDF | Citation | Permissions
Abstract
Blue oaks create islands of enhanced soil quality and fertility beneath their canopy. The quality of soil beneath the oak canopy is considerably better than that of the grasslands adjacent to the trees. We found evidence of improved soil quality under blue oaks for physical, chemical and biological soil properties. The type of vegetation (oak versus annual grasses) has a much stronger influence on soil organic matter and nutrient pools than does soil parent material. Removal of oak trees results in a rapid deterioration of soil quality with the majority of the loss occurring within 10 to 20 years after tree removal.
Full text
Oak woodlands occupy 7.4 million acres (3 million hectares [ha]) in California (Griffin 1977) and represent the landscape where California's urbanwildland-agricultural interface is most pronounced (Standiford et al. 2002). In the oak woodlands, scattered trees create a mosaic of open grasslands and oak/understory plant communities.
These ecosystems are used extensively for livestock grazing, firewood production, wildlife habitat and watersheds—and, increasingly, the development of suburban communities. Land-use practices associated with these activities, such as tree removal, often result in severe ecosystem disturbances that affect soil and water quality. In turn, changes in soil quality may affect oak regeneration success and ecosystem stability (Pavlik et al. 1991; Barbour et al. 1993).
Evidence indicates that oaks create islands of enhanced fertility beneath their canopy due to nutrient cycling processes. These spatial patterns of nutrient availability may in turn influence the success of future regeneration and the structure of the plant community. Removing oak trees has been shown to increase forage production in areas beneath the former canopy, as opposed to adjacent open grasslands; however, this benefit is often short term—less than 20 years (Kay 1987). These observations suggest that oak trees are an important component of the ecosystem and that they play an important role in maintaining soil quality and fertility.

Islands of enhanced soil fertility beneath the oak canopy are especially noticeable during the spring. Note the luxuriant growth of annual grasses beneath the oak canopy compared with the adjacent open grasslands.
Our primary objectives in studying oak woodlands were to examine the differences in quality between soils beneath blue oak canopies and in adjacent open grasslands. We also wanted to determine what happens to soil quality when the trees are removed. These studies were conducted in three oak woodlands in the Sierra Nevada foothills (Madera and Yuba Counties) and Coast Ranges (southern Mendocino County). At two of the sites, we examined the effects of oak removal on soil quality and fertility at intervals between 5 and 34 years following tree removal.
The sites
We conducted this investigation in oak woodlands with contrasting soil parent materials: granite, sandstone/ shale and greenstone (metamorphosed basalt). The dominant oak species at all sites was blue oak (Quercus douglasii), and tree age was estimated to range between 75 and 120 years. Average oak stocking ranged between 50 and 500 trees per acre with average canopy coverage between 20% and 70%. The oak understory community and adjacent grasslands (areas not affected by oak canopy) were dominated by annual grasses and forbs. For the purpose of this study, we standardized our sampling to blue oaks growing on slopes that were less than 15%. The climate at all sites is Mediterranean, with cool, moist winters and hot, dry summers. All study sites have been historically grazed by sheep or cattle at a low to moderate grazing intensity.
The San Joaquin Experimental Range (SJER) is located in Madera County (central Sierra Nevada foothills) about 25 miles north of Fresno. Elevations of the sampling sites range between 394 and 492 feet. Mean annual precipitation is about 22 inches and mean annual air temperature about 63° F. Soils were formed from granite and their textures were sandy loams (sand = 68%, silt = 20%, clay = 12%). Clay mineralogy was dominated by mica and kaolinite with small amounts of vermiculite.
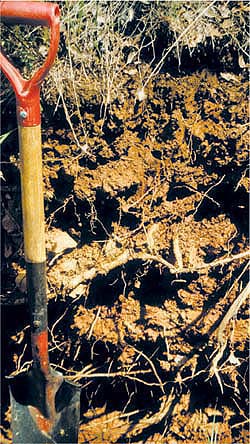
Shown are the upper 3 feet of a typical soil profile from a California oak woodland at the SFREC. Annual grass roots are limited to the upper 18 inches of the profile while oak roots are found throughout the entire soil profile (typically 4 to 6 feet).
The Hopland Research and Extension Center (HREC) is located in southern Mendocino County (northern Coast Ranges) about 5 miles east of Hopland. Elevations of the sampling sites range between 656 and 1312 feet Mean annual precipitation is about 37 inches and mean annual air temperature about 57° F. Soils formed from mixed sedimentary material of the Franciscan formation consisting of sandstone and shale with interspersed basalt and serpentine. Soil textures were loams (sand = 40%, silt = 35%, clay = 25%). The clay mineralogy contained a wide range of minerals including interstratified vermiculite-chlorite, vermiculite, illite, smectite, kaolinite and gibbsite.
The Sierra Foothill Research and Extension Center (SFREC) is located in Yuba County (foothills of the northern Sierra Nevada) about 19 miles east of Marysville. Elevations of the sampling sites ranged between 656 and 984 feet. Mean annual precipitation is about 29 inches and mean annual air temperature about 59° F. Soils formed from greenstone (metamorphosed basalt) and their textures were silty clay loams (sand = 18%, silt = 50%, clay = 32%). Clay mineralogy was dominated by interstratified vermiculite-chlorite, vermiculite, chlorite and kaolinite with small amounts of smectite.
At each site, five replicates of a composite soil sample (consisting of four subsamples) were collected for the 0-to-2-inch and 2-to-6-inch (0-to-5 cm and 5-to-15 cm) depth increments from beneath an oak canopy and in adjacent grasslands not affected by the oak canopy. At the HREC and SFREC sites we also collected soil samples from areas where trees were removed (at known times) between 5 and 34 years before sampling. Tree removal times were 5, 15,21 and 34 years at SFREC and 5,10 and 30 years at HREC. We will refer to sampling locations as (1) oak canopy (beneath tree canopy), (2) oak removed and (3) grassland (open grassland sites not affected by oak canopy). For the oak canopy and tree removal sites, soil samples were collected 6 to 7 feet from the tree or stump.
Soil samples were analyzed for the following parameters using standard methods of soil analysis (Soil Survey Staff 1984; Weaver et al. 1994):
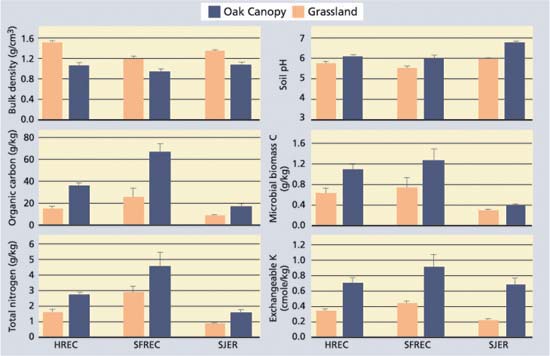
Fig. 1. Selected soil quality and fertility parameters (mean ± standard error; n = 5) for the 0-to-2-inch- (0-to-5 cm-) depth increment of soils beneath the oak canopy and adjacent grasslands for sites at HREC (sandstone/shale), SFREC (greenstone) and SJER (granite). All vegetation type comparisons (oak versus grassland) at a given site were statistically different at P = 0.05.
-
Bulk density (quantitative pit or soil cores)
-
Soil pH (1:2, soil:0.01 M calcium chloride [CaCl2] solution)
-
Total carbon and nitrogen (dry combustion with Carlo Erba C/N analyzer)
-
Microbial biomass carbon (chloroform incubation)
-
Plant-available phosphorus (Bray extraction)
-
Mineral N (ammonium [NH4+] and nitrate [NO3-]; extracted with 2 M potassium chloride [KCl]).
-
Potentially mineralizable N (hot KCl)
-
Cation exchange capacity and exchangeable cations (extraction with 1M ammonium acetate [NH4OAc]).
All statistical analyses were performed at a P = 0.05 significance level using SYSTAT for Windows, Version 9 (SYSTAT Inc., Evanston, Ill.).
Better soil quality and fertility
Blue oaks were shown to enhance soil quality and fertility beneath their canopies for all the soil parameters examined in this study (fig. 1). Islands of enhanced soil quality and fertility were apparent beneath the oak canopy for both sites that were grazed and sites that weren't, indicating that grazing is neither responsible for formation of these islands nor does it destroy these islands (Camping et al. 2002). Soils beneath the oak canopy generally had thicker A and AB horizons (organic-rich topsoil horizons), suggesting that oak trees promote the development of thicker topsoil horizons through enhanced organic matter production. Because of enhanced soil quality beneath the oak canopy, soil fauna (e.g., earthworms, ants) may also preferentially inhabit the soils beneath the canopy (based on casual field observations), leading to greater physical mixing of organic matter into the mineral soil profile.
Among soil physical properties, bulk density was decreased as much as 1.4-fold beneath the oak canopy. Increased mixing of soil by biota, coupled with enhanced soil structure due to increased organic matter and soil fauna/flora activity, contribute to lower bulk densities, improved water infiltration rates and improved gas exchange in upper soil layers. The resulting improvement in water infiltration and gas exchange in turn promotes an improved environment for soil organisms.
Enrichment of organic matter and nutrients beneath the canopy of oak trees results in large part from litterfall (dropping leaves, twigs and acorns) and its associated nutrients. The cycling of base cations (positively charged calcium, magnesium and potassium) by oaks often leads to higher base saturation in the surface horizons beneath the oak canopy (Dahlgren et al. 1997). The higher base saturation leads to higher soil pH values beneath the oak canopy. At SFREC, blue oaks return an average of 8,100 pounds per acre per year (1b/ acre/yr) (9,100 kilograms per hectare per year [kg/ha/y]) of litterfall to the soil surface with its associated nutrients (Dahlgren et al. 1997). The added organic matter contains nutrients within its structure (nitrogen = 75 pound/ acre/yr [84 kg/ha/yr], phosphorous = 7 pound/acre/yr [8 kg/ha/yr], potassium = 34 pound/acre/yr [38 kg/ha/yr]) and provides nutrient storage capacity in the form of cation exchange capacity.
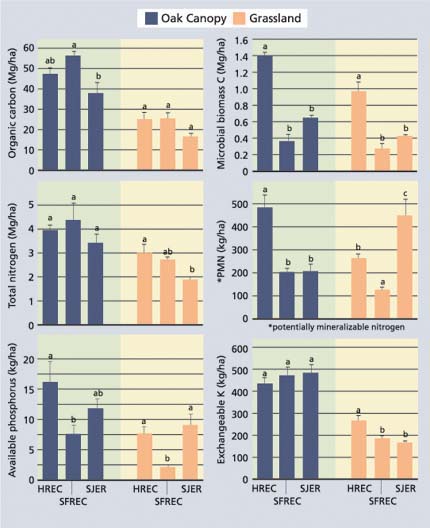
Fig. 2. Organic carbon and nutrient pools (mean ± standard error; n = 5) for the 0-6-inch- (0-15 cm-) depth increment of soils beneath the oak canopy and adjacent grasslands for sites at HREC (sandstone/shale), SFREC (greenstone) and SJER (granite). Means with same lower case letters within each vegetation type (oak versus grassland) are not statistically different at P= 0.05.

Fig. 3. Concentrations (mean ± standard deviation) of potassium and nitrate in precipitation (PPT), canopy throughfall (TF) and soil solutions from A, AB and Bt horizons of soils at SFREC. Soil solutions were collected from soils beneath the oak canopy, from adjacent grasslands and from sites where blue oaks were removed. Solutions were collected monthly from December through May following removal of the oak trees the previous September.
Additionally, canopy throughfall (precipitation dripping from the canopy) contributes appreciable fluxes of nutrients, such as nitrogen (N = 4.6 pound/acre/yr [5.2 kg/ha/yr]), phosphorus (P = 1.1 pound/acre/yr [1.2 kg/ha/yr]), calcium (Ca = 28.5 pound/ acre/yr [32 kg/ha/yr]) and potassium (K = 34.7 pound/acre/yr [39 kg/ha/ yr]) (Dahlgren and Singer 1994). Nutrient fluxes in canopy throughfall originate from the capture of atmospheric aerosols and particulate matter, as well as from root uptake. Because oak roots are found at greater depths (more than 3 feet) than those of annual grasses (generally less than 1.5 feet), nutrient uptake by oak roots lessens leaching losses of nutrients from the soil profile. The extension of oak roots beyond the edge of the canopy also contributes to nutrient differences between soils beneath the oak canopy and open grasslands. The selective uptake of nutrients by oak roots will remove nutrients from the open grasslands and concentrate them beneath the oak canopy. Cattle seeking shade and defecating under trees more than in open areas does not appear to be an important factor because similar levels of nutrient enrichment are found on both grazed and non-grazed sites (Camping et al. 2002).
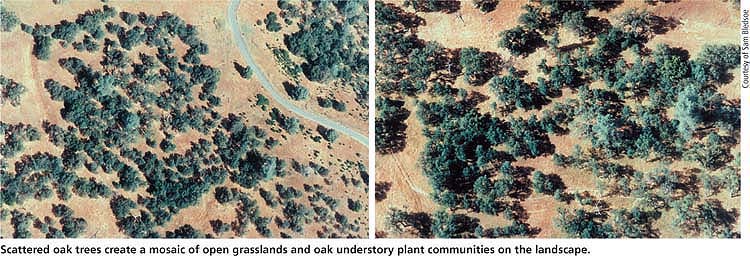
Scattered oak trees create a mosaic of open grasslands and oak understory plant communities on the landscape.
A further beneficial effect of the oak canopy on nutrient cycling occurs through reduced leaching and erosion, which results in more nutrients being retained in the upper soil layers (Dahlgren and Singer 1994; Dahlgren et al. 1997). Reduced leaching of nutrients and erosion of soil materials have a beneficial effect on water quality in streams draining these watersheds. At SFREC, evapotranspiration (loss of water vapor from soil and plant surfaces and through plant stomata) is approximately 30% greater in the oak system as compared with the open grasslands. This is because of the greater extraction of water from the soil profile by deeply rooted oak trees and because precipitation is intercepted by the oak canopy (and then evaporates). This loss of water reduces the leaching intensity beneath the oak canopy more than in the grassland sites. In addition, higher organic matter concentrations lead to lower soil bulk density and increased infiltration rates, which reduce surface runoff and loss of nutrients through erosion. Thus there are several biogeochemical processes by which oak trees concentrate nutrients and create islands of enhanced soil quality and fertility beneath their canopy.
Soil parent material
The primary difference between the three study sites was the composition of the soil parent material. Parent material differences resulted in large variations in soil texture (SJER, sandy loam; HREC, loam; SFREC, silty clay loam) and clay mineralogy. In addition, differences in climatic factors may result in differences in net primary production. In spite of these many differences, pools of organic carbon and total nitrogen in the 0-to-6-inch (0-to-15 cm) layer were similar among the sites (fig. 2). Microbial biomass carbon and potentially mineralizable nitrogen tended to be higher at HREC. Available phosphorus was lower at SFREC, which may be attributable to strong sorption of phosphate by iron oxides, which are found in high concentrations in soils at this site. Exchangeable potassium concentrations were generally similar across all sites.
Differences between study sites were expected to result in much larger differences between organic carbon and nutrient pools. For the most part, however, differences between sites were small. We conclude that vegetation has a much stronger effect on soil organic matter and nutrient pools than do differences in soil parent material.
Effects of tree removal
Oak tree removal has been suggested as a way to increase forage production by decreasing competition for light, water and nutrients. Short-term increases in forage production were commonly observed following tree removal in relatively open stands. However, this benefit lasts less than two decades before forage production returns to levels found in the adjacent grasslands (Kay 1987). To ascertain the reason for this observation, we examined soil from plots where oak trees were removed up to 34 years ago. We were particularly interested in determining how long the islands of enhanced soil quality and fertility persist once oak trees are removed.
A study at SFREC followed changes in soil solution chemistry in the year following oak tree removal (Dahlgren and Singer 1994). We used soil solution chemistry because it reflects the current biogeochemical processes occurring in a soil. The soil solids (solid-phase) in contrast, integrate all soil processes that have occurred during the development of the soil and as a result are not always a sensitive indicator of ecosystem disturbance. Oaks were removed during the summer prior to senescence, and all tree components were removed from the site. We compared the soil solution chemistry from the tree removal sites with adjacent soils from beneath the oak canopy and from open grasslands.
Concentrations of essential plant nutrients, such as potassium and nitrate, were much higher in soil solutions beneath the oak canopy compared with grassland soils, reflecting the islands of enhanced soil fertility (fig. 3). In contrast, the nonessential nutrient, sodium, displayed similar concentrations for oak canopy and grassland soils, indicating that nutrient cycling by oak trees was an important factor in enhancing essential plant nutrient concentrations in soil solutions beneath the oak canopy (Dahlgren and Singer 1994). Oak tree removal resulted in an immediate shift in soil solution nutrient concentrations toward that of the grassland soils. These data indicate that islands of soil fertility are quickly reverting to nutrient conditions similar to grassland soils following tree removal.
Given the rapid and dramatic decrease in soil solution nutrient concentrations, we subsequently examined solid-phase soil quality and nutrient parameters to determine whether differences could be detected. We focus this discussion on results from HREC; however, similar results for oak tree removal at SFREC were found (Camping et al. 2002). There was an appreciable loss of soil organic matter following tree removal at HREC. Organic carbon concentrations showed a significant decrease after 10 years in the 0-to-2-inch (0-to-5 cm) layer and approached that of grassland soils after 30 years (fig. 4). Organic carbon concentrations also decreased in the 2-to-6-inch (5-to-15 cm) layer, but at a much slower rate than in the 0-to-2-inch layer. Microbial biomass carbon showed a rapid decrease (within 5 years) in the 0-to-2-inch layer following tree removal and a much slower and smaller decrease in the 2-to-6-inch layer. Total nitrogen concentrations followed a pattern similar to organic carbon with a significant decrease after 10 years and a decline to levels similar to grassland soils after 10 to 30 years. As with organic carbon and microbial biomass carbon, concentrations in the 2-to-6-inch layer showed a slower and smaller decrease following tree removal. Bulk density in the 0-to-2-inch layer showed a significant increase over time following tree removal and is probably associated with the loss of soil organic matter.
![Selected soil quality and fertility parameters (mean ± standard error; n = 5) for the 0-to-2-inch- and 2-to-6-inch- (0-to-5 cm and 5-to-15 cm) depth increments of soils beneath the oak canopy (T) and adjacent grasslands (G), and for soils where oak trees were removed 5, 10 and 30 years ago at the HREC site. Means with same lower case letters within each depth increment (0-to-2 inch- and 2-to-6-inch- [0-to-5 cm and 5-to-15 cm]) are not statistically different at P = 0.05.](http://ucanr.edu/sites/calagjournal/archive/?image=fig5702p46a.jpg)
Fig. 4. Selected soil quality and fertility parameters (mean ± standard error; n = 5) for the 0-to-2-inch- and 2-to-6-inch- (0-to-5 cm and 5-to-15 cm) depth increments of soils beneath the oak canopy (T) and adjacent grasslands (G), and for soils where oak trees were removed 5, 10 and 30 years ago at the HREC site. Means with same lower case letters within each depth increment (0-to-2 inch- and 2-to-6-inch- [0-to-5 cm and 5-to-15 cm]) are not statistically different at P = 0.05.

Fig. 5. Loss of organic carbon and nitrogen from the 0-to-6-inch-(0-to-15 cm) depth increment as a function of time since oak tree removal at the SFREC and HREC sites.
Losses of organic carbon and total nitrogen were more rapid and larger in magnitude at SFREC than at HREC (fig. 5). After 30 to 34 years, the organic carbon pool in the 0-to-6-inch-layer decreased by about 26,720 pound/acre (30 Megagram/hectare [Mg/ha] (44% decrease) and 16,032 pound/acre (18 Mg/ha) (34% decrease) at SFREC and HREC, respectively. A similar comparison for the total nitrogen pool showed losses of about 1247 pound / acre (1.4 Mg/ha) (29% decrease) and 624 pound/acre (0.7 Mg/ha) (19% decrease) at SFREC and HREC, respectively. The majority of the organic carbon and nitrogen is lost within the first 10 to 20 years following tree removal.
The rapid and large decreases in the organic carbon and nitrogen pools result, in part, from the immediate loss of litterfall from oak trees once the tree is removed. The return of about 4,000 pound/acre/yr (4,500 kg/ha/yr) of organic carbon and 75 pound/acre/yr (84 kg/ha/yr) of nitrogen in litterfall to the soil beneath the oak canopy provides a large annual input of organic matter. The loss of litterfall inputs coupled with rapid decomposition in the tree removal soils (Ridolfi et al. 2000) result in a shift in soil organic matter concentrations until a new steady-state, less enriched with nutrients, is reached with respect to organic matter inputs from the annual grasses that dominate following oak removal. Nitrogen pools were also shown to respond quickly to oak removal resulting in the loss of 19% to 29% of the total soil nitrogen in the 0-to-6-inch soil layer within 30 years.
At this point, we do not know the exact mechanism(s) responsible for the loss of nitrogen from the soil. We speculate that nitrate leaching and denitrification are active in removing nitrogen from the soil following tree removal. Furthermore, grazing may redistribute nitrogen on the landscape as livestock preferentially graze on the more luxuriant forage growing beneath the former oak canopy. Nitrate leaching to stream water does not appear to be a major mechanism of nitrogen loss following tree removal as demonstrated by Singer and co-workers (MJ Singer, personal communication). Their results showed no increase in stream water nitrate concentrations following removal of 14% of the oak trees from a watershed at SFREC.
Oak conservation
Results from our studies show that blue oaks create islands of enhanced soil quality and fertility across a range of soil parent materials. There were no appreciable differences between islands of soil quality and fertility between grazed and non-grazed sites; this indicates that grazing is neither responsible for formation of these islands nor does grazing destroy these islands. Nutrient concentrations beneath the blue oak canopy were generally 1.5 and 3.0 times greater than those found in open grassland soils for most soil quality parameters. Within a given vegetation type (blue oak versus grassland), organic matter and nutrient pools in the 0-to-6-inch layer of soil were similar in magnitude across the range of soil parent materials. However, there were large differences in soil nutrient pools beneath the oak canopy as compared with adjacent grasslands. We conclude that vegetation type has a much stronger influence on soil organic matter and nutrient pools than does soil parent material.
In addition, oak tree removal resulted in a rapid and relatively large decrease in soil quality and fertility. The majority of these losses occurred in the 0-to-2-inch-layer, and they occurred within 10 to 20 years after tree removal. The loss of organic matter and nutrient returns via litterfall, and rapid decomposition of soil organic matter, are believed to be primarily responsible for this rapid loss of organic matter and nutrients following oak tree removal.
Our results clearly show that blue oak trees enhance soil quality in California oak woodlands. Improved soil quality was shown for physical (bulk density, aggregate stability, infiltration), chemical (pH, cation exchange capacity) and biological (microbial biomass, soil respiration) parameters. The presence of oak trees increases net primary production and may enhance species diversity (Pavlik et al. 1991; Barbour et al. 1993), water quality (Dahlgren et al. 1997), forage quality (Frost et al. 1997) and wildlife habitat (Pavlik et al. 1991; Barbour et al. 1993). Planting oaks can sequester relatively large amounts of carbon into California soils; however, the sequestered carbon may be quickly released back to the atmosphere upon oak removal. Because oak trees play many beneficial roles in the ecosystem, land managers should carefully consider oak conservation in managing California oak woodlands and savannas.
Blue oak enhance soil quality in California oak woodlands

