


All Issues
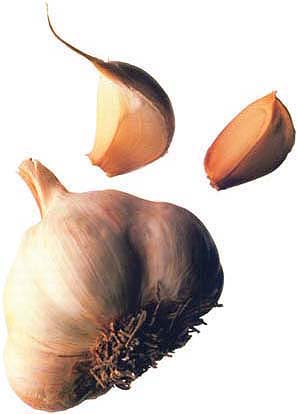
Garlic in clay loam soil thrives on little irrigation
Publication Information
California Agriculture 56(4):128-132. https://doi.org/10.3733/ca.v056n04p128
Published July 01, 2002
PDF | Citation | Permissions
Abstract
We conducted 4 years of irrigation experiments in garlic on the West Side of the San Joaquin Valley to determine appropriate irrigation frequency and cutoff dates as well as the effect of irrigation on yields for crops grown in sandy and clay loam soil. In sandy soil with the moisture content at field capacity prior to the rapid growth stage, yield was strongly dependent on applied water, and weekly irrigation was needed for maximum yield. In clay loam, yield did not depend on applied water because the garlic plants were able to extract sufficient soil moisture to offset deficit irrigation. Irrigation cutoff in both soils should occur by mid-May.
Full text
California supplies about 80% of the U.S. commercial garlic used for fresh-market, seed and dehydrated products. Within California, Fresno County in the San Joaquin Valley produces about 82% of the state's garlic crop, while the rest is grown primarily in Kern (11%) and Monterey (5%) counties (CDFA 2001).
Few studies have been published on water use and water management of garlic. One literature review of garlic concluded that (1) garlic has a rather sparse and shallow root system with roots limited to the top 2 feet of the soil; (2) best yields occur when the soil moisture content is maintained near field capacity; and (3) irrigation should cease 3 weeks before harvest to prevent rotting, discoloration of the bulb skins and exposure of outer cloves (Brewster and Rabinowitch 1990). Furrow irrigation is the most common in California garlic production, although sprinkler irrigation is sometimes used.
Irrigation practices by California garlic producers vary considerably, reflecting a lack of information regarding garlic's response to timing and the necessary amounts of irrigation. Our study investigated the effect of different approaches to irrigation on garlic in the San Joaquin Valley.
A look at water
We conducted 4 years of experiments at the UC Westside Research and Extension Center located in western Fresno County, with the California Early garlic variety, which is used for processing rather than sold fresh. All experimental plots were planted in mid-October and harvested in July. We used sprinkler irrigation to establish the stands.
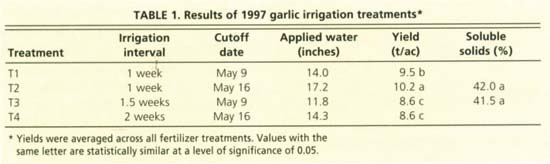
Irrigation timing, 1997. In 1997, we investigated irrigation timing on garlic yield using a completely randomized-block split-plot design. The experimental design consisted of four furrow irrigation treatments on silt loam replicated six times as the main plots. Each 40-foot main plot contained four nitrogen fertilizer subplots, each with four 40-inch beds. Nitrogen applications were 100, 200, 300 and 400 pounds per acre. The irrigation treatments, which began in early March, were as follows: once a week with the last irrigation on May 9 (T1); once a week with the last irrigation on May 16 (T2); once every 1.5 weeks with the last irrigation on May 9 (T3); and once every 2 weeks with the last irrigation on May 16 (T4). For each plot, applied water and yield were measured. We measured soil moisture in three replications of each irrigation/fertilizer treatment using a neutron moisture meter calibrated for the soil type. (This device uses a probe containing a radioactive source that is lowered into the soil using an access tube. The radiation emitted by the source is sensitive to soil moisture.) Measurements were made at 0.5-foot-depth intervals between 0.5 foot and 6 feet.
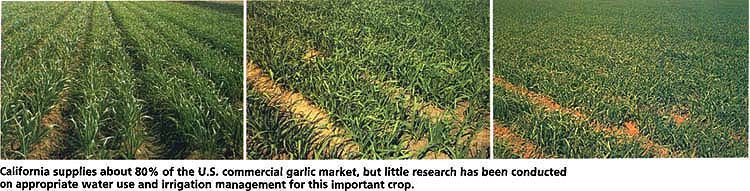
California supplies about 80% of the U.S. commercial garlic market, but little research has been conducted on appropriate water use and irrigation management for this important crop.
Irrigation cutoff dates, 1998
The 1998 experiment initially involved different water applications, using a randomized-block experimental design with six replicates on clay loam soil. But because of spring rainfall, irrigation did not occur until late April. As a result, the experiment was changed to investigate different irrigation cutoff times with subplots of nitrogen applications of 100, 175, 250, 325 and 400 pounds per acre.
The main treatments were irrigation cutoff dates of May 12, May 19, May 25 and June 1 Each subplot contained three beds with 40-inch spacing. The main plot length was 45 feet. Two beds were harvested for crop yield and quality.
Sprinkler line source, 1999
In the 1999 experiment, we used a sprinkler line source to determine garlic's response to applied water (Hanks, Keller et al. 1976). This system uses a single line with sprinklers spaced close together for good water distribution. The sprinkler line was 295 feet long with sprinklers (5/32 inch in nozzle diameter) spaced every 12 feet. Areas close to the line received more water than those farther away. We measured yield and amount of water applied, with distance from the sprinkler line.
The same fertilizer applications as in 1998 were applied to subplots (12 feet long) installed in a randomized-block design along both sides of the sprinkler line. We statistically analyzed the fertilizer effects using the method proposed by Hanks, Sisson et al. (1980). Soil texture at this site was clay loam between the soil surface and a depth of 5 feet with loam below.
Three transects of catch cans (6 inches in diameter), were installed in 12 beds on each side of the sprinkler line to measure applied water. These beds were harvested for yield. The sprinklers ran during the early morning hours when wind speed was minimal.
Two transects, each with six neutron-moisture-meter access tubes, were installed in every other bed on each side of the sprinkler line. Moisture contents were measured down to 3.5 feet at 0.5-foot-deep intervals, which according to 1997 results was deeper than any root growth.
Canopy coverage was determined at each access tube location using a Dycam infrared digital camera and its software, in order to describe the rate of crop growth. Canopy coverage is defined as the percentage of soil area shaded by the canopy at midday.
Sprinkler line source, 2000
The sprinkler-line-source experiment was repeated in 2000 on a coarse-texture soil. Soil texture was loam for the top 1 foot with sandy loam below. This source experiment was divided into four blocks, each containing three nitrogen fertilizer treatments (100, 250 and 400 pounds per acre). The plot was 23 feet long. In addition to the yield data, soluble solids (an indicator of garlic quality) were measured for selected plots. The data collected for 2000 were the same as in 1999.
Irrigation and garlic crops
Yield differences due to nitrogen treatments were not statistically significant in 1998, 1999 and 2000. In 1997, the yields of the highest nitrogen treatments were statistically significant from those of the two smaller treatments. However, these results may not be meaningful in light of results from the later 3 years, when no interactions occurred between nitrogen and irrigation.
1997 results
In 1997, T2 gave the highest yield, which was statistically different from yields of the other treatments (table 1). The yields of T3 and T4, significantly different from yields of T1 and T2, were the lowest. Less water was applied for T1 compared with T2 due to the earlier cutoff date, which affected yield.
Changes in soil moisture content between irrigation applications in 1997 occurred down to 2.5 feet, with little or no change below 2.5 feet (data not shown), suggesting little or no root activity below that depth. A decline in moisture content occurred for depths less than 2.5 feet during the measurement period.

Infrared photos show canopy coverage on garlic plants 5 feet, left, and 38 feet, right, from a sprinkler line, demonstrating the effect of decreasing applied water.
1998 results
The 1998 results showed decreasing total yield with later cutoff date: The differences between the May 12 and May 19 yields and the May 25 and June 4 yields were statistically significant. No irrigation treatment effects on the percent of soluble solids were found. Lower yields occurred in 1998 compared with 1997 because of late rainfall and garlic rust, a fungal disease. In 1998, rainfall between early March and early June was nearly 4.4 inches.
1999 results
In 1999, yields and applied water were averaged across all nitrogen plots for each measurement distance from the sprinkler line. Garlic yield showed little or no response to applied water (fig. 1). The linear regression was not significant at a level of significance of 5%. The coefficient of determination was 0.014, indicating that little of the yield variability is explained by the variability in applied water.
Applied water decreased with distance from the sprinkler line on both sides in a fairly linear manner (fig. 2). Average water amounts ranged from 12.8 inches to 13.2 inches next to the sprinkler line, and from 3.2 inches to 3.4 inches at the farthest distance.
Unit bulb weight increased linearly with more applied water. The minimum average unit weight was 0.07 pound per bulb and the maximum was 0.12 pound per bulb. The coefficient of determination was 0.51, and the linear regression was significant.
The canopy coverage increased with time at all distances (fig. 3A). In the 160 days after planting, little difference in canopy coverage was found at each distance. After 160 days, the canopy coverage continued to increase, but only slightly at 38.1 feet. Average maximum canopy coverage, which occurred 200 days after planting, ranged from 73% to 78%, but was only 57% at 38.1 feet from the sprinkler line.
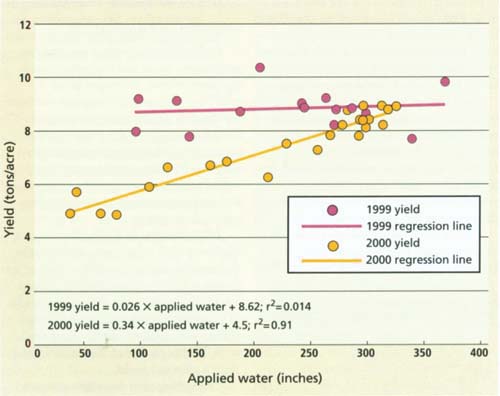
Fig. 1. Yield versus applied water for 1999 and 2000 sprinkler-line-source experiments. Equations describe the relationship between garlic yield and applied water.
Changes in soil moisture were determined between early March, when moisture content was at field capacity, and early June. Maximum soil moisture content occurred in early March due to rainfall, while complete senescence occurred by early June. At 5 feet from the sprinkler line, a slight trend of decreasing soil moisture content occurred over time, for all depths except at 3.5 feet. Little change in soil moisture occurred at that depth. At 38 feet, soil moisture content decreased considerably over time at all depths. A response to irrigation occurred only at a 0.5-foot depth. The decrease in soil moisture content at 3.5 feet, from 50% to 35%, suggests that soil moisture extraction was occurring at greater depths. At this distance, the average change in soil moisture content during the measurement period was 2.3 inches per foot.
2000 results
In 2000, garlic yield decreased with less applied water (fig. 1). The regression and coefficients of the linear regression equation were highly significant at a level of significance of 5%. The coefficient of determination was 0.91, indicating that almost all yield variability is explained by the variability in applied water.
Bulb weight increased linearly with increasing applied water, with a maximum average weight of 0.11 pound per bulb and a minimum of 0.06 pound per bulb. The coefficient of determination was 0.75; linear regression coefficients were statistically significant.
No significant trend was found between soluble solids and yield, or between soluble solids and nitrogen application. The average soluble solids content of 46 samples analyzed by a commercial processor's laboratory was 44.1%, with a standard deviation of 1.2%. In addition, no significant trends were found between dry weight and applied water, or between dry weight and nitrogen application.
Up to 16 feet from the sprinkler line, changes in applied water with distance were small, ranging from between 10.8 inches and 12.5 inches (fig. 2). Beyond about 16 feet, average applied water decreased fairly linearly with distance from the sprinkler line; the average water amounts of 1.2 inches and 1.4 inches were at the farthest distance.

Little difference in canopy coverage occurred with distance from the sprinkler line, up to 137 days after planting (fig. 3B). Thereafter, at distances of 18 feet or less, few differences between distances occurred over time, with maximum values ranging from 72% to 76% (200 days after planting). Beyond 18 feet, maximum canopy coverage values were less and occurred earlier. At the farthest distance, a maximum value of 57% occurred 171 days after planting.
Soil moisture content decreased over time at all distances (except 5 feet) and at all depths. The trend was less for depths greater than 3.5 feet. Little or no response due to irrigation occurred at depths greater than 2.5 feet. The average change in soil moisture content at the farthest distance was about 0.9 inch per foot.
Crop water use
The crop water-use values in these experiments do not include effective rainfall. Cumulative rainfall after early March was 0.6 inch in 1997 and 2000 and 0.9 inch in 1999. However, much uncertainty exists in estimating effective rainfall, which depends on factors such as amount, soil moisture depletion at time of rainfall, frequency of rainfall and absence or presence of a crop. Effective rainfall was assumed to be negligible in these analyses because of the small amounts and the uncertainty.

Fig. 3. Canopy coverage versus days after planting for (A) 1999 and (B) 2000 sprinkler-line-source experiments.

Fig. 4. Total water, applied water and change in soil moisture content for (A) 1999 and (B) 2000 sprinkler-line-source experiments.
The lack of a yield response to applied water at the clay loam site (1999 experiment) indicates that the garlic was able to substitute soil moisture for applied water where there was deficit irrigation. Although applied water decreased with distance, total water decreased only slightly for distances less than about 26 feet (fig. 4A). However, the change in soil moisture increased with distance. These data suggest that the garlic extracted moisture from depths greater than 4 feet. Beyond 26 feet, the total amount of water decreased considerably with distance. Except for the farthest distance, this decrease probably reflects the lack of soil moisture measurements below 3.5 feet. At the farthest distance, total water use probably was less because of smaller canopy size. Maximum total water use during the measurement period was about 17.7 inches.
The canopy coverage behavior indicates similar crop water use with distance, except at 38.1 feet, 160 days after planting. Canopy size determines the amount of radiation energy intercepted by the plant, and, in turn, the crop water use (Hsiao 1990). After 160 days, crop water use at 38.1 feet would be less compared with the other distances because of the smaller canopy size. Nevertheless, this potential reduction in water use had no effect on garlic yield.
Total water use in 2000 decreased with distance (fig. 4B). The change in soil moisture content also decreased with distance. Soil moisture was insufficient in the sandy soil to offset the decreasing applied water with distance, and thus both canopy coverage and crop yield decreased with distance. As stated earlier, the average change in soil moisture content at the farthest distance was about 2.3 inches per foot for the clay loam and about 0.9 inch per foot for the sandy loam. Maximum total water use in 2000 was about 17 inches.
Irrigation strategies
The yield responses to applied water suggest that different irrigation water management strategies should be employed based on soil type. For both line-source experiments (1999 and 2000), the soil moisture content was at field capacity at the start of the rapid growth stage. Sprinkler irrigation (commonly used for stand establishment) and rainfall should replenish the soil moisture by late February. Irrigation should start in March.
For clay loam soil, the yield response to applied water indicates that irrigation amounts, and possibly timing, are not critical, assuming a full soil profile at the end of February. For this type of soil, yield will not be reduced when irrigation amounts are less than the potential crop water use. This approach may improve irrigation efficiency, stretch limited water supplies during a drought and reduce subsurface drainage.
Sandy loam soil requires weekly irrigation in amounts sufficient to replenish soil moisture between irrigations and prevent yield loss. The last irrigation should occur by mid-May for California Early variety. The amount used by the crop starting in early March should be about 17 inches to 18 inches plus that needed for irrigation system inefficiencies. Based on the 2000 results, reduced water applications should not adversely affect the soluble solids or dry weight of garlic crops.
Garlic in clay loam soil thrives on little irrigation

