


All Issues
Alfalfa water use pinpointed in saline, shallow water tables of Imperial Valley
Publication Information
California Agriculture 55(4):38-43. https://doi.org/10.3733/ca.v055n04p38
Published July 01, 2001
PDF | Citation | Permissions
Abstract
Although alfalfa is the dominant water user in the Imperial Valley and is planted on 40% of its irrigated acreage, data is incomplete regarding its water use under the most common growing conditions: moderately saline, clay soils with a relatively shallow, moderately saline water table. In a study from 1996 through 1998, we determined the seasonal variation in the alfalfa crop coefficient (Kc), based on measurements of applied water and soil-moisture depletion, and the contribution from the water table aquifer. Using chloride mass-balance methods, we estimated that the shallow water table contributed approximately 12% of the total applied water during the study, of which just over 8% occurred during the first year. Correcting the values for water table contributions (WTC) to crop water use removed the increasing trend in values during the study and resulted in an overall study crop coefficient of 0.84. The decrease in WTC was the result of a doubling in soil salinity to 12 deciSiemens per meter at the 3- to 4-feet-depth interval by the second year. For moderately saline growing conditions in the Imperial Valley, the alfalfa crop coefficient is smaller than elsewhere in the southwestern states, where values closer to one are common.
Full text
Forage crop production accounts for the majority of water use in several western states. In California, alfalfa production alone uses the greatest amount of water, followed by pasture, rice, cotton and metropolitan Los Angeles. A perennial crop, alfalfa also dominates water use in the Imperial Valley, where it is regularly planted on nearly 40% of the irrigated acreage. Despite several alfalfa water-use studies conducted across the southwestern states, little information has been developed regarding its water use throughout the production cycle when grown on moderately saline clay soils with a relatively shallow, moderately saline water table. As competition for water resources intensifies, it is important to have a better understanding of the water use associated with forage crop production under the growing conditions most common in the valley.
In the Imperial Valley, October and November are the optimal planting months for establishing an alfalfa stand. Alfalfa is then reseeded, as necessary, to maintain the stand through a 3- to 4-year production cycle. Alfalfa is harvested as hay via seven to nine cuttings per year. Hay yield per acre tends to decrease during the late summer (July to September), when evapotranspiration is greatest.
According to UC Cooperative Extension (UCCE) county guidelines, two irrigations should be used to establish the stand, followed by two irrigations per cutting (Mayberry et al. 1996). As such, it is usually assumed that alfalfa applied water use in the lower desert regions of California matches that of annual reference evapotranspiration (ETo) adjusted for irrigation efficiency, or approximately 78 inches per year in the 1990s.
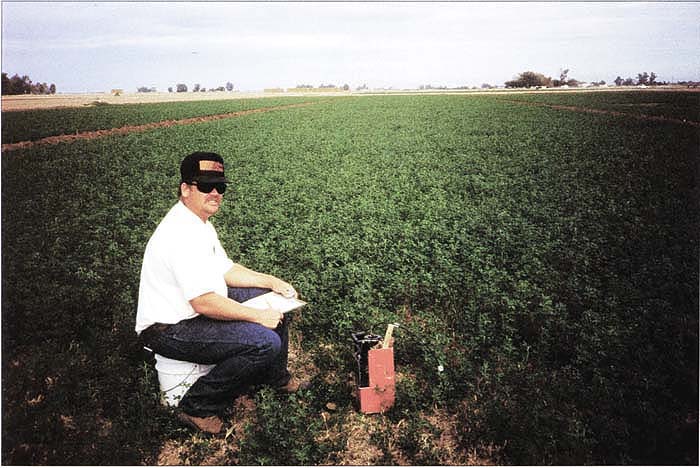
Alfalfa is the dominant water use in Imperial County, planted on 40% of the region's irrigated acreage. For a study of water use by alfalfa, research assistant Mark Stutes of UC Cooperative Extension in Imperial County takes soil moisture readings at the UC Desert Research and Extension Center (UCDREC) near Holtville.
Actual water use by the stand depends on when cuttings occur, that is, immediately following each harvest. Relative crop water use reaches a minimum and then slowly increases again as the leaf area expands. This variation in actual water consumptive use by the crop during the year is reflected in a changing crop coefficient (Kc), defined as the ratio of stand evapotranspiration to a grass reference evapotranspiration (ETo).
Effective irrigation scheduling, which uses the most recent evapo-transpiration data from the past decade, requires knowledge of the seasonal variation of the crop coefficient under prevailing growing conditions. These growing conditions may also include the presence of a shallow water table. Therefore, some assessment of its possible contributions to crop evapotranspiration must be considered.
Generally, the magnitude of seasonal water table contributions (WTC) to crop water use depends on the water table depth and salinity, as well as the plant-rooting depth and prevailing evapotranspiration (Grismer and Gates 1988). Results of field or lysimeter studies comparing alfalfa use of shallow groundwater to hay yield have resulted in conflicting suggestions for irrigation management (Guitjens 1990). Increasing soil salinity often reduces crop water use, as alfalfa tolerates salinity up to 2 deciSiemens per meter (dS/m) before hay yield begins decreasing at approximately 7% per unit dS/m increase of salinity (dS/m is a standard measurement of salinity equivalent to the old unit of mmhos/cm).
The objectives of this study were to determine the field water use (applied water and WTCs) and crop coefficients throughout an alfalfa production cycle under the moderately saline growing conditions of the Imperial Valley.
Study on alluvial clay soil
The study was conducted at the UC Desert Research and Extension Center (UCDREC) near Holtville, Calif. Seven and one-half acres of alluvial clay soil at the center of Area 80 were cultivated and planted with alfalfa (CUF 101 cultivar) in early November 1995 and reseeded in October 1997. Soil preparation, planting rates, varieties, fertilization and pest control were performed according to UCCE Guidelines to Production and Practices for Imperial County field crops (UCCE circular 104-F) and Alfalfa Production in the Low-Desert Valley Areas of California (UC DANR leaflet 21097).
Alfalfa hay was cut at approximately 10% bloom and baled at moisture contents of approximately 10% to 15%. With the exception of reducing irrigation frequency per cutting (from two to one) during the first year so as to encourage the stand to utilize shallow groundwater, the alfalfa cultural practices used for this study followed normal agricultural practices at UCDREC and were typical of those in the valley.
Soil samples.
The study field was divided into four border checks, each 65 feet wide and approximately 1,250 feet long. Area 80 is comprised of Glenbar clay loam, Holtville silty clay and Glenbar silty clay loam, all with “very high” water-holding capacities. These soils occur on 0.4%, 7% and 21% of Imperial Valley lands, respectively. Based on analyses of 48 soil samples taken from eight locations in the alfalfa field, we found relatively uniform clay to clay-loam soils to a depth of approximately 6 feet with montmorillonitic clay contents ranging from 40% to 60%.
Sampling locations.
Thirty-two sampling locations were established (eight per border check) to determine the soil-moisture depletion and soil salinity of the profile as well as to sample shallow groundwater. Soil samples were collected at the surface and at 6-inch intervals down to a depth of 108 inches. Moisture contents at all sampling locations and depths were determined using neutron scattering methods (Grismer et al. 1995).
Soil moisture.
Soil-moisture measurements were made prior to, and 2 or 3 days following each irrigation. Evapotranspiration losses during the short period following irrigation were obtained from a CIMIS (California Irrigation Management Information System) micrometeorological station (No. 87, located at the center of an adjacent field) and added to the difference in total soil moisture measured prior to and following the irrigation.
Soil salinity.
The CIMIS station was also used to obtain daily reference evapotranspiration (ETo) for the determination of crop coefficients. Soil salinity was measured roughly every 6 months by direct soil sampling and subsequent soil-water extraction and analysis in the laboratory. In addition, 32 10-feet-deep observation wells were installed (eight per border check) in each field. The observation wells were used to assess the water table elevation and shallow groundwater salinity and chloride concentrations.
Colorado River water (1.05 to 1.10 dS/m), supplied by the Imperial Irrigation District, was measured as it was applied to all fields. Average chloride concentrations in irrigation and groundwater during the study were 2.8 and 33.6 milliequivalents per liter (meq/L), respectively, and remained relatively constant throughout the study.
Flow rates.
The irrigation turnouts (concrete pipes connecting the irrigation supply canal to field borders) at UCDREC were calibrated to establish a pressure-head discharge relationship and then measured using the method described by Tod et al. (1991). Pressure-head losses across the irrigation turnouts were measured approximately every 30 minutes during irrigation events and converted to flow rates using gauges located on the downstream side of the turnouts.
Accounting for chloride
In addition to measurements of applied water (irrigation and rainfall) and soil-moisture depletion, we estimated the seasonal contribution of the shallow water table to alfalfa water use. We employed the chloride mass-balance method described by Wallender et al. (1979), with the exception that we accounted for the chloride concentration in the irrigation water. We determined the chloride concentration for each 12-inch-depth increment of the soil profile in the root zone (48 inches) at each of the 32 soil measurement locations.
Chloride levels in soil, water table and irrigation water were determined prior to alfalfa planting, five times during the growing season, and after leaching. Water table contributions were estimated from the mass transport of chloride from the water table to the depth increment of interest. The crop coefficient for the period between irrigations and each summer/winter season was determined by taking the ratio of the sum of applied water, rain and WTC to the accumulated evapotranspiration during the period. We also measured hay yields and quality along each border check, and for the field as a whole, to estimate the water-use efficiency of the alfalfa, but we retain our focus here on determination of the alfalfa water-use characteristics.
During the nearly 3-year period, we obtained hay yields that were slightly greater than the county average using approximately 146 inches of applied water. Though hay yield was not a primary concern in this study (as compared to actual water use and salinity accumulation), achieving satisfactory hay yields and quality is an indication that the stand was not overly stressed, which is an important factor in developing acceptable crop coefficients.
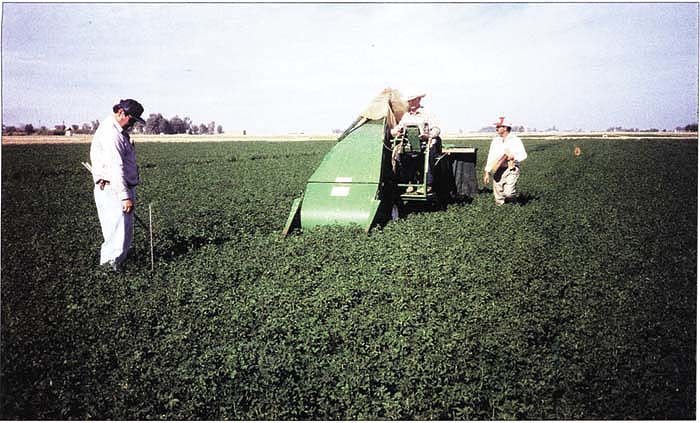
In Imperial Valley, alfalfa is grown on moderately saline, clay soils with a moderately saline water table. Alfalfa yield samples are taken at UCDREC.
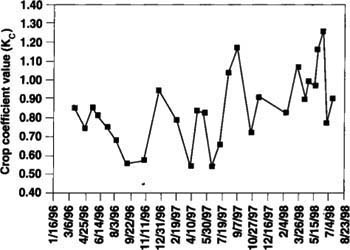
Variation in the crop coefficient is adjusted for estimated water table contributions to evapotranspiration during the study (fig. 1). The range of crop coefficient values (from approximately 0.5 to 1.3) was typical of those obtained in several southwestern states. The pattern of the variation was also similar to that estimated by Guitjens et al. (1984) for Fallon, Nev. Minimum crop coefficient values (such as, about 0.5) were obtained at the time of hay cutting and the largest values (greater than 1.0) were obtained when the stand was at its maximum leaf density.
Neglecting the water table contribution to stand water use did result in an average crop coefficient of 0.75 for the entire study period, a seemingly low value. However, we estimated a maximum WTC of 12.3 inches between November 1995 and November 1996, during which we applied 56.4 inches of irrigation water and the accumulated evapotranspiration was 79.9 inches.
Adjusting values for leaching
Similarly, the estimated WTCs between March and October 1997, was 5.3 inches when we applied 6.2 inches of irrigation water, and the accumulated evapotranspiration was 53.6 inches. Winter WTCs, between November 1996 and March 1997, and after October 1997, were slightly negative in that there was net soil leaching. We estimated WTCs incrementally at each soil depth (table 1).

Alfalfa stands are maintained for a 3- to 4-year production cycle, and harvested as hay in seven to nine cuttings per year. Two irrigations are generally recommended to establish the stand, followed by two irrigations per cutting.
It appears that the total WTC to alfalfa water use was less than 12% of the total applied water and most of this contribution occurred during the first year of the study. Therefore, estimates of the crop coefficient based on measurements of applied water and soil-moisture depletion during this period are artificially small and should be 0.86 rather than 0.68. Similarly, the average crop coefficient value during mid-year 1997 should be increased from 0.73 to 0.82.

In a 3-year study, satisfactory hay yields were achieved despite salinity accumulations at 3- to 4-foot soil depth after 1 year of production.

Adjusting these seasonal crop-coefficient values makes them more comparable to those obtained from the final year of the study when WTC declined to zero. Correcting the crop coefficient values for the WTCs to crop water use removed the increasing trend in values and resulted in an overall study crop coefficient of 0.84, a value closer, though slightly less than 0.90 suggested by Allen et al. (1998).
Fluctuating water table depth
Declining WTCs to crop water-use stem from increasing soil salinity. Though water table depth fluctuated several inches between irrigations during the study (Grismer and Bali 1998), it remained at an average depth of approximately 6 feet below ground surface from year to year.
Water-table chloride concentrations showed smaller variations. It appears that the decrease in WTC during the study was related to the increasing salinity of the lower soil profile (36 to 48 inches) to levels that were not acceptable to the alfalfa. Most of the upward water movement from the water table was limited to this lower portion of the root zone (table 1).
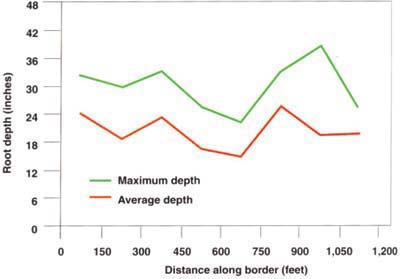
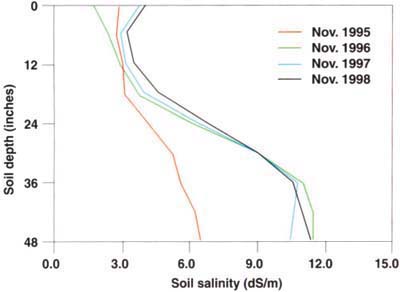
Average soil salinity changed across the profile during the study period (fig. 2). It is evident that salinity levels near the base of the profile doubled from the beginning to the end of the study because of some water table contributions. Undoubtedly, this increase in salinity to nearly 12 dS/m at depths of 3 to 4 feet exceeded the ability of the alfalfa to extract water from the deeper water table. In fact, an analysis of the alfalfa root pattern and density at the end of the study indicated that most roots were in the upper 36 inches of profile (fig. 3).
Water conservation vigilance
Competition for increasingly scarce water resources in the south-western states requires vigilant assessment of possible water-conservation strategies and water-use practices. With alfalfa consuming more than 40% of water allocation to the Imperial Valley, more detailed information under the saline field conditions common in the valley is needed to determine its water-use characteristics and improve irrigation scheduling.
In this 3-year study, we evaluated crop coefficient variation and WTCs for alfalfa-hay grown on moderately saline clay soils subject to a shallow, saline water table. We achieved satisfactory hay yields despite a salinity accumulation at the 3- to 4-foot soil depth interval after 1 year of production. The overall crop coefficient, determined without consideration of the water table contribution to crop water use, needed to be adjusted from 0.75 to 0.84 for the study period. While it is important to evaluate the shallow water-table contribution to crop water use in aggregate, we also found that it decreased to zero following salinity accumulation at depth in the root zone.
As such, alfalfa hay grown in Imperial Valley on heavy clay soils with shallow water tables may be able to decrease applied water by 5% to 10% as compared to that estimated from the product of crop coefficient (0.90) and CIMIS evapotranspiration.

The authors found that under common growing conditions in Imperial Valley, applied water may be decreased 5% to 10%, as compared to estimates based on crop coefficients and measured evapotranspiration. Irrigated alfalfa provides good habitat for birds.
Alfalfa water use pinpointed in saline, shallow water tables of Imperial Valley

