


All Issues
Perspective: Is this California agriculture's last century?
Publication Information
California Agriculture 54(4):23-25. https://doi.org/10.3733/ca.v054n04p23
Published July 01, 2000
PDF | Citation | Permissions
Abstract
Abstract Not Available – First paragraph follows: California agriculture is the most productive and efficient in the world. Yet it is slowly shrinking. According to the U.S. Department of Agriculture (USDA) 1997 Census of Agriculture,California had 27,698,779 acres of land in farms in 1997, down 4% from 28,978,997 acres in 1992. The number of farms in the state fell from 77,669 to 74,126 during that period. Also, the number of those full-time farms (receiving all income from the farm) dwindled 2% to 39,267 (USDA 1999). This trend dates back to the 1950s. Why is California's agriculture slowly disappearing?
Full text
California agriculture is the most productive and efficient in the world. Yet it is slowly shrinking. According to the U.S. Department of Agriculture (USDA) 1997 Census of Agriculture,California had 27,698,779 acres of land in farms in 1997, down 4% from 28,978,997 acres in 1992. The number of farms in the state fell from 77,669 to 74,126 during that period. Also, the number of those full-time farms (receiving all income from the farm) dwindled 2% to 39,267 (USDA 1999). This trend dates back to the 1950s. Why is California's agriculture slowly disappearing? Profits to agricultural producers are being squeezed. For an increasing number of commodities, markets prices are global, but production costs are local. With a single “world price” ceiling affecting producers of global commodities — virtually all commodities — local costs determine the profit per unit for producers dispersed across the globe. Therefore, costs determine which producers can survive, but profit margins determine who will survive in the long run (Blank 1998).

The total acreage and number of farms is steadily declining in California. At Bacchi Ranch near Lotus in the Sierra Nevada, children tend a sheep.
Global markets and prices were made possible by technological advances. As research develops new and better machines and production methods for storing, transporting and processing commodities, producers are increasingly able to supply commodities to buyers in far distant locations. In California, for example, consumers eat fruit from Chile during the winter. Many do not realize that they are eating imports, rather than the output of California's own fruit industry, because the price', appearance and quality of the Chilean fruit are about the same as local produce marketed in the summer.
Production costs will always be local because most resources are inflexible. Land, obviously, is fixed in location and productivity. Labor mobility is limited for low-paying jobs in agriculture, and the prices of inputs such as water and chemicals are dependent on local supplies. The farmer or rancher's costs per unit of production are dictated largely by the supply of and demand for resources close at hand.
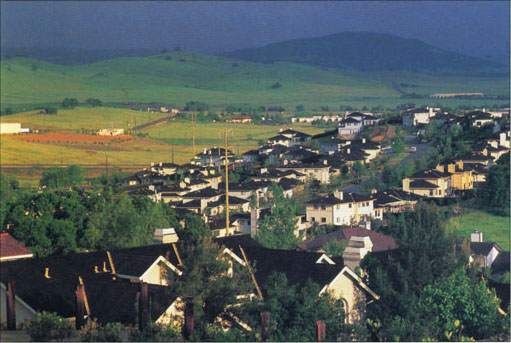
Many farmers and ranchers leave agriculture out of economic necessity. Nonagricultural uses, such as housing, are increasing the value of farmland.
At the same time, world prices for commodities, ignoring seasonality, are relatively stable or trending down in real terms. Those price trends are due to increases in total supplies made possible by technological advances as well as loosening of trade barriers under international agreements such as NAFTA and GATT. As a result, USDA's Index of Average Prices Received by Farmers in the United States decreased 7% between 1990 and 2000, meaning that output prices fell significantly when adjusted for inflation (NASS 2000).
Local input costs are rising across the United States. Land prices increase with capitalized investments in improvements and pressures from non-agricultural uses such as urban sprawl, especially on the east and west coasts. California's average value per acre of farm real estate has increased steadily since the farm crisis of the mid-1980s. California's farmland value was $2,610 per acre in 1998 compared to $593 per acre in Texas (NASS 1999). Labor prices are also being pushed up as farm jobs compete with nonfarm opportunities, which are increasingly available. The service sector and others are luring workers away from agriculture. National average wages for farmworkers increased from $6.39 per hour in 1994 to $7.47 per hour in 1998 and total wage rates paid by farmers increased 40% from 1990 to 2000 (ERS 2000). Other input prices also continue to increase. From 1990 to 2000, the national Index of Average Prices Paid by Farmers increased 19% (NASS 2000).
Efforts to improve the profit margin for commodities have focused on both prices and costs. Successful strategies to raise prices range from adding value to a commodity (such as via processing) to using strategic alliances (such as when two or more firms join forces to gain bargaining power) or the integration of producers and processors in order to increase and/or stabilize the revenues to each. Unfortunately, these strategies are not available to most producers. Therefore, farmers and ranchers have focused mostly on ways to lower costs.
Two general cost strategies have been most successful: (1) reducing cost per unit by increasing the scale of operations, and (2) reducing cost per unit with technological advances in production and harvest methods and machines, as well as developments that raise yields. The first strategy is most readily available to producers, so it is used nationally, as indicated by the steadily increasing average size of farms. When technological advances occur, early adopters reap the greatest benefits, but those advantages erode over time as other producers adopt the technology and catch up. Also, the second strategy feeds the first because technological advantages have often come with high price tags (such as for harvesters) that increase the incentive for producers to expand farm size to fully capture economies of scale with the new technology. In California, for example, the average market value of all machinery and equipment per farm grew from $56,485 in 1992 to $69,590 in 1997 (USDA 1999). Both of these cost strategies have helped to slow the cost squeeze, but they are unable to reverse it.
Faced with a world price ceiling and a steadily rising cost floor, individual U.S. farmers and ranchers are being squeezed out of one commodity after another. When one product becomes relatively unprofitable, producers are forced to look for another crop or livestock enterprise that offers better returns. Low-revenue crops, including many field crops, are being replaced by higher revenue crops, such as tree and vine crops, in the “crop portfolios” of farmers. In California, despite the decrease in total acreage in farming from 1992 to 1997, the period saw increases in vegetables (from 1,016,744 acres to 1,209,259 acres) and tree and vine crops (2,245,781 acres to 2,582,084 acres) (USDA 1997).

As a result of these individual decisions, U.S. and California agriculture are moving up the “farming food chain,” judging by the shifting acreage devoted to four general categories of crops (table 1). Movement from one category to another is virtually always in the upward direction, meaning from lower to higher value crops. High-value perennial crops, like tree and vine commodities, certainly generate more revenue per acre than low-value annual crops, like grains, but there are drawbacks to moving to higher returning crops. First, more money per acre must be invested for higher value crops. Second, that investment goes into assets that are much less flexible than those used for lower value crops. Higher returning crops are therefore much riskier.
Profits to agricultural production have been low for decades. For the past 30 years, USDA reports that nationwide, agriculture's gross profit margin has been in the 2% to 3% range (ERS 2000), on average, which is low compared with alternative investments such as putting cash in a bank savings account and so on. Also, the average real net returns to assets financed by debt has been negative every year since 1993 and was -3.8% in 1999 (ERS 2000). Although producers' efforts to shift crop portfolios and expand yields have resulted in increasing revenues, profit margins have not increased, nor are they expected to in the future in California nor the United States as global competition increases.
California's diverse agriculture makes our industry generally better off, compared to that in other regions of the country, when facing the competition. For example, the limited agricultural production alternatives in the northern and southern plains of the United States have led to farmland values that are currently below those observed in 20 years ago. However, individual growers and commodity markets in California are subject to the risks inherent in high-revenue products. Recent oversupply in almond and walnut markets and the resulting price drops are examples of how relatively profitable industries can quickly be impacted by changes in supply or demand.
For individual farmers and ranchers, profitability pressure creates the need to take on more risk such as by making long-term investments in vine or tree stock, while government policy creates the willingness to take on more risk. Farmers are moving up the farming food chain. California growers, in particular, have “upgraded” their portfolios. Likewise, the squeeze is causing producers across the country to diversify away from agriculture. As a result, USDA reported that “on average, 88% of farm operator households' income came from off-farm sources in 1998” (ERS 2000).
Ultimately, farmers and ranchers are choosing to leave agriculture out of personal economic necessity, making investment decisions to protect their family's wealth. The fact that good producers are leaving agriculture surprises many people, under the mistaken assumption that the most efficient producer will be the last to disappear. Being efficient is not sufficient for survival as a farmer or rancher. Being profitable and willing to accept agriculture's low returns on investments are necessary for long-term survival.
Global competition is a two-edged sword for the United States: it is a source of economic pressure on U.S. agriculture, but it is also our future source of raw commodities. Domestic farmers and ranchers are disadvantaged by higher production costs when trying to compete with less developed countries in many global commodity markets. Yet, those developing countries will continue to deliver food and fiber commodities to us after our own producers have left the markets.
Numerous examples exist now of how U.S. agribusiness is maintaining its prosperous outlook by seeking out the least costly sources of agricultural commodities. Companies are using strategic alliances and other methods of securing nondomestic sources for the commodities used as inputs in their processing and distribution industries. For example, half of beef served by Burger King comes from Australia. By doing so, U.S. firms guarantee domestic consumers a steady supply of food, and speed the economic development of the countries supplying us. It is part of a system of mutual dependence that will assure us of an uninterrupted supply of inexpensive food.
Faced with a world price ceiling and a steadily rising cost floor, individual U.S. farmers and ranchers are being squeezed out of one commodity after another.
California agriculture's future ability to compete with the increasing importation of commodities will depend on our agribusiness sector and our producers' progress in adopting price and cost strategies. The only sure bet is that the “food” business will take on a global perspective.
Perspective: Is this California agriculture's last century?

