


All Issues
Continuous trunk diameter recording can reveal water stress in peach trees
Publication Information
California Agriculture 53(4):21-25. https://doi.org/10.3733/ca.v053n04p21
Published July 01, 1999
PDF | Citation | Permissions
Abstract
The water status of a peach tree is traditionally monitored by measuring its predawn or midday leaf water potential or midday stem water potential. A study conducted on ‘O'Henry’ peach trees at the Kearney Agricultural Center showed that continuous monitoring of trunk diameter can also be an accurate technique of detecting water stress. The trees were evaluated during 21 days of underirrigation followed by 17 days of full irrigation. Trunk-based measurements were generally more sensitive than discrete measurements to both the onset of water stress and the magnitude of tree water deficits. Parameters based on trunk diameter monitoring correlated well with established physiological parameters of plant water status. These trunk diameter oscillations, which are only available from continuous monitoring, hold promise for improving the precision of irrigation decision making.
Full text
Most growers, researchers and irrigation consultants agree that irrigation scheduling ideally should be based on plant-derived measurements. Most if not all plant processes are influenced by plant water status, which therefore directly affects plant performance. However, the most popular irrigation scheduling methods based on crop evapotranspiration (ETc) and/or soil water monitoring assess the atmospheric and rooting environments, which may be only indirectly related to the well-being of the plant. Plant-based indicators are unpopular due to logistical problems both in obtaining measurements and in interpreting their meaning in irrigation decision making. Nevertheless, scheduling irrigation based on plant indicators appears particularly desirable in cases where water stress must be avoided at all times, such as those where expansive growth must be maximized—for example, to produce large fruit. Plant indicators of water status are also beneficial where stress is purposely imposed, such as when excessive fruit or vegetative growth reduces profit.
Conventional plant water status monitoring involves discrete, single-point measurements taken on a few trees at relatively infrequent intervals (several days). The timely detection of plant water stress depends on the stress development rate and monitoring frequency. Therefore the precision of using discrete measurements is related to how much labor and equipment is committed, which in turn is influenced by real or perceived economic benefits of the plant water assessment program.
What is needed is a device that continuously records plant water status or some aspect of plant behavior that is directly related to plant water status. To date, the usefulness of instruments that continuously monitor plant water status has been limited. When recording leaf water potential with thermo-couple psychrometers, one can encounter operational problems in the field environment. In the early 1970s, research began on measuring the slight shrinking and swelling of plant stems that occurs over the day. This work showed that stem diameter fluctuations correlated well with leaf water potential (Klepper et al. 1971). Linear variable displacement transducers (LVDTs) can continuously and accurately monitor stem diameter. Recent improvements in LVDT robustness, data acquisition systems and computer-controlled irrigation make using this instrument more feasible in irrigation management.
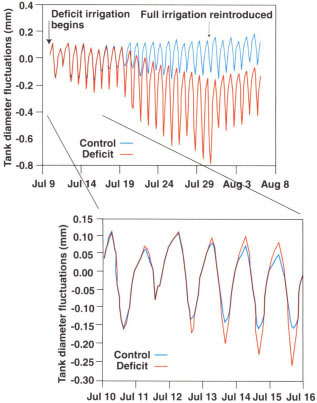
Fig. 1. Trunk diameter fluctuations during deficit irrigation, July 10–30 and after reirrigation July 31-Aug. 6. Trunk diameter was set to zero on July 10. Vertical gridlines are 12:01 A.M. values for the dates shown.
We undertook this research to observe the sensitivity of trunk-mounted LVDTs to detect changes in peach tree water status during deficit irrigation and recovery from it. Of particular interest was how well the LVDT-derived measurements signaled the onset of water stress and how they related to the conventional water potential measurements of leaves taken at predawn and midday and also the midday stem water potential.
Microsprinkler-irrigated peaches
For this study, we used a 2.8- acre experimental orchard of 8-year-old ‘O'Henry’ peach trees at the UC Kearney Agricultural Center in Parlier. The soil is a deep Hanford sandy loam. Tree spacing was 6 feet by 16 feet. The orchard was divided into two parts. One part was fully irrigated and considered as the control treatment, while the other was subjected to a deficit irrigation regime. We selected two groups of eight trees, each of similar size, for monitoring in both the full and deficit irrigated areas. All trees were hand thinned early in the season to about 260 fruit per tree.
We irrigated with microsprinklers (10 gal/hr), which were located about 18 inches from each tree. The circular wetted pattern was about 10 feet in diameter. Irrigation was applied daily with the objective of replenishing the ET losses of the previous day. Irrigation generally began at 2 A.M. and was completed in 3 hours except during the recovery phase.
The control treatment received the equivalent of reference crop water use (ETo), determined with a modified Penman equation using weather data from a nearby CIMIS station. Thus we assumed that the crop coefficient (Kc) was 1.0, which is a slight overestimation and results in ETo and ETc being equal. Plant and soil water measurements indicated that there was no water limitation in the control treatment. The experiment began with a full soil-water profile in the control trees and a partially full profile in the deficit trees. The latter was required because of the deep root zone in the orchard; we anticipated that significant changes in plant water status would occur during the approximately 3-week course of the slow imposition of deficit irrigation only if we used this approach. Therefore, 2 weeks before differential water treatments began, daily irrigation applications were decreased for 5 days in the deficit trees, from 100% to 30% of estimated ETc, followed by a resumption of 100% of ETc irrigation up to the start of the experiment.
The deficit treatment started on July 10, with the daily application of only 62% of ETc through July 17; 43% of ETc through July 18; 21% of ETc through July 28; and no irrigation on July 29–30. On July 31, 250% of ETc was applied to the deficit plot to begin the recovery phase. For the remainder of that phase, the control and deficit plots received identical irrigations.
Why does the trunk shrink and swell?
Water flow in the soil, plant and atmosphere continuum is driven by water potential gradients between each component of the system. Water moves from the soil to the roots and then up the tree in the xylem, which is considered to be bundles of hollow, dead cells. Surrounding the xylem are living cells, including cambial and phloem tissues.
There are small flow paths between these living tissues and the xylem, but the connections are limited, causing resistances to flow that vary among fruit tree species. As transpirational losses from leaves increase in the early morning hours, some water moves out of the living tissues and into the xylem in response to the water potential gradients that develop. Because the cell walls of the living tissues are flexible, this movement presumably causes the trunk to shrink. As transpiration slows in the late afternoon, the potential gradient reverses and some water flows back from the xylem to the living tissues, causing the trunks to swell.
Under deficit irrigation, transpiration during most of the day exceeds root water supply, and greater water potential gradients develop between the xylem and living tissue. The rate of water flow between these tissues then increases, causing greater trunk shrinkage. Trunk diameter fluctuations occur in response to the potential gradients within the trunk, which reflect the balance between tree water supply and demand. Therefore there should be a close association between the daily evolution of tree water status and trunk diameter oscillations, which could be used instead of the conventional plant water status measurements for irrigation management.
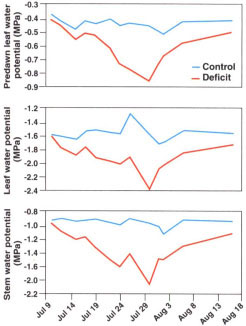
Fig. 2. Experimental data of predawn leaf water potential, midday leaf water potential and midday stem water potential with time.
Measurements were terminated on Aug. 5, which was also the harvest date.
Plant measurements
Plant water.
Predawn and midday (1 P.M. to 2 P.M.) leaf water potentials were generally taken every other day with a pressure chamber. We measured two leaves from each of the eight experimental trees in each irrigation regime. Leaf water potential was determined on fully sunlit leaves.
Measurements of stem water potential were also made at midday with the same frequency. These measurements involved covering two leaves per tree (located in the canopy and close to the trunk) with a small bag of black polyethylene covered by silver foil for at least 2 hours prior to the measurement. In all cases, leaves were placed in the chamber within seconds of excision.
Photosynthesis and fruit growth.
Photosynthesis was determined once or twice per week using a portable photosynthesis instrument. Fruit diameter on 10 tagged fruit per tree was measured with electronic calipers about every 4 days. We used a previously determined relationship between fruit diameter and volume to estimate fruit volume.
Trunk diameter.
Linear variable displacement transducers were installed about 18 inches up the trunk on the north side of each of four trees in the control and deficit plots. They were mounted on holders built of aluminum and INVAR (an alloy composed of 64% Fe and 35% Ni that has minimal thermal expansion) and covered with silver foil to prevent wetting of the device and the bark by the microsprinklers. Measurements were taken every 30 seconds and the datalogger was programmed to report 20-minute means. We determined maximum daily trunk shrinkage by taking the difference in daily maximum and minimum trunk diameter values. Throughout the experiment, the LVDTs did not have to be repositioned because the 2500 mV (2.5 mm) working range of the datalogger was not exceeded by tree growth.
Sensitivity to deficit irrigation
Trunk diameter fluctuations occurred as oscillations with a maximum at about 6:30 A.M. and minimum at about 5 P.M. Just 2 days after we imposed deficit irrigation on July 10, the oscillations in the deficit trees began to increase relative to the fully irrigated trees (fig. 1). Both maximum and minimum trunk diameters in the deficit treatment were greater than in the control treatment at the onset of stress, while the mean trunk diameter was unchanged for the first 5 or 6 days after deficit irrigation began. Although the decrease in minimum trunk diameter is consistent with the hypothesis of the additional contribution of cell water from the living tissue to the transpiration stream, the mechanism responsible for the increase in maximum trunk diameter during this initial stress period is unknown. By July 20, mean daily trunk diameters in the deficit trees began to decrease but the daily oscillations continued to increase through July 30, the final day of deficit irrigation. Within hours of rewatering the deficit treatment on July 31, the trunk diameter oscillations decreased and some slight growth occurred, as indicated by the mean daily trunk diameter.
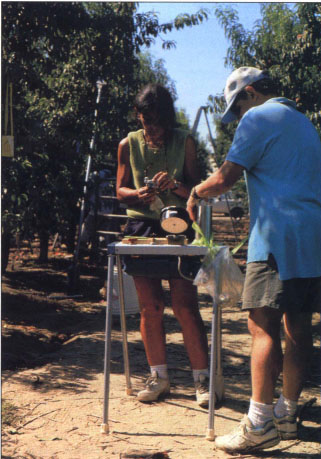
Stem water potential is measured with a pressure chamber by Merce Mata and Joan Girona.
Tree-based measurements of predawn and midday leaf water and midday stem water potential in the deficit trees also diverged from control levels soon after the onset of deficit irrigation (fig. 2). The water potential decreased with time until the July 31 rewatering. Note that even 17 days after the resumption of full irrigation, these plant-derived indicators of stress had not recovered to control levels. Soil water measurements indicated that the soil was depleted of so much moisture during the deficit irrigation period that our irrigation regime in the recovery phase was not sufficient to refill the root zone (data not shown).
Several parameters can be derived from the continuous measurements of trunk diameter, including maximum daily trunk shrinkage, defined as the difference in the maximum and minimum daily trunk diameter. These continuous measurement-derived values for the deficit treatment were calculated relative to the control (fig. 3). After just 3 days of irrigating at 62% of ETc in the deficit trees, relative maximum daily trunk shrinkage, maximum trunk diameter and minimum trunk diameter were 1.30, 1.21 and 135, respectively. These parameters reached relative peak values of 2.52, -1.11 and 7.14, respectively, just prior to re-irrigation. However, the relative minimum trunk diameter values from Aug. 4 to Aug. 7 became quite negative and are excluded from Figure 3. This is the result of the minimum trunk diameter in the control approaching zero and illustrates a shortcoming of using this relative parameter as a stress indicator. Values of both the maximum and minimum trunk diameters depend on when the trunk diameter is set to zero, which was at the beginning of the deficit irrigation in this experiment (July 10). The longer the duration after zeroing, the greater the absolute maximum and minimum trunk diameter values, thus decreasing the sensitivity of the relative (compared with a fully irrigated control) parameters. The stress history can also affect relative maximum and minimum trunk diameter comparisons. Calculating maximum daily trunk shrinkage does not require zeroing and is therefore a more straightforward indicator.
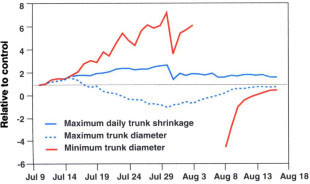
Fig. 3. Values of maximum daily trunk shrinkage, maximum daily trunk diameter and minimum daily trunk diameter for the deficit irrigation treatment expressed relative to the control with time.
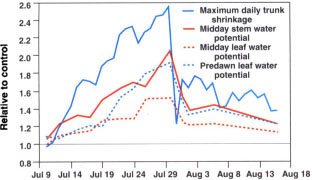
Fig. 4. Values of maximum daily trunk shrinkage, midday stem water potential, midday leaf water potential, and predawn leaf water potential for the deficit irrigation treatment, expressed relative to the control with time.
In contrast to the parameters derived from trunk diameter oscillations, it took a few more days to detect significant differences in the relative values of the discrete measurements of tree water status (fig. 4). The magnitude of the relative differences in predawn and mid-day leaf water potential and midday stem water potential were generally lower than the indicators derived from the trunk diameter fluctuations. The largest differences in relative predawn and midday leaf water potential and midday stem water potential in the deficit treatment were 1.89, 1.50, 2.03 and 0.54, respectively, and also occurred just prior to reirrigation. Following rewatering, these relative indicators did not return to unity again due to only partial refilling of the soil moisture reservoir.
Trunk shrinkage and tree stress
We found that predawn leaf water potential and maximum daily trunk shrinkage were highly correlated if the correlations were determined separately for both the deficit irrigation and recovery periods (fig. 5a). This indicates that there is a hysteresis, or stress history effect, on the relationship between predawn leaf water potential and maximum daily trunk shrinkage. Indeed, without considering the hysteresis, the overall linear relationship between predawn leaf water potential and maximum daily trunk shrinkage had a correlation coefficient (R2) of 0.738. On the other hand, separate individual linear regressions for these parameters during both deficit irrigation and recovery phases had R2s of 0.944 and 0.929, respectively.
Strong correlations after hysteresis was considered were also obtained between maximum daily trunk shrinkage and midday stem water potential (fig. 5b) and midday leaf water potential (fig. 5c). The poorest correlation between maximum daily trunk shrinkage and the discretely measured plant stress indicators was with photosynthesis (data not shown).
Implications for irrigation
Relations between maximum daily trunk shrinkage and four important processes/indicators during the deficit irrigation phase are shown in Figure 6. The slopes of those lines indicate the relative sensitivity of each to increases in maximum daily trunk shrinkage caused by water deficits. The slopes of photosynthesis and fruit volume growth rate were greater than those of the tree water status indicators (predawn leaf water potential and stem water potential). The water status measurements can be thought of as the “cause” and photosynthesis and fruit growth as the “effect.” The higher sensitivity of the affected processes versus the stress indicator illustrates the importance of considering the indicators in irrigation management in order to maximize tree performance. Also note that relative process/indicator values of 1.0 plus or minus 10% occurred with an maximum daily trunk shrinkage between 0.25 and 0.35, suggesting that this trunk shrinkage range can be considered as a “threshold.” However, such a threshold value would probably depend also on climatic factors.
Indeed, researchers proposing plant-based measurements of water status for use in irrigation management have recognized the weather-dependence of these measurements and have developed various adjustment techniques depending on air temperature, evaporative demand and so on. Continuously measured trunk diameter is presumably influenced by these same atmospheric factors. For example, on July 11, a cloudy day when evaporative demand was abnormally low, trunk diameter oscillations were much smaller in both the control and deficit trees in relation to the immediately preceding and following days (fig. 1). However, with the exception of July 11, the nearly constant evaporative demand during the relative short duration of our experiment limited such variations. Nevertheless, some type of comparison with a fully irrigated reference tree within the general area, or calibration with some aspect of evaporative demand (such as ETo), may be required to interpret maximum daily trunk shrinkage values during changing weather. Trunk diameter fluctuations in peach trees have also been reported to vary with phenological growth stage, regardless of tree water status. Moreover, trunk diameter oscillations vary widely between different tree species. More research is needed to elucidate how some of these unknown factors may affect the development of this technique for irrigation scheduling.

Fig. 5. Relationships between maximum daily trunk shrinkage and (a) predawn leaf water potential, (b) midday leaf water potential and (c) midday stem water potential during the deficit irrigation and recovery (after reirrigation) phases.
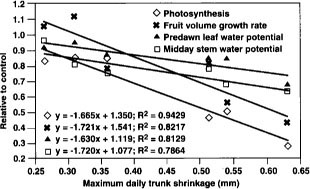
Fig. 6. Relationships between maximum daily trunk shrinkage and values of photosynthesis, fruit volume growth rate, predawn leaf water potential and midday stem water potential during the deficit irrigation phase expressed relative to the fully irrigated control.
Conclusions
Parameters derived from trunk diameter measurements obtained from continuously recording sensors correlated well with established physiological parameters related to tree water status. In general, the indicators based on trunk diameter oscillations were more sensitive than measuring stem and leaf water potential in detecting the beginning of water deficits and reflecting their magnitude during the stress period. The analysis of the continuous records offers a more dynamic picture of events related to irrigation management and therefore holds promise for increasing the precision of irrigation decision making. Moreover, because the measurements are made electronically, they are well suited for incorporation into the software of computerized irrigation controllers.
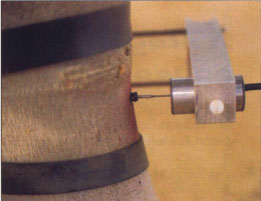
A linear variable displacement transducer (LVDT) is used to measure trunk diameter oscillations.
Continuous trunk diameter recording can reveal water stress in peach trees

