


All Issues
Water relations of lysimeter-grown peach trees are sensitive to deficit irrigation
Publication Information
California Agriculture 53(4):17-20. https://doi.org/10.3733/ca.v053n04p17
Published July 01, 1999
PDF | Citation | Permissions
Abstract
To compare peach tree water use with soil and plant water status measurements, two trees in a large weighing lysimeter were deficit irrigated with insufficient amounts of water for 3 weeks. Transpiration decreased soon after the deficit irrigation began and evaporation from the soil became relatively more important. Due to shallow, sparse rooting, high-frequency drip irrigation and high evaporative demand, allowable depletion in the wetted soil zone of the lysimeter was only 15% to 20% of available soil water. This indicates the small margin for error in managing irrigation of trees in this situation.
Full text
Irrigation is essential in virtually all San Joaquin Valley fruit and nut orchards due to minimal summer rainfall. The goal of irrigation is to meet an orchard's potential water use—also called evapotranspiration (ETc)—the sum of tree transpiration and evaporation from the soil surface. The flow of transpirational water and the uptake of carbon dioxide (CO2) are both controlled by biological valves at the leaf surfaces: the stomata. With fully opened stomata, both transpiration and CO2 assimilation reach maximum rates. Optimal irrigation ensures that sufficient soil water is available for maximum transpiration, which leads to maximum CO2 assimilation and photosynthesis. Maximum photosynthesis is usually associated with maximizing the plant's vegetative and reproductive growth.
When inadequate amounts of water are applied, plants cannot extract soil water fast enough to replenish the water lost through transpiration at the leaves. This occurs because soil moisture levels fall to the point that water flow between the bulk soil and plant roots is restricted. Such restriction ultimately results in a decrease in transpiration and photosynthesis.
The soil water content that corresponds with the “threshold” level depends on many factors, including plant type, soil texture, root zone depth and weather conditions. Identifying how much soil moisture can be extracted without affecting transpiration is important in developing both soil-based and atmospheric-based irrigation schedules. Moreover, knowing relationships between transpiration and other measures of tree water status, such as predawn leaf water potential and midday stem water potential, can help us use these measurements in water management. Finally, little information exists about the ability of fruit trees to recover from a severe water stress in terms of whole tree transpiration and leaf function.
Tree transpiration is estimated using a variety of methods, such as soil water balance, sap flow/heat pulse and atmospheric techniques that measure water vapor or energy fluxes. The most precise technique uses large containers called lysimeters, where weight loss due to ETc is recorded at frequent intervals. However, these instruments are expensive; in California, there is only one weighing lysimeter with fruit trees. At the risk of damaging these carefully grown and maintained mature peach trees, we used this lysimeter to measure the decline in transpiration while subjecting the trees to a period of increasingly severe water stress. This stress was then alleviated by refilling the soil moisture reservoir, and we observed tree recovery.
Lysimeter irrigation
This work was conducted in the summer of 1996 in an orchard of 8-year-old, late-maturing peach trees (‘O'Henry’) at the UC Kearney Agricultural Center in Parlier. The orchard occupied a field of 2.8 acres and the tree spacing was 6 by 16 feet. The soil is a deep Hanford sandy loam with a bulk density of about 1.6 g/cm3.
A large (13 by 13 by 6.5 foot) weighing lysimeter containing two trees was located near the center of the field. During construction, the lysimeter was repacked with soil to obtain bulk densities of about 1.64 g/cm3, equal to the surrounding field. It has a useable depth of about 5.5 feet. Water tanks located beneath and attached to the lysimeter are used as the water supply for the lysimeter, allowing for determination of lysimeter evapotranspiration (ETl) for all but about the 1 minute taken to refill the supply tanks per day. The lysimeter data is collected automatically and its calibrated accuracy is ± 0.001 inches/day.

Fruit growth in the lysimeter trees is measured by Merce Mata and Dan Howes.

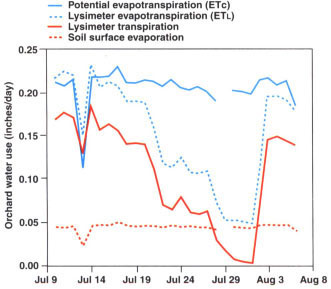
Fig. 2. Daily estimated peach water use (ETc), lysimeter evapotranspiration (ETL), lysimeter transpiration and lysimeter surface evaporation during the deficit and recovery irrigation phases.
The lysimeter was irrigated with rings of 10 drip emitters (0.5 gal/hr) around each tree. Irrigation was applied daily. Irrigation generally began at 2 A.M. and was completed in 6 hours, except during the recovery phase.
We purposely began the experiment with a partially full soil water profile in order to achieve significant changes in soil and plant water status during the approximately 3-week course of the slow imposition of deficit irrigation. In the 2 weeks preceding the experiment, we drew down soil moisture levels while carefully observing that no deviations from normal ETl and tree water status occurred.
Nine days prior to initiating the deficit irrigation, full irrigation was applied. During this period, we determined the average crop coefficient for the lysimeter trees. This was accomplished by establishing the ratio between ETl and the reference evapotranspiration (ETc), which was calculated using a modified Penman equation with data from a nearby CIMIS weather station. The mean crop coefficient was 0.826. Maximum ETl, hereafter referred to as ETc, was thus estimated as 0.826 x ETo during the deficit irrigation period.
In late June, when the lysimeter was fully irrigated, a polyethylene cover was placed on the lysimeter for 4 days to prevent surface evaporation. The difference between the crop coefficient determined for this period (0.643) and the uncovered, fully irrigated lysimeter crop coefficient (0.826) was used to estimate surface evaporation throughout the deficit irrigation and recovery phases (0.183 x ETo). The difference between ETl and surface evaporation was considered to be lysimeter transpiration.
The deficit irrigation began on July 10 with the application of the 75% ETc through July 17, 50% ETc through July 18, 25% ETc through July 28 and no irrigation on July 29-30. On July 31, 300% ETc was applied to begin the recovery phase. For the remainder of the recovery phase, the lysimeter received 120% ETc. We terminated measurements on Aug. 5 when the fruit, which had been hand thinned early in the season to about 260 fruits per tree, was harvested.
Measurements
Soil water.
We monitored soil water with both neutron probe and capacitance (EnviroSCAN, Sentek PTY Ltd., South Australia) techniques. Two tubes of each device were installed in the lysimeter on the north and south sides about 3 feet from the tree trunk. Neutron probe measurements were taken from depths of 6 to 60 inches in 6-inch increments about every other day. The neutron probe had been previously calibrated for the experimental soil, allowing the data to be reported as volumetric soil water content. Capacitance probe measurements were recorded every 15 minutes on a datalogger from the 8-, 20-, 30- and 60- inch depths. The capacitance probe data was not calibrated for the experimental soil, and the readings are reported here as EnviroSCAN values, which approximate volumetric soil water content according to the manufacturer.
Field capacity and the permanent wilting point were determined previously for the experimental soil at 1-foot-depth increments using a pressure plate apparatus. It was found that mean values of the 1/10 and 1/3 bar values best represented field capacity and were 21.0%, 21.0%, 21.3% and 20.5% expressed volumetrically for the 0-1, 1-2, 2-3 and 3-4 foot depth increments, respectively. The equivalent permanent wilting point for the same depth increments was 3.4%, 3.4%, 3.1% and 3.2% expressed on a volumetric basis, respectively.
Plant water status.
Predawn leaf water potential was generally taken every other day with a pressure chamber. Two leaves from each tree were measured. Stem water potential measurements were also made at midday (1 P.M. to 2 P.M.) with the same frequency, and involved covering two leaves per tree (located within the canopy and close to the trunk) with a small bag of black polyethylene covered by silver foil for at least 2 hours prior to the measurement.
Tree water use
Hourly patterns of ETl were bell shaped but varied over the course of the experiment (fig. 1). On July 13, three days after the onset of deficit irrigation, maximum ETl was 0.052 inches/hr and occurred at 12 noon. A week later (July 20), maximum ETl was 0.028 inches/hour at 11 A.M., a 46% reduction. Reference ETc was essentially the same on these days (0.266 and 0.261 inches/day, respectively). Tree water use differences between these 2 days began at about 8 A.M. (fig. 1). Near the end of the deficit irrigation period (July 29), maximum ETl was only 0.012 inches/hr at 10 A.M. These patterns indicate that as tree water stress increased, stomatal opening was biased toward the morning hours when evaporative demand was relatively low. This allowed the trees to assimilate the maximum amount of CO2 while minimizing water loss and maintaining their internal water status. As the day advanced, stomatal closure prevented further water loss, despite the increase in evaporative demand.
With the exception of July 11, which was cloudy and is excluded from this analysis, weather conditions throughout the experiment were relatively constant; ETc varied from 0.231 to 0.191 inches/day (fig. 2). Maximum lysimeter transpiration of 0.187 inches/day was recorded on July 12, followed by a decline to 0.004 inches/ day on July 30. Surface evaporation varied between 0.051 and 0.042 inches/day. Note that as the irrigation deficit increased, the relative importance of ETl also increased.
After the soil water profile was refilled on July 31, tree water use returned to near potential levels within 2 days. This indicates that even though the stress was severe enough to cause slight defoliation, leaf function was not permanently damaged, allowing the remaining leaf canopy to transpire at a near full rate as soon as the stress was relieved by irrigation.
Soil water extraction
Soil water extraction occurred primarily in the upper 30 inches of the lysimeter, as evidenced by the EnviroSCAN data (fig. 3). There was no change in soil water content at the 60-inch depth (data not shown). This shallow extraction was due to the high frequency of irrigation, the limited rooting nature of peach, and the compaction that occurred from repacking the soil in the lysimeter during construction, which must have limited root proliferation. Soil moisture was extracted first from the 8-inch depth; after a few days of deficit irrigation, more extraction occurred from the 20-inch depth. Oscillations in soil moisture content were the result of root uptake during the day and refilling and redistribution of the daily irrigation that took place at night. These oscillations diminished with time due to both decreased ETl and irrigation amounts.
Continuously recorded soil water content and ETl patterns did not coincide (fig. 4). Peak ETl. on July 13 was at noon, whereas minimum soil water content occurred at 5 P.M. The soil water extraction rate (the slope of the soil water content versus time line) was constant between 10 A.M. and 3 P.M. This lag in soil water extraction was presumably due to at least two factors: (1) the contribution of stored tree water to transpiration (trunk capacitance) and (2) movement and redistribution of soil water. Water losses from tree leaves are replenished both by water extracted by the roots and water from living tissue surrounding the water-conducting elements (xylem). Water moving from the living tissue into the transpiration stream is responsible for vegetative and reproductive organs actually shrinking during the day. Since there was presumably denser rooting closer to the tree trunks, soil water in that area would be extracted at a greater rate than in the vicinity of our soil water monitoring instruments, which were located some distance from the trunks. In response to the soil water potential gradients that probably developed between these zones of different rooting densities, water would move from the instrument area toward the trunk. This movement is not instantaneous, and its time dependence is probably reflected in the lag between peak values of ETL. and the measured soil water content.

Fig. 3. Capacitance probe readings at three depths in the lysimeter during the deficit irrigation phase.
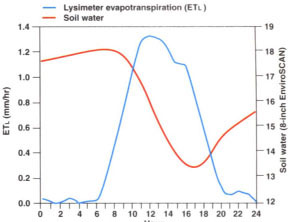
Fig. 4. Hourly lysimeter evapotranspiration (ETl) and capacitance probe soil moisture at the 8-inch depth on July 13.
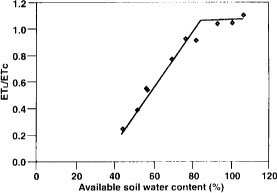
Fig. 5. Relationship between the ratio of actual (lysimeter evapotranspiration, ETl) to potential peach evapotranspiration, (ETc) tree water use during the deficit irrigation phase and available soil water content from neutron probe readings in the top 33 inches of the profile.
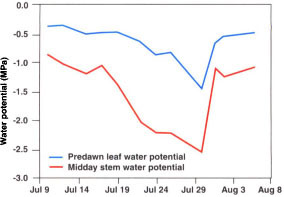
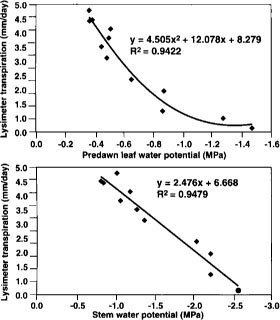
Fig. 7. Relationships between lysimeter transpiration, predawn leaf water potential and midday stem water potential.
Available soil water is usually represented as the difference between field capacity and the permanent wilting point. Since we had more extensive neutron probe measurements with depth and the instrument had been calibrated, we used neutron probe data to determine available soil water content. Figure 5 shows the relationship between available soil water content percentage (actual available water/potential available water expressed as a percentage) in the top 33 inches of the profile and relative lysimeter water use (ETl./ETc). Relative lysimeter water use began to decline at an available soil water content of 75% to 80%. Thereafter, the relative lysimeter water-use decline was linear to the lowest available soil water measured, about 45%. Therefore less than 20% of available soil moisture in the wetted soil zone could be used before transpiration decreased. This is the “allowable depletion” percentage for the soil-crop combination studied.
The allowable depletion value is situation dependent and involves evaporative demand, rooting density and depth, and soil water-holding capacity. In our situation, the shallow rooting depth resulted in rapid extraction of soil moisture adjacent to the roots. Even though there was soil water well above the permanent wilting point in the bulk soil, it didn't move fast enough to the water-absorbing roots to meet the potential water use of the tree, and the stomata began to close. We must emphasize that our situation represented a shallow, locally rooted tree that was growing under high evaporative demand and under drip irrigation. With a deeper soil and/or with full coverage irrigation—such as furrow or impact sprinkler—the rate of soil water extraction per unit soil volume would be lower, requiring a slower rate of transport between the bulk soil and the roots to meet potential ETc. Similarly, a lower evaporative demand and a soil with better transport properties would also have been better able to meet potential ETc. In these situations, the allowable depletion level would have been greater.
Since fruit and nut trees are grown on a variety of soil types, soil depths and evaporative demand conditions, these factors must be taken into account to estimate the allowable depletion level in a given situation. For example, if the peach trees in our experiment were grown under the same conditions, but with a deep rather than shallow soil, the allowable depletion would probably be 30% to 50% of the available soil water, allowing the grower to irrigate less frequently, but with higher amounts per irrigation.
Tree water status
Measurements of whole tree transpiration are not yet feasible in commercial agriculture, but they may not be necessary if there are good correlations between ETc and other parameters that we can measure, such as soil or plant water status. Both predawn leaf water potential and midday stem water potential declined soon after the onset of deficit irrigation, from values of about -0.4 and -0.9 MPa, respectively, to -1.5 and -2.6, respectively, just prior to the return to full irrigation (fig. 6). Note that within a few days of soil moisture replenishing, both tree water status parameters had returned to predeficit irrigation levels, again indicating that leaf function had not been lost.
Both predawn leaf water potential and midday stem water potential correlated well with lysimeter transpiration during the drydown phase (fig. 7). Thus either measurement can provide useful information about how well ETc is being met through irrigation.
Conclusions
Lysimeter-grown peach trees reduced their transpiration soon after a deficit irrigation treatment was imposed. Since surface evaporation became a larger percentage of lysimeter water use as the deficit increased, it may be desirable to reduce surface evaporation in deficit irrigation situations by reducing irrigation frequency, but not to the point that the allowable depletion level is exceeded. Observation of soil water extraction indicated that, even though the lysimeter had a useable depth of more than 6 feet, there was hardly any root activity below 2.5 feet. Under the shallow, sparse rooting conditions, high-frequency drip irrigation and high evaporative demand of the lysimeter trees, it would be desirable not to exceed an allowable depletion value of 15% to 20% in the wetted soil zone if maximum transpiration and productivity is sought. Our situation may not be uncommon for many California orchards, and the low allowable depletion value illustrates the small margin of error for irrigation scheduling.
Water relations of lysimeter-grown peach trees are sensitive to deficit irrigation

