


All Issues
Microsprinklers wet larger soil volume; boost almond yield, tree growth
Publication Information
California Agriculture 53(2):39-43. https://doi.org/10.3733/ca.v053n02p39
Published March 01, 1999
PDF | Citation | Permissions
Abstract
In the Arbuckle area of the Sacramento Valley, a 22-acre orchard was planted in 1990 with four almond varieties (‘Nonpareil’, ‘Butte’, ‘Carmel’ and ‘Monterey’). The orchard was irrigated with three types of microirrigation — surface drip, subsurface drip and microsprinklers. The orchard soils are 3 to 4 feet of gravelly, loamy sand overlaying a restricting clay layer. The coarse-textured soil with its low water-holding capacity allows little lateral movement of water from the microirrigation emission device. Under these soil conditions, microsprinkler-irrigated trees produced larger almond yields and showed greater tree growth. In addition, irrigation system evaluations show that all three microirrigation systems provide excellent irrigation uniformity levels after 8 years of operation with only routine maintenance.
Full text

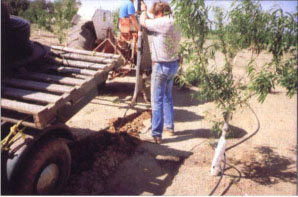
Summer weeds grow according to the wetting patterns of the microirrigation patterns. The microsprinklers in the foreground encourage more weeds than the subsurface drip in the back.
Two configurations of subsurface drip were installed 16 inches deep: a single lateral line, 2 feet from the tree row, and two lateral lines per tree row, each 4 feet from the trees.
Interest in tree crop microirrigation systems (drip and microsprinkler irrigation) continues to increase in California. Although many factors affect a grower's decision to adopt micro-irrigation, two characteristics — improved tree yield/crop quality and water application uniformity/efficiency improvements — play major roles.
The California almond industry has been progressive in its adoption of microirrigation. In the region where we conducted this study — the Sacramento Valley near Arbuckle — adoption of microirrigation has been especially widespread. In fact, irrigation systems other than microirrigation are unusual in new orchards in the Arbuckle area.
The project was undertaken to collect additional information on the response of almonds irrigated with various types of microirrigation systems.
Three types of microirrigation
In 1990, a 22-acre planting of almonds was established at the Marine Avenue section of the Nickel's Soils Laboratory near Arbuckle. The Nickel's Soils Laboratory is a trust, managed by UC, whose mission is to investigate soil, water and tree-crop issues of concern to orchardists in the Sacramento and northern San Joaquin valleys. It is typical of grower-owned orchards, with its revenue derived from the sale of its crops, predominantly almonds.
We designed the test orchard primarily to evaluate almond varieties and to compare their response to irrigation by various microirrigation systems. Four almond varieties (‘Butte’, ‘Nonpareil’, ‘Carmel’ and ‘Monterey’) were planted on ‘Lovell’ peach root-stock. All tree rows were 44 trees long, with a tree spacing of 16 feet by 22 feet. There were a total of 18 rows of ‘Butte’, 18 rows of ‘Nonpareil’, 9 rows of ‘Carmel’ and 9 rows of ‘Monterey’ almonds. The tree varieties were planted in a repeating row rotation of ‘Butte’, ‘Nonpareil’, ‘Carmel’, ‘Butte’, ‘Nonpareil’ and ‘Monterey’.
We installed three types of micro-irrigation systems — microsprinklers, surface drip irrigation and subsurface drip irrigation. The orchard was divided into 36 randomized plots, with 12 plots each of the 3 microirrigation systems. Each plot consisted of 6 rows of 11 trees (approximately 0.5 acres).
The surface drip treatments used a single drip lateral line per tree row, with four 1-gallon-per-hour (gph) pressure-compensating drippers per tree. The surface-drip-irrigation trees were established with two drippers per young tree. Two additional drippers were added at the beginning of the second year.
Two configurations of subsurface drip were installed: (1) a single lateral line, 2 feet from the tree row (4 plots), with 1-gph emitters spaced 4 feet apart; and (2) two lateral lines per tree row, each 4 feet from the tree row (8 plots), with 0.5-gph emitters spaced 4 feet apart. All subsurface drip lines were shanked-in at a depth of 16 inches, and drip tubing with in-line or integrally constructed emitters was used. The application rates (inches/hr) of the subsurface drip systems were the same as those of the surface drip system. The subsurface-drip-irrigated trees were irrigated the first season using surface-drip irrigation only (two 1-gph emitters per tree), and the subsurface drip system was installed and used for irrigation beginning the second growing season.
The microsprinkler configuration selected was a single full-circle pattern microsprinkler placed midway between trees in the tree row. At the operating pressure of 18 psi, the micro-sprinklers discharged 10 gph, with a wetted diameter of approximately 14 feet. The microsprinklers therefore did not wet the crown of the tree. The microsprinkler-irrigated trees were established by placing a microsprinkler within a few feet of the young tree. The microsprinkler was modified with the addition of a “top hat” or other device that reduced the size of the wetted area. This ensured that the soil around the young tree received adequate water and reduced water losses outside the root zone.
Separate submains were installed for the drip (surface and subsurface) systems and for the microsprinklers. A key aspect of the microirrigation system comparison was that all trees would receive the same seasonal amount of irrigation water, regardless of irrigation method. The application rate of the microsprinklers (10 gph/tree) was substantially higher than that of the drip systems (4 gph/tree), necessitating different irrigation schedules. Therefore separate submains were required.
The irrigation water for the Nickel's Soils Laboratory is supplied by the U.S. Bureau of Reclamation Central Valley Project via a local irrigation district. It is delivered to the orchard by pipeline, from which it is pressurized as needed. Standard sand media filtration was used at the pump head, with secondary screen filters placed in the orchard. Routine irrigation system maintenance included periodic chlorination and flushing on approximately a monthly basis during the growing season.
Irrigation amounts were determined through use of evapotranspiration (ET) estimates from a nearby California Irrigation Management Information System (CIMIS) station in Colusa. Before the orchard canopy reached full coverage, orchard water use was estimated by reducing full crop ET based on percentage of orchard cover (University of California 1989). ET estimates were confirmed using a variety of soil moisture monitoring devices, including tensiometers, gypsum blocks, a neutron probe and a time domain reflectometry (TDR) device. There was no summer cover crop in the orchard, and weeds were controlled by strip spraying the tree row with herbicides and mowing between tree rows. During midsummer (peak ET periods), the drip systems were operated daily and the microsprinklers were operated about once every 3 days.
Irrigation system performance
We have monitored irrigation system performance in the Marine Avenue orchard since its establishment. The irrigation systems were designed to be very uniform; all like emitters (drippers or microsprinklers) in the orchard discharge water at very nearly the same rate. The irrigation uniformity is quantified using emission uniformity (EU — %) where: Emission Uniformity (EU-%) = Average distribution of the low 25% of emitters sampled/Average discharge rate of all emitters sampled x 100
At an emission uniformity of 100%, all emitters (for example, all drip emitters) discharge water at the same rate. An emission uniformity greater than 90% is considered excellent. From 1993 to 1995, with support from the California Energy Commission, the discharge rates of over 500 drip emitters and nearly 600 microsprinklers were measured yearly to develop irrigation uniformity measures (table 1) (Schwankl et al. 1996). After 5 years of operation with only routine maintenance, the operation performance of the systems was excellent. Subsequent irrigation evaluations in 1996 and 1997 indicated that the emission uniformities remained excellent.
Irrigation evaluations on subsurface drip systems are extremely difficult. It is not feasible to excavate emitters for discharge measurement; therefore, we did not attempt to measure subsurface drip emission uniformity. As an alternative, small totalizing flow meters were permanently installed on selected subsurface drip laterals to monitor flow rate along the entire lateral length. Constant flow rate, at a constant operating pressure, indicates no significant clogging or leaking in the lateral line. In 1995, every subsurface drip lateral was monitored using portable flow meters because of concern about root intrusion. Using lateral line discharge measurements, excavations to inspect emitters, and observation of surface wetting, it was determined that root intrusion had not yet become a problem and that the subsurface drip lines were operating well.
It is desirable under subsurface drip irrigation to keep the orchard floor dry for weed control, orchard traffic and harvest considerations. Even though the subsurface drip lateral lines were 16 inches deep at the test orchard, water was still “surfacing” — wetting the soil surface above the emitters. This surfacing occurs as water rises through soil disturbed by shanking-in the drip tubing.
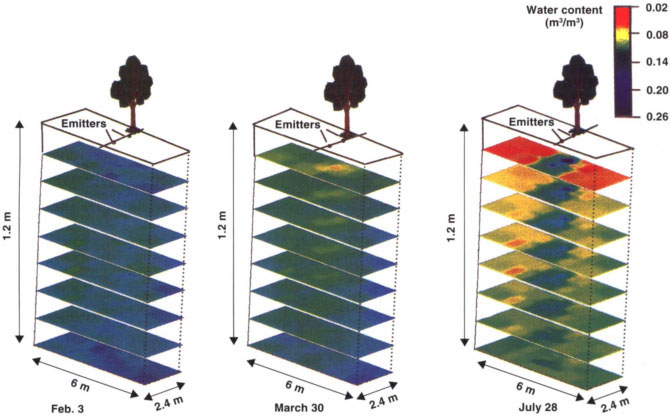
Fig. 1. Soil moisture distribution around an almond tree for 3 days in 1995: Feb. 3, soil moisture profile refilled by winter rains; March 30, soil moisture profile just before beginning irrigations; and July 28, soil moisture profile typical of that under surface drip irrigation during the growing season.
Evaporation from the wet soil surface occurs under all the micro-irrigation systems evaluated, but it is difficult to ascertain what portion of this evaporation is “lost” and what portion contributes to tree evapotranspiration. Evaporation under micro-sprinkler irrigation, particularly in a young orchard where the tree canopy is not fully developed, is probably greater compared to the drip and subsurface drip systems, due to both the larger wetted soil area and the spray losses during irrigation. A micro-sprinkler evaluation/soil moisture monitoring experiment was conducted as part of this trial (Koumanov et al. 1997), with the conclusion that there were evaporative losses that could be reduced by irrigating during the night and morning hours. Because of their higher application rate designs, most microsprinkler systems can be operated to avoid the afternoon hours, when evaporative losses are highest. In addition, avoiding afternoon irrigation periods takes advantage of off-peak power rates, substantially reducing pumping costs.
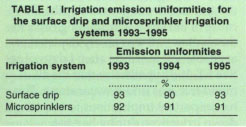
TABLE 1. Irrigation emission uniformities for the surface drip and microsprinkler irrigation systems 1993-1995
Almond tree performance
To determine the response of the different almond varieties to the various microirrigation systems, both mean trunk diameter (measured at 1 foot above the ground surface) and almond yield were measured.
Mean trunk cross-sectional area.
Mean trunk cross-sectional areas for 1994 through 1997 were compared by irrigation treatment for each of the almond varieties (table 2). The statistical comparison was done by almond variety for each year independently. Statistical significance was tested for a comparison between means at the 5% level. The microsprinkler-irrigated trees generally had a larger mean trunk cross-sectional area than did the surface or subsurface drip-irrigated trees.
Almond nut yield.
The statistical comparison of 1994 through 1997 yields was done by variety, with significance tested at the 5% level. No statistical comparison was done between varieties. Except for 1995, yields were generally higher for the micro-sprinkler-irrigated trees (table 3). 1995 was a difficult year for comparison because it was a poor almond season for much of California due to late winter rains during bloom. Because of variability between plot yields, the yield differences were not always statistically significant at the 5% level, but there was a definite trend toward increased yield with microsprinkler irrigation.
We have investigated a number of issues to explain the difference in yield between microirrigation methods. Since the amount of seasonal applied water was equal between all the microirrigation systems, the better microsprinkler-irrigated almond tree response is probably related to the wetted area of the microirrigation systems and the soil conditions at the orchard. The soil in the orchard is an Arbuckle series and is characterized by 2 to 4 feet of gravelly, loamy sand overlaying a restricting clay layer. The gravel content of the upper layer is high, often greater than 20%. Consequently, the soil is shallow, with a low water-holding capacity. In addition, because of its coarse texture, lateral water movement in the soil is limited.
Backhoe investigations at the end of the 1994 and 1995 seasons indicated a distinct difference in rooting patterns between the drip-irrigated and microsprinkler-irrigated trees. The drip irrigation systems wetted the soil within a zone 3 to 4 feet wide centered on the drip lateral line. The microsprinklers wetted a larger soil volume, slightly larger than the 14-foot throw diameter of the microsprinkler.
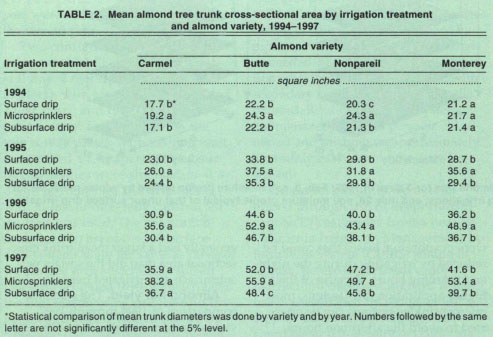
TABLE 2. Mean almond tree trunk cross-sectional area by irrigation treatment and almond variety, 1994-1997

Soil moisture distribution
To further investigate the wetted volume of soil under surface drip irrigation, we conducted detailed soil moisture monitoring using tensiometers and neutron probe measurements (Andreu et al. 1997). Figure 1 shows the soil moisture distribution on 3 representative days during 1995.
The Feb. 3 soil moisture distribution is typical of the soil profile fully recharged by winter rains. Average annual precipitation in this area is approximately 15 inches. Due to the restricting layer at approximately 4 feet (1.2 meters) deep, the soil moisture was actually higher at that depth, indicating poor drainage.
The March 30 soil moisture distribution represents the soil moisture just before the beginning of the seasonal irrigations. The soil moisture at the lower depths was still quite high, but water uptake by the tree was apparent at the shallower depths. This is a typical pattern for many tree crops; soil moisture is withdrawn preferentially from the shallower depths, closer to the tree.
The July 28 soil moisture distribution is representative of that during the irrigation season. Soil moisture was high in a 4-foot-wide strip along the drip lateral line, but the soil moisture outside this zone had been depleted. The dried soil volume had not been rewetted because of the limited capacity of the soil to move water laterally.
It is evident from figure 1 that active roots take up water across the orchard floor in the spring. As the season progresses, the zone outside the wetted volume of the drip system dries because of evapotranspiration, and roots in the moisture-depleted zone become inactive or die.
To further investigate root water uptake, we collected soil moisture measurements for 4 days following a drip-irrigation event in 1995 (fig. 2). The tree initially withdrew soil water from zones close to the tree, especially at shallow depths. As that soil moisture was depleted, the tree withdrew water from zones farther away from the tree and from deeper depths. Because of the low water-holding capacity, the shallow soil was nearly depleted of available soil moisture after 4 days of active ET. We hypothesize that the almond tree was under water stress. This has important implications for shutting down irrigations during harvest.
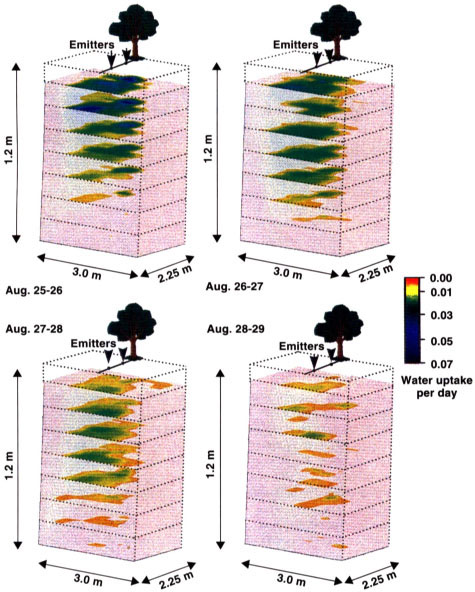
Fig. 2. Water uptake for 4 days in 1995 following a drip irrigation. Aug. 25-26 (day 1) shows water uptake primarily from the zones close to the tree. Aug. 26-27 (day 2) indicates water uptake moving to zones farther from the tree as the closer zones become depleted. Aug. 27-28 (day 3) indicates decreased water uptake throughout the profile, but occurring at deeper depths and farther from the tree. Aug. 28-29 (day 4) shows significantly decreased water uptake around the tree as soil moisture is depleted throughout most of the soil profile.
Harvest, which occurs in late August and September, is a time when tree water demands can still be quite high, but irrigation and harvest activities may conflict with each other. Experience has shown that irrigations need to be applied in this orchard during harvest to minimize tree water stress and defoliation. Irrigation while almonds are on the ground and before nut pickup was easier with the drip systems — both surface and subsurface drip — than with the microsprinkler systems. Microsprinklers needed to be operated at much reduced pressure to limit the wetted diameter and keep the nuts dry.
Under the soil conditions at Marine Avenue, shallow soils with a low water-holding capacity and little lateral wetting capability, there appears to be an advantage to wetting a larger volume of soil, as with microsprinklers. Under more favorable soil conditions, where soils are deeper, hold more available water, and promote more lateral wetting, this advantage may not occur. If surface drip irrigation were to be used under soil conditions similar to those of the test orchard, it could be advantageous to use a double lateral line drip system (a lateral on either side of the tree row) to wet a larger soil volume.
Microsprinklers show advantage
Results from multiple years of monitoring an almond orchard, planted in a shallow, low-waterholding-capacity soil with little lateral wetting capability, and irrigated with various microirrigation systems, showed an advantage to irrigating with microsprinklers. For the four almond varieties investigated (‘Butte’, ‘Nonpareil’, ‘Monterey’ and ‘Carmel’), both mean trunk diameter and almond yield were generally greater when irrigated with microsprinklers as compared to those irrigated with surface drip or subsurface drip.
With only routine maintenance, irrigation system performance for all three microirrigation systems, measured by emission uniformity, has remained excellent for the 8 years since installation.
Microsprinklers wet larger soil volume; boost almond yield, tree growth

