


All Issues
Farmers adopt new irrigation and fertilizer techniques: Changes could help growers maintain yields, protect water quality
Publication Information
California Agriculture 53(1):24-31. https://doi.org/10.3733/ca.v053n01p24
Published January 01, 1999
PDF | Citation | Permissions
Abstract
During January and February 1997, farmers in 42 California counties were surveyed about irrigation and nutrient management techniques for individual crops during the 1986 and 1996 growing years. More than 800 responses were analyzed to identify trends in these management areas and relate the rates of change. The responses indicate that the acreage irrigated with gravity systems decreased 11% over the 10-year period while the use of microirrigation systems increased 12%. Our assessment of the rate of change agrees with an analysis of previous irrigation surveys. The percentage of growers utilizing nitrogen management techniques such as fertigation, foliar applications, soil analysis and plant-tissue testing has increased in the last decade throughout much of the state and on most crop types. Farms that changed their irrigation systems adopted new nutrient management techniques at a more rapid rate than farms that did not change their irrigation system, showing that these two management spheres are intertwined. Despite the adoption of “more-efficient” nitrogen management techniques, in most cases (57%) farmers are applying the same amount of nitrogen fertilizer to their fields or even more nitrogen fertilizer (24%) than a decade ago.
Full text
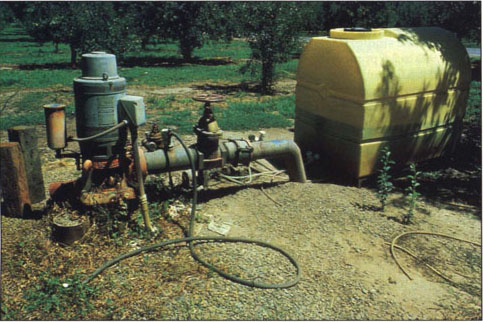
Nearly 40% of California growers apply nutrients in conjunction with their irrigation water, a process referred to as fertigation. Growers may also apply various pesticides through these systems.

Installation of microirrigation systems has been most common in orchards and vineyards. Their use has increased in all regions of the state, most prominently in the North and Central Coast areas.
Californians desire efficient agricultural use of natural resources for producing high crop yields with minimal environmental impacts. Agricultural water use is scrutinized because it represents a large percentage of the water used in California. Water-quality degradation through nonpoint-source pollution from agricultural chemicals is also a concern.
Several fertilizer management practices such as split applications, soil and plant analyses and fertigation are available to promote high crop yields and minimize water-quality degradation. However, the overall effectiveness of these practices is strongly linked to the irrigation technology and management practices employed by the growers. Technological advances such as microirrigation systems provide the opportunity for combined water and fertilizer management to achieve the dual goals of high yield and low water-quality degradation.
We administered a survey in January and February 1997 to determine transitions in irrigation and nitrogen fertilizer management techniques in California. Quantitative, current and geographically extensive data are not available. This survey was unique because it directly asked growers about irrigation and nitrogen management techniques from two distinct points in time, a decade apart, to characterize real changes in management and allow us to relate the changes to each other.
The survey's target audience was growers of irrigated field, vegetable, tree and vine crops. Nurseries, confined animal production facilities, rice growers and some other forms of agriculture were not surveyed because they either do not fertilize, cannot change their techniques (i.e., rice and flood irrigation) or do not occupy large amounts of acreage in the state.
We asked farmers to identify, by crop, the acreage in 1986 and 1996 under four classes of irrigation methods — microirrigation, surface, sprinkler and combination. If their irrigation method didn't change over the decade, we asked them to identify other management adjustments adopted. Then we asked a short series of questions about their nitrogen fertilization techniques for each crop grown in 1986 and 1996:
- ■
Times that commercial N fertilizer was surface applied?
- ■
Number of foliar N applications?
- ■
Fertilize through a water system?
- ■
Cover crops during off season?
- ■
Soil test for nitrogen?
- ■
Plant tissue analysis for nitrogen?
- ■
Organic amendments (i.e., manures, compost, manure water, biosolids)?
- ■
Total lbs. commercial actual N/ac?
- ■
Are there other ways in which your fertilization methods have changed that are not covered in the questions listed above?
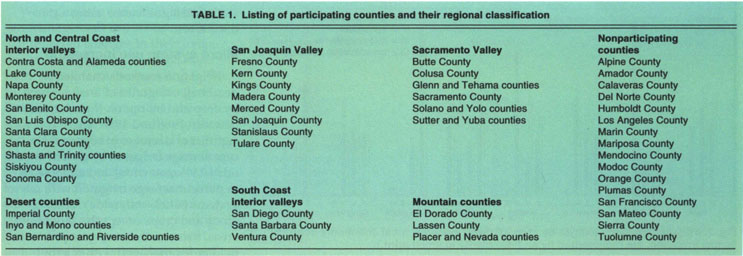
Many individuals in the UC Cooperative Extension (UCCE) system generously assisted in the selection of 42 of California's 58 counties for the survey and provided grower mailing lists. Due to UCCE's method of cross-listing farm advisors in counties or delegating responsibility for two counties to one office, the participating counties were eventually examined as 34 separate units and subsequently categorized by region (table 1).
We randomly mailed 7,635 surveys to growers, usually with a cover letter from the appropriate UCCE county director or farm advisor; if no such letter could be obtained, our office generated the cover letter. The cover letter described the purpose and potential use of the survey as a guidance tool for the UCCE county offices and noted UCCE and California Farm Bureau Federation support for the project. We received 833 usable completed surveys, for an 11% response rate. This response rate was disappointingly low, but was in line with the predictions offered by most of the farm advisors we collaborated with on the project.
The data was organized by crop and region for analysis. The crop categories, taken from the 1997 California Agricultural Resource Directory, included nut crops, citrus fruits, non-citrus fruits (apples, peaches, berries, etc.), grapes, vegetables and field crops. The orchard categories (nut, citrus and noncitrus fruit trees) were compiled so we could examine the data for tree crops as one unit. Grapes were examined as a separate unit to explore differences in management between vineyards and orchards and also because we received a large number of responses from grape growers (> 40% of all noncitrus fruit responses, table 2).
Regional categories were created from the April 1986 California Department of Water Resources Bulletin 113–4 using appendix F (index to agro-climate stations) and appendix G (evaporation pan data). Counties were placed into categories based on classification in the agroclimate station map and comparison of their evaporation pan data during the summer months.


Fig. 1. Irrigation method changes by crop. (Gravity systems, most commonly flood or furrow irrigation, are represented by an F for clarity in small print.)

Fig. 2. Irrigation method changes by region. (Gravity systems, most commonly flood or furrow irrigation, are represented by an F for clarity in small print.)


Fig. 4. Use of nitrogen management techniques of all farms statewide compared to farms that changed irrigation methods.
Acreage was summed by region and crop for the analyses. Answers to the nitrogen-management questions were also summed with those of the question “Times that commercial N fertilizer was surface applied?” being calculated as a Likert scale with 0 = zero applications and 6 = more than five applications. Percentages were calculated for each question by crop type, region and overall state numbers. The differences in percentages for 1986 and 1996 were examined for statistical significance using a standard Z test.
Micro system use increasing
Irrigation methods changed in nearly all categories of analysis both by crop and by region (figs. 1 and 2) between 1986 and 1996. There was a significant decrease in reported percent acreage irrigated by gravity methods (-11% statewide) and an increase in percent acreage irrigated with micro systems (+12% statewide) for all regions and crops except the Mountain areas. Because the acreage reported for field crops managed with micro-irrigation systems was low (0 acres in 1986 and 180 acres in 1996), these results should be interpreted with caution.
At the statewide level there was a small (2%) yet significant decrease in the acreage irrigated with sprinklers. This decrease was found in all regions except the San Joaquin Valley and Mountain counties. The statewide trend is due to the large decrease in sprinkler acreage reported in the North and Central Coast interior valley region and the Desert areas, where micro irrigation systems have been adopted more rapidly than in the San Joaquin and Mountain regions. This change is particularly interesting since the San Joaquin Valley region accounted for 54% of the reported production acreage in 1986 and 50% in 1996 and thus had a large influence on the statewide numbers.
Nitrogen management changes
Trends from the nitrogen-management portion of the survey were more complicated. At the statewide level, we found a strong trend away from only one surface application. Significant increases in the acreage managed without a surface application or with multiple (and presumably smaller) applications were identified (fig. 3). This corresponds with the observed trend toward adopting other methods for supplying nitrogen to crops. There was a significant increase in the percentage of farmers who managed their crops with foliar nitrogen applications, fertigation, soil and plant-tissue testing, cover crops and organic amendments (fig. 4).
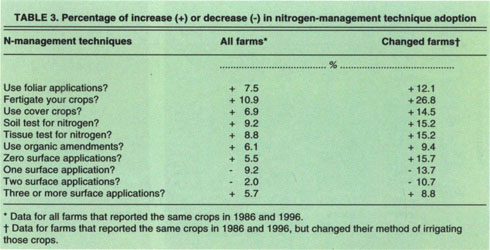
We separately examined the nitrogen-management questions for farms that reported changes in their irrigation method (fig. 4). All of the differences (for all farms responding to the survey and for those that changed their irrigation technique) at the statewide level were statistically significant at the 99% confidence level. However, the percentage change between these two categories of farms is quite different. For all questions, farms that changed their irrigation system showed a greater percentage adoption of the nitrogen management techniques than farms that did not have an irrigation-management change (table 3). The adoption of nitrogen management methods was most prominent in the North and Central Coast interior valleys, the San Joaquin Valley, and for nut, grape and vegetable crops.
In the final nitrogen fertilizer management question, we asked growers to identify the total pounds of commercial actual N/acre applied to their crops. We then took the usable responses and classified them as (1) increased amount, (2) decreased amount, or (3) no change in amount (figs. 5 and 6). In the majority of cases (57% of growers statewide) the total amount of nitrogen being applied remained the same. The percentage of growers who increased the total amount of nitrogen applied (24%) was greater that those who decreased amounts in all analytical categories except for the Desert region and for citrus and noncitrus fruit crops. These categories reported a statewide decrease in the total amount of nitrogen applied (19% of growers statewide). The Mountain region and the grape growers reported equal numbers of farmers who increased and decreased their total applications.
Potential biases analyzed
Due to the relatively low response rate, we analyzed the data to identify potential biases. First, we checked our responses to ensure that the percentage of return was not influenced by region. We found that five of the six regions had a 10% to 12% response rate. (The response rate for the Desert region was 7%.) Yet the regions had different reported rates of irrigation and nutrient-management technique change. Thus there was no bias in the number of returns by region and no correlation between the percent return and the percent reporting management changes.
We also checked the size (by acreage) of the 1996 responding farms against the California Department of Food and Agriculture's (CDFA) Agricultural Production and Export Statistics for 1995. The percentage of smallest farms (1 to 49 acres) that responded to our survey was below CDFA estimates by 14.2%. The percentages in the other CDFA categories were close (fig. 7) to our responses in each category (0.9% to 5.2% higher). Thus the responses were not greatly biased by farm size.
Finally, we compared our data with data from irrigation surveys compiled and examined in a May-June 1997 California Agriculture article (Edinger-Marshall and Letey 1997). Examining the data for the two surveys closest to ours, the 1988 Bureau of Census (BOC) survey and the 1995 Natural Resources Conservation Service (NRCS) survey, we found that the annual percent change for our survey was in close agreement. Our survey showed a 1% annual decrease in acreage irrigated with gravity systems, while the other two surveys found a 1.4% annual decrease. The microirrigation systems showed a 1.2% annual increase in acreage both in our survey and the NRCS and BOC data, demonstrating that our survey captured the same trend. These factors lead us to believe that a representative sample of California growers responded to our survey. It is important to note that the purpose of our survey was to capture the trend of irrigation management change in one sampling in order to verify the previous analysis. With this trend verified, we feel that the trends in nitrogen management represented here are also valid and the apparent relationship between adoption of nitrogen best-management practices and the installation of a new irrigation system may be confirmed.
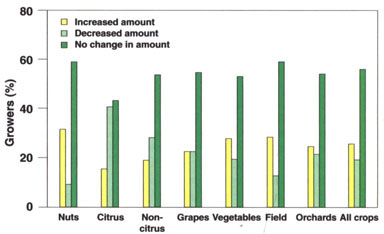


Fig. 7. Size of farms reported in 1995 compared to 1996. 1995 figures from California Department of Food and Agriculture. 1996 figures from this study.
Shift in irrigation systems
The shift away from gravity systems to pressurized microirrigation or sprinklers is consistent with the results of other surveys. Pressurized irrigation systems provide farmers with greater control over the amount of water applied and, for properly designed and managed systems, better uniformity of irrigation than gravity systems. The survey's results regarding irrigation must be considered positive.
The trend toward adoption of nitrogen fertilization best-management practices such as soil testing, plant-tissue testing and multiple fertilizer applications is also a positive finding. However, adoption of better irrigation systems and improved nitrogen management practices have not translated into overall reductions in nitrogen applied.
We can only speculate on the reasons that the majority of growers applied as much or more nitrogen in 1996 as they did in 1986. Possibly, improvements in irrigation systems have resulted in increased yields, which require higher nitrogen inputs to meet crop needs. One farmer growing a nut crop specified that the increase in applied nitrogen between 1986 and 1996 was because the trees had grown.
Research and extension activities to address shifts in fertilizer application, which should accompany a change in irrigation technique, may be lacking. In other words, in the absence of new information, the farmer relies on previous fertilizer application guidelines, despite a shift in irrigation systems. It is equally possible that the grower may be comfortable with current nitrogen application rates and may be unwilling to change for fear of risking a loss in yield or quality and thus economic return.
The survey instrument allowed farmers to offer a message they would like the nonfarming community to understand. The most common message was that farmers are well aware of and concerned about environmental quality. Respondents pointed out that water and fertilizer are costly and that it would be economically unsound for them to apply more than necessary to get a good yield. The results of this survey suggests that farmers are voluntarily taking a number of steps to improve management. However, the apparent stability in amounts of nitrogen applied requires further investigation before it can be properly interpreted.
Farmers adopt new irrigation and fertilizer techniques: Changes could help growers maintain yields, protect water quality

