


All Issues
Water turbulence disrupts accuracy of some flow meters
Publication Information
California Agriculture 52(1):25-30. https://doi.org/10.3733/ca.v052n01p25
Published January 01, 1998
PDF | Citation | Permissions
Abstract
Flow meters were tested under a variety of conditions to determine potential errors in flow rate measurements due to excessive turbulence in the water. Results showed that propeller meters, the Hall meter and the Collins meter were not particularly sensitive to turbulence caused by elbows, while paddle-wheel meters and velocity gauges were sensitive to turbulence. Relatively large errors occurred for all meters under turbulence caused by a partially closed butterfly valve. Inserting six straightening vanes greatly reduced the error caused by partially closed valves.
Full text

Growers depend on flow meters to measure the amount of irrigation water being applied to crop. If meter readings are inaccurate, some of the precious resource may be wasted.
As water resource become more scarce and competition for them increases, using flow meters to measure the amount of irrigation water applied to a crop field is becoming more common. The flow of irrigation water in pipelines is measured with a variety of devices and is often done under less-than-ideal flow conditions, particularly where a flow measurement device is retrofitted into an existing agricultural pumping plant.
Flow meter manufacturers generally suggest installing an 8-to-10-pipe-diameter section of straight pipe (length is always relative to the diameter of the pipe) upstream of the flow meter and a 2-pipe-diameter length of straight pipe downstream. Over time, this rule of thumb has been generally accepted without a clear understanding of its origin or the impact on flow measurement devices of upstream flow conditions. The origin of this rule of thumb is difficult to determine, but the 1935 standards of the Joint American Gas Association–American Society of Mechanical Engineers Committee on Orifice Coefficients and subsequent work seem to form the basis for it.
Pumps used for irrigation systems are rarely installed with sufficient straight pipe upstream of the flow meter. Little information appears to exist on the possible error resulting from a nonideal flow condition. This project was conducted to assess the error in flow rate measurements of flow meters used in agricultural applications under a variety of nonoptimal upstream flow conditions.
Flow rate measurement
Flow rates were measured with eight different flow meters at distances of 2-, 5-, 10- and 15-pipe diameters downstream from a source of excessive turbulence in the water. Measurements were made in an 8-inch Schedule 40 PVC pipe. The flow meter measurement was compared to flow rate measurements obtained with a volumetric tank, where water flowing though the pipe containing the flow meter discharged into the volumetric tank. Each test consisted of making two tank measurements by filling the tank, draining it and then refilling it. The flow meter reading was compared with the average of the two tank measurements. The percent error was calculated as
RE = 100(Meter - Tank)/Tank
where RE = error, Meter = flow meter reading, and Tank = volumetric tank measurement. Flow rates ranged between about 400 gallons per minute (gpm) and nearly 1,300 gpm.
Water velocity profiles across the horizontal pipe diameter were measured with a pitot tube to characterize the turbulence patterns for each condition. Measurements were and every half inch across the diameter.
We used eight flow meters for this experiment. However, in this article, we discuss the results of only four of the meters — a propeller flow meter, a paddlewheel meter, a Collins pitot meter and a hall pitot meter. The propeller meter was a strap-on saddle meter installed by cutting a hole in the pipe, inserting the propeller into the hole and strapping the meter onto the pipe. The paddle-wheel meter consisted of a paddle wheel mounted at the end of a metal stem and inserted 1.5 inches into the top of the pipe. The Hall and Collins meters measured the flow rate across the horizontal diameter of the pipe.


The propeller meter, Hall meter and Collins meter were classified as velocity-integrating meters because they responded to some type of integration of the water velocity across the pipe cross-sectional area. The paddle-wheel meter was classified as a point-velocity meter because its flow rate readings were based on the water velocity at a point within the pipe cross-sectional area.
There were nine flow conditions studied in this project:
-
Control. Flow rate measurements were made at 9- and 22-pipe-diameter distances downstream from a 90- degree elbow.
-
Check valve. This disk type valve was installed in such a way that the disk was at the top of the pipe during water flow.
-
Partially closed butterfly valve. The stem of the valve deviated 10 degrees from the vertical. This was necessary because the valve stem extended beyond the bottom of the valve and therefore the test pipe. The test section could not be raised to accommodate this extension.
-
90-degree elbow. The elbow was installed with the bend in the horizontal plane.
-
Butterfly valve and elbow. The 90-degree elbow was installed immediately upstream from the partially closed valve.
-
Single vane and butterfly valve. A straightening vane was installed immediately downstream from a partially closed butterfly valve.
-
Six vanes and butterfly valve. The straightening vanes were inserted 1-pipe diameter downstream from a partially closed butterfly valve.
-
Six vanes and elbows. The straightening vanes were inserted 1-pipe diameter downstream from a 90-degree elbow.
-
Six vanes, butterfly valve and elbow. The straightening vanes were inserted 1-pipe diameter downstream from a 90-degree elbow and a partially closed butterfly valve.
Tank measurements
The difference between the individual flow rate measurements and the average flow rate (average of the two volumetric tank measurements) was less than 1% for 81% of the volumetric tank measurements and less than 1.25% for 91% of the individual measurements. The maximum difference was 3.6%. The percent difference decreased as the average flow rate increased. The standard error of the mean of the two measurements was 4.7 gallons per minute.
Control condition
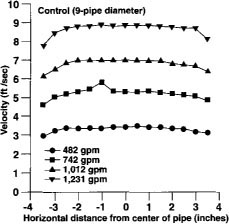
Figure 1 shows the water velocity profiles across the pipe diameter at 9-pipe diameters to be uniform until the pipe wall was approached. As would be expected, smaller velocities occurred adjacent to the pipe wall. Similar behavior occurred at 22-pipe diameters.
Average errors under the control condition were 1.6% for the propeller meter, 1.2% for the paddle-wheel meter, -0.9% for the Hall meter and 0.5% for the Collins meter. The average control error for the propeller meter was statistically different from zero at a level of significance of 0.05 because of the small standard deviation. The average control errors of the Hall and Collins meters and the paddle-wheel meter were not statistically different from zero.
We used the control errors to help interpret the results of the tests made under the various conditions. Turbulence was assumed to have little effect on the flow meter reading when the actual error was about equal to the average control error. Where a sufficient number of tests existed for a particular condition, the errors were statistically compared with the control errors.
Check valve
At 2-pipe diameters, larger water velocities occurred near the edges of the pipe for all flow rates except for the smallest (fig. 2). At 5- and 10-pipe diameters (not Shown), velocity profiles were similar to the control profiles.
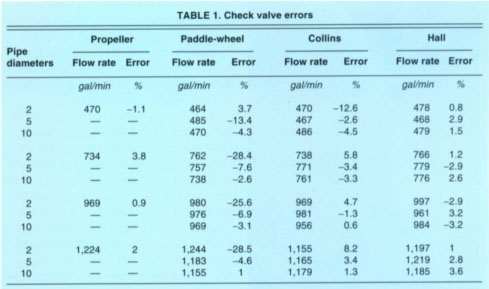
Errors similar to the average control error generally occurred for the propeller and Hall meter (table 1). Little or no trend in error occurred with increasing downstream distance for the propeller meter. For the Collins meter, larger errors occurred at 2-pipe diameters for each flow rate compared with the other downstream distances.
Average errors were calculated for each flow meter at each downstream distance since no trend with flow rate appeared to exist in the error data. Differences between these average errors and the control errors were statistically significant at all downstream distances for the paddle-wheel meter. Differences were not statistically significant for the propeller meter, the Hall meter and the Collins meter.
These results indicate that the velocity-integrating meters were not adversely affected by the turbulence caused by the check valve. The point- velocity meter, however, would be affected by the turbulence, depending on the location of the meter's sensor with respect to the water velocity profile.
Partially closed butterfly valve
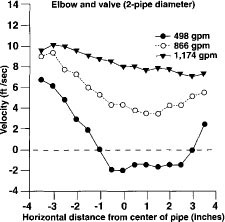
The velocity profiles at 2-pipe diameters (fig. 3) show relatively large velocities near the pipe wall for the smallest flow rate caused by jetting around the valve disk and negative velocities along the middle of the pipe cross section, indicating an eddy. At the larger flow rate, however, there was much less turbulence and no eddy existed. The differences in the velocity profiles at 2-pipe diameters indicate that the flow geometry differed between the two flow rates.
At downstream distances of 5- and 10-pipe diameters (not shown), velocities were relatively uniform and similar across the horizontal pipe diameter. However, the possibility exists that the normalized profile in the vertical cross section may not be uniform.
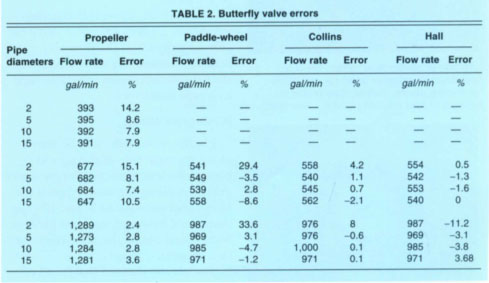
For the propeller meter, relatively large errors occurred compared with the average control error for all down-stream distances except for the largest flow rate (table 2). The largest errors occurred at 2-pipe diameters. Smaller errors relatively constant with distance occurred for the other downstream distances.
At the largest flow rates, small errors occurred for the propeller meter regardless of downstream distance. This behavior is an experimental artifacts caused by increasing the valve opening to obtain the larger flow rate, which greatly changed the flow geometry. Thus, at these flow rates, during which the valve was 70% open, the turbulence caused by the valve had little effect on the flow-meter readings.
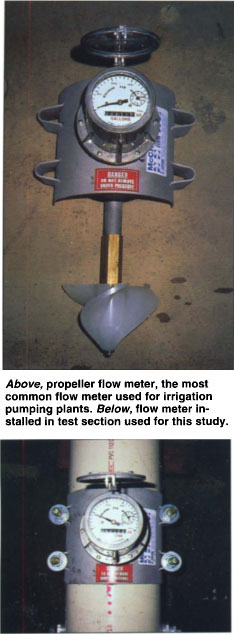
Above, propeller flow meter, the most common flow meter used for irrigation pumping plants. Below, flow meter installed in test section used for this study.
Large errors also occurred at 2-pipe diameters for the paddle-wheel meter for the middle and largest flow rates. For the other downstream distances, much smaller errors were found, fluctuating between positive and negative values. However, caution should be used in assuming that these small errors indicate that this meter is particularly accurate under this flow condition. These results reflect the point-velocity characteristic of the meter, which depends on the location of the paddle wheel relative to the velocities across the pipe cross-sectional area.
Interestingly, relatively small errors occurred for the Collins and Hall meters, with no apparent trend with downstream distance or flow rate. One would not expect these small errors, given the amount of turbulence for this flow condition. Errors fluctuated between positive and negative values with downstream distance.
The average error of each group of flow rates was determined for each flow meter and then compared with the average control error. For the propeller mete, differences between these errors were statistically significant for the smaller flow rate. For the Collins and Hall meters, differences were not statistically significant for all flow rates. Mixed results occurred for the paddle-wheel meter.
These results suggest that turbulence from a partially closed valve can substantially affect the flow meter reading, particularly at small down-stream distances from the valve such as 2-pipe diameters.
90-degree elbow
Higher water velocities occurred along the right side of the pipe at 2-pipe diameters, reflecting larger water velocities along the outer edge of the elbow (not shown). At 5- and 10-pipe diameters, however, uniform profiles were found across the pipe diameter (not shown).
The results showed that small errors were caused by the turbulence from the elbow. Little or no trend in error with either downstream distance or flow rate occurred for each flow meter.
The average error for each group of flow rates was compared with the average control error. Differences in the average errors were not statistically significant for the propeller meter. Differences in the errors were statistically significant at all flow rates for the paddle-wheel meter, where negative but small errors occurred in contrast with a positive average control error. For the other flow meters, mixed results occurred for the statistical tests, with differences not significant at 2-pipe diameters but significant at 15-pipe diameters.
The results of these data suggest that the elbow did not adversely affect the flow meter's performance. This is particularly true for the velocity-integrating meters. However, a point-velocity meter at 2-pipe diameters positioned on the right-hand side of pipe would read differently from one positioned on the left-hand side because of differences in water velocity.
Butterfly valve and elbow
At 2-pipe diameters, an eddy existed along the right side of the pipe for the smallest flow rate (fig. 4), similar to that of the valve only, while at 5-and 10-pipe diameters (not shown), a trend of increasing velocity occurred from left to right across the pipe. The magnitude of the trend decreased as the downstream distance increased, although the trend was reversed for the middle flow rate at 10-pipe diameters. For the largest flow rates, profiles were very different compared to the smallest flow rate.
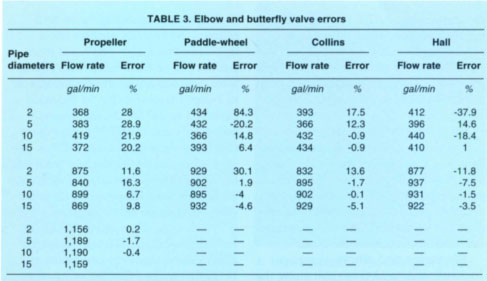
Very large errors generally occurred at 2-pipe diameters for all flow meters except at the largest flow rates, for which only the propeller meter was used (table 3). The error relative to length of straight pipe downstream from the flow meter differed among the meters. For the propeller meters, errors of the smallest flow rates were relatively constant regardless of down stream distance. Errors tended to decrease with distance for the middle group of flow rates. The average error of each group of flow rates was statistically different from the average control error for the meter, except for the largest flow rate. As with the valve-
only condition, the small errors of the largest flow rates reflect opening the valve to obtain the largest flow rates.
The paddle-wheel meter, Collins meter and Hall meter showed a trend of decreasing error with increasing downstream distance for both groups of flow rates. Very large errors occurred at 2-pipe diameters. Some fluctuation between positive and negative errors occurred for the smallest flow rates. The fluctuation of the errors of these meters prevented grouping tests together to obtain a sample size needed to conduct statistical tests on the differences of average values compared with the average control errors.
Straightening vanes
Straightening vanes installed upstream of the flow meter are used to reduce excessive turbulence. We investigated the effects of two commercially available straightening-vane arrangements on the readings of some of the flow meters. One arrangement was a single steel plate, 6 inches wide by 7 inches long, mounted vertically inside the pipe. The other was an arrangement of six vanes was installed radially across the pipe cross section. Each of the six vanes was 3 inches long and 3.5 inches wide.
Single vane and butterfly valve
The velocity profile for the smallest flow rate at 2-pipe diameters is considerably different for the single vane and the butterfly valve than that for the butterfly valve only (fig. 5). Velocities were largest in the middle of the pipe where previously an eddy existed. As the flow rate increased, the turbulence lessened, with a relatively uniform profile at the largest flow rate. At 5-pipe diameters (not shown),relatively uniform profiles occurred at all flow rates across the horizontal pipe diameter.
Large errors were found for all flow meters at 2-pipe diameters (table 4). Errors of the propeller meter were larger than the errors for the butterfly valve only, except at the largest flow rate. Thus the single vane increased the error in the flow meter measurements at 2-pipe diameters. Errors were less at 5-pipe diameters, but were still excessive for the propeller flow meter except at the highest flow rates.

For the paddle-wheel meter,large errors occurred at 2-pipe diameters for all flow rates. No trend in decreasing error with increasing flow rate was found at 2-pipe diameters. Errors were smaller at 5-pipe diameters. Errors for the Collins and Hall meters were also larger than those for the valve-only condition.
Six vanes and butterfly valve
Turbulence was much less for the valve and the six-vane arrangement at 2-pipe diameters for all flow rates compared with the single-vane arrangement (fig. 5). Interestingly, the velocity profiles of the larger flow rates were less uniform compared with those of the valve only. At 5-pipe diameters, the horizontal profiles were similar to those for the valve only for all flow rates.
The errors of the propeller meter at 2-pipe diameters (table 4), were much less than those under the single vane, except at the largest flow rates. Errors of the paddle-wheel meter were also reduced except at the largest flow rate. For the Collins and Hall meters, errors were not substantially reduced.
Six vanes and elbow
Water velocities increased left to right along the middle of the pipe at 2-pipe diameters with relatively constant velocities starting about 1.5 inches from either side of the pipe wall (not shown). At 5-pipe diameters (not shown), velocities gradually increased from left to right across the horizontal diameter. For both downstream distances, profiles differed from those of the elbow-only condition.
We did very limited testing of the straightening vanes with the elbow because errors that occurred under the elbow-only condition were small. Results showed small errors similar to the control errors for the propeller meter and the Collins meter.
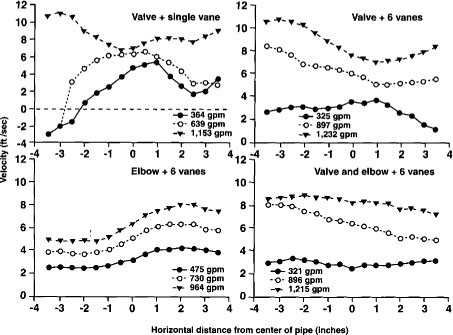
Fig. 5. Water velocity profiles under a single vane and a 6-vane arrangement for a partially closed butterfly valve.
Six vanes, butterfly valve and elbow
The velocity profiles show velocities that either decreased from left to right or were decreased from left to right or were relatively constant with distance across the pipe diameter at 2-pipe diameters (fig. 5). No eddy occurred as did for the elbow-and-valve-only condition. At 5-pipe diameters (not shown), velocities either increased or decreased slightly from left to right. For both downstream distances, profiles differed considerably from the elbow-and-valve-only condition.
Much smaller errors generally occurred for this condition than for the elbow-and-valve-only condition, particularly for the propeller meter. For the smallest flow rate, the average error for all pipe diameters was 12.2% for this condition compared with 26.3% for the elbow-and-valve-only condition. For the middle range of flow rates, the respective errors were 4.4% compared with 11.5% without the vanes.
Errors under this condition generally were less for the paddle-wheel meter compared with the elbow-and-valve-only condition. However, for the two larger errors occurred at 5-pipe diameters compared with those at 2-pipe diameters. This suggests that considerable turbulence may have existed along the vertical cross section at 5-pipe diameters. Errors were generally smaller for the Collins and Hall meters compared to tests without the vane arrangement,although at 2-pipe diameters, errors were much larger than the control errors
Conclusions
In this study of four flow meters under different conditions, velocity-in-tegrating flow meters were less affected by turbulence than were point-velocity meters.
The propeller flow meter was not affected by a check valve, even when installed only 2-pipe diameters down-stream of the valve. Both pitot meters (Hall and Collins meters) were unaffected at 5-pipe diameters. The paddle-wheel meter was affected at all downstream distances.
Turbulence from the 90-degree elbow did not affect the velocity-integrating flow meters. Turbulence from an elbow could adversely affect point-velocity meters, depending on the location of the meter within the pipe,(i.e., top of pipe, side of pipe).
Under conditions of severe turbulence — such as caused by the partially closed butterfly valve coupled with the 90-degree elbow — large errors occurred in the flow rate measurement made with the propeller meter regardless of the downstream distance. Errors were less for the pitot meters at downstream distances of 5-pipe diameters or more, but the error behaved randomly with downstream distance. These results indicate that flow meters should be installed up stream of valves.
The single straightening vane immediately downstream from the partially closed butterfly valve substantially changed the velocity profile, but created more turbulence in the water. The six-vane arrangement greatly reduced the error compared with the arrangement with straightening vanes, even at 2-pipe diameters, although errors sometimes were still much larger than the control errors.
Water turbulence disrupts accuracy of some flow meters

