


All Issues
New PM-10 rules: Uncertain impact for agriculture
Publication Information
California Agriculture 51(5):8-9.
Published September 01, 1997
PDF | Citation | Permissions
Full text
In July the Environmental Protection Agency (EPA) announced new standards for airborne particulate matter that is 10 microns or less in diameter (PM-10). Because such particulates are small enough to deeply penetrate lung tissue, they can threaten people's health. While the overall standards for PM-10 remain essentially the same, the EPA has added stricter standards for the finest respirable particles: those that are 2.5 microns or less in diameter (PM-2.5). How the new particulate matter standards will affect agriculture is uncertain.
Agriculture contributes little to fine-particle levels in downwind atmospheres, says EPA spokesman Dave Ryan. The new standards are likely to shift regulatory concern away from agriculture, which contributes more to the coarse fraction of particulate matter (between 2.5 and 10 microns), and toward industry and motor vehicles, which contribute more fine particles.
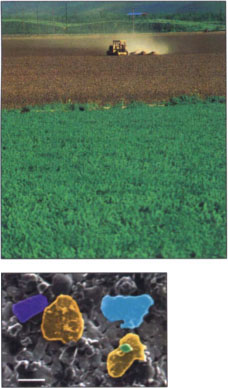
This colorized micrograph of PM-10 shows vermiculite (yellow), biotite (blue), montmorillonite (purple) and hornblende (green). — Rebecca Neumann, Randy Southard and Michael Dunlap.
While agreeing that agriculture is unlikely to be a major source of ambient PM-2.5, scientists still don't know the extent of agriculture's contribution to airborne particles, cautions Lowell Ashbaugh, air pollution transport specialist at UC Davis' Crocker Nuclear Laboratory. He also stresses that since agriculture contributes to the coarse fraction of PM-10, it could be regulated as air-quality districts strive to meet the PM-10 standards. “The fact that agriculture contributes little directly to ambient PM-2.5 should not lull the farm community into a false sense of security,” he says. Furthermore, growers in California also have to meet state Occupational Safety and Health Administration (OSHA) standards for farmworker exposures to both total and “respirable" dust (3.5 or less microns in diameter).
One of the problems with airborne particles is that we know less about them than any other regulated air pollutant, says California Air Resources Board spokesman Jerry Martin. We do know that in general the coarse particles tend to come from agricultural fields, deserts and roads, while the fine particles tend to come from motor vehicle exhaust as well as industrial and residential combustion. But we need to learn much more about the specifics of where airborne particles come from, where they go, what is in them and how the various components affect people's health. UC researchers are working to answer these questions and to find ways for farmers to reduce PM-10 production.
The EPA tightened the particulate matter standards because recent studies have shown that people can suffer health effects such as shortness of breath, severe chest pain and even premature death at PM-10 levels about 40% to 50% below the federal standard, says John H. Haines, a policy analyst in the EPA's Office of Air Quality Planning and Standards. Rather than just lowering the overall PM-10 standards, the EPA added PM-2.5 standards because the finer particles are harder to control and pose the greatest health risk. “Most of the nasty stuff like metals is in the fine section,” says Haines.
The federal limits for PM-2.5 in ambient air are 65 micrograms per cubic meter (μg/m3) over 24 hours, and a daily average of 15 μg/m3 over a year. Areas that do not meet the PM-2.5 standards have to develop compliance plans by deadlines ranging from 2005 to 2008; they have to attain the standards by deadlines ranging from 2012 to 2015. The federal limits for PM-10 remain at 150 μg/m3 over 24 hours, and a daily average of 50 μg/m3 over a year. The Cal-EPA standards for PM-10 are tighter at 50 μg/m3 over 24 hours, and a daily average of 30 μg/m3 over a year; Lake County is the only county in California that meets Cal-EPA PM-10 standards.
The first step in determining how the particulate matter standards will affect farmers is finding out how much agriculture contributes to PM-10. UC Davis scientist Ashbaugh is working towards that in a 4-year, USDA-supported study of particulate matter in the San Joaquin Valley. Previous studies have shown that PM-10 standards are frequently exceeded in the San Joaquin Valley and that soil dust from a variety of sources comprises about 60% of the PM-10 in the Valley annually, peaking in September and October. Ashbaugh has found that of the total PM-10 from soil, only about 10% to 20% is PM-2.5. However, he says that other agricultural sources may also contribute to PM-2.5. Ammonia emissions from confined animal operations may combine with nitrogen oxide from motor vehicles to form fine ammonium nitrate particles, and thereby contribute significantly to San Joaquin Valley PM-2.5 levels.
The next step in determining how the particulate matter standards will affect farmers is identifying the agricultural operations that produce the most PM-10. Two of the dustiest, large-acreage operations are cotton and almond harvesting, and Ashbaugh is quantifying the amount of PM-10 they produce by comparing the airborne particles upwind and downwind of the operations. So far, he has found that almond sweeping and pickup generate far more PM-10 than almond shaking or cotton picking and stalk cutting. Next he will analyze cotton disking as well as plowing, land planing and other ways of preparing agricultural land.
After the major PM-10-producing agricultural operations are identified, the question is “Can we find a way to reduce dust production without adversely affecting agricultural production?" says Ashbaugh. Simple but effective approaches include planting a cover crop between almond rows and mowing it before harvest, and tilling fields during the morning, when the soil is relatively moist and there is not much vertical mixing of the atmosphere. Equipment modifications may also reduce PM-10 significantly. UC Davis soil scientist Randal Southard and his colleagues have found that a modified almond harvester cuts total dust production by as much as 90% and respirable dust production by as much as 80%. ( See page 10 .) In addition, UCD soil scientist Michael Singer and agricultural engineer Shrini Upadhyaya are working on a vacuum attachment that could trap the fine soil particles generated by land planes.
Effects on workers
Besides reducing agriculture's contribution to airborne particles, such equipment modifications could reduce dust exposure in farmworkers. While the Cal-OSHA consultation service will monitor dust exposure on request, little monitoring has been done, notes industrial hygienist Robert Lawson of the UC Agricultural Health and Safety Center at Davis. However, he has found that in plowing and hand-harvest of fruit in the Central Valley, total dust exposure may be several times-higher than the Cal-OSHA Permissible Exposure Limit (PEL) of 10 μg/m3. Moreover, the Cal-OSHA PEL for respirable dust (5 μg/m3 over 8 hours for dust 3.5 microns or less in diameter) is frequently exceeded in the San Joaquin Valley, says UCD Farm Safety Program director William Steinke.
To help determine how dust exposure affects farmworkers' health, UC Davis Agricultural Health and Safety Center director Marc Schenker and UC Davis anatomist-pathologist Kent Pinkerton are comparing cadavers of farmworkers with those of nonagricultural workers who were presumably exposed to less dust. While the farmworkers had not yet developed overt respiratory disease, Schenker and Pinkerton's initial results show that their lungs contain more dust than those of the nonagricultural workers. The dust particles are trapped in immune cells that are within the walls of the respiratory bronchioles, which are the smallest air passages, only about a millimeter across. The bronchiole walls around these particles are as much as 10 times thicker than normal. Thickening can lead to fibrosis (scarring), which can stiffen lung tissue and make it harder to breathe as well as impair gas exchange.
Although there are many unknowns about PM-10, what we do know suggests that finding ways to reduce the airborne particles from agricultural operations will be a growing concern.
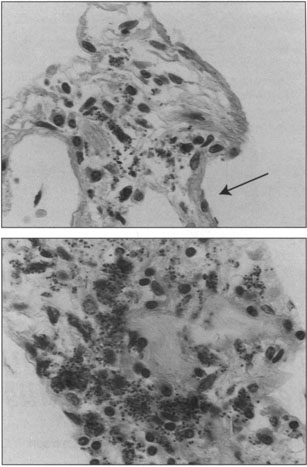
These cross sections of brochiole walls show trapped carbonaceous particles. At top, the arrow indicates a wall of normal thickness, 4 to 5 microns, above which is a significantly thickened wall. At bottom, is an even thicker wall (same magnification).
New PM-10 rules: Uncertain impact for agriculture

