


All Issues
Irrigation shifts toward sprinklers, drip and microsprinklers
Publication Information
California Agriculture 51(3):38-40. https://doi.org/10.3733/ca.v051n03p38
Published May 01, 1997
PDF | Citation | Permissions
Abstract
From 1972 to 1995, gravity irrigation (flood, furrow and so on) has decreased by about 20% on an acreage basis, while sprinkler irrigation has increased by about 8% and microirrigation, including drip and microsprinklers, has increased by about 12%. These statewide estimates exclude rice acreage and are based on surveys commissioned by the California Department of Water Resources and the U.S. Bureau of the Census. Irrigation districts, UCCE farm advisors and specialists, the Natural Resource Conservation Service (NRCS) and the U.S. Bureau of Reclamation (USBR) were other sources of information. Different irrigation methods have different implications for crop yield, water conservation and water-quality protection. With the advent of chemigation and fertigation, future surveys should collect information about both irrigation and associated agricultural chemical practices.
Full text
Governor Wilson's Water Policy Task Force has projected shortages between 4 million and 6 million acre-feet per year by 2010. Under the provisions of the Central Valley Project (CVP) and the State Water Project (SWP), growers are the first to take cuts when water shortages occur.
Irrigation methods and practices vary in their capacity to deliver water to crops to achieve high yields and to protect water quality. Applied water has four “fates,” which are influenced by the irrigation method: leaching below the root zone, transpiration by plant tissues, evaporation from the soil surface and runoff from the soil surface. A grower's main objective, apart from specific soil-management objectives, is to provide optimal soil water conditions for crop growth and production of marketable portions of the plant. The grower's desire to avoid water stress and maximize production may conflict with water-quality protection when irrigation water application is not uniform and when the farmer lacks control over the precise amount of water applied.
Pressurized irrigation systems, including sprinklers and drip irrigation, afford the irrigator greater control over the amount and, in many cases, the uniformity of water distribution to the root zone when compared to gravity methods such as flood and furrow irrigation. Therefore pressurized irrigation systems generally provide a greater opportunity than gravity systems for maximizing yields and also for protecting the groundwater supply. However, capital costs are higher for pressurized systems than for gravity methods. Growers justify these capital investments with the increased benefits that result from more precise placement of water and nutrients in the root zone.
From a water-quality perspective, a shift toward sprinkler and micro-irrigation methods is a positive trend because these methods provide complete control over the amount of water applied to the field and tend to distribute water more uniformly within the intended root zone, decreasing leaching and runoff. Are California farmers voluntarily adjusting irrigation practices to accommodate water quality? We attempt to answer this question with a review and comparison of irrigation method surveys conducted between 1972 and 1995.
Past studies of irrigation
Surveys of irrigation methods in California can be categorized based on the lead agency sponsoring the study. Studies published by the California Department of Water Resources (DWR) in 1975 (1972 data), 1983 (1980 data) and 1993 (1991 data) relied heavily on information provided by UC Cooperative Extension specialists and county farm advisors. The 1991 estimates were supplemented by a direct mailing to 10,000 farmers that resulted in a 25% usable return rate. The direct mailing was coordinated by the USDA Agricultural Statistics Service and researchers at UC Davis, and the results were reported in DWR's 1993 Agricultural Water Use Biennial Report and in a recent paper by Snyder et al. (1996). Because the 1991 survey was based on direct grower responses and the 1972 and 1980 surveys were based mainly on farm advisor estimates, the UC Davis researchers compared 1991 farm advisor estimates to grower estimates for Butte, Monterey, Kern and Riverside counties. The farm advisors estimated more acres under surface irrigation than did the growers.
The second major agency providing information about irrigation methods is the U.S. Department of Commerce, Bureau of the Census (BOC), through its Farm and Ranch Irrigation Surveys of 1988 and 1994. Entitled “Related Surveys,” they correspond to the 1987 and 1992 Census of Agriculture. (The Bureau of the Census is the same federal agency that performs the population census every 10 years, as directed by Article I of the U.S. Constitution. This agency, along with the USDA Agricultural Statistics Service, sets high standards for data collection.) The DWR and BOC surveys have both attempted to characterize irrigation methods statewide, although in the latter effort California was part of a nationwide survey. In the 1994 BOC survey, questionnaires were mailed to 1,323 farmers in California, with a 63% response rate.
A third source is the Natural Resources Conservation Service (NRCS, formerly the Soil Conservation Service), which performed an informal survey in late 1995 by asking county staff to estimate acreage under different irrigation methods. This information was gathered for a national study on irrigation-induced soil erosion (Dan Johnson, NRCS, unpublished data). Although irrigation methods data were reported on a watershed basis, the data were also coded by the counties that responded, 56 in all.
Although methodologies differed, results of these various surveys reveal a very consistent trend when plotted on a time series graph (fig. 1). On a statewide percent acreage basis, surface irrigation methods have decreased about 20% from 1972 to 1995, while sprinkler and microirrigation have increased 8% and 12% respectively.
In addition to these state and nationally oriented surveys of irrigation methods, irrigation methods questions were included in an intensive survey of 223 Central Valley irrigators conducted by Dornbusch & Co., Inc. for DWR. This survey was conducted to help validate the DWR Central Valley Planning Model (CVPM), which helps predict farmer behavior during drought years (Ray Hoagland, Economic Analysis Section, personal communication). The Dornbusch study differed from previous surveys in that it asked for information from two reference years within the same survey instrument (1991 and 1994). Of the 223 respondents in the Dornbusch study, 120 (54%) gave a response about their “most recent” change in irrigation systems (fig. 2). Changes ranged from a complete overhaul of the irrigation method to modifications in existing systems, such as shortening furrow lengths. The number of acres affected by these changes could not be determined from the data.
Records from irrigation districts
Comparably less consistent “data sets” exist among irrigation districts and other water agencies in the state. In California, there are more than 150 irrigation districts or companies that provide water to agricultural users. Public agencies, such as the Kern County and Monterey County Water Resources Agencies, also keep track of irrigation practices. Monterey County's most recent report confirmed the trend of decreased acreage in combined sprinkler and furrow and solid-set sprinkler irrigation (61 to 55%) and the increased acreage in drip irrigation (14 to 20%) from 1993 to 1996 (Nottenkamper et al., 1996). Recently the USBR (Mid-Pacific Region) requested irrigation method information within conservation plans prepared by districts receiving “federal water” from the Central Valley Project. The responses to USBR tend to be variable because each district has its own historical record-keeping system, although some have attempted, over variable spans of time and for their own purposes, to characterize the irrigation methods being used by their customers.
In early 1996, we sent letters requesting information to 127 irrigation districts throughout the state. Knowing that district record keeping would be highly variable, we attempted to survey as many districts as possible, rather than sending requests to a random sample. Only 10 districts provided irrigation methods data on an acreage basis for more than 1 year of record so that a trend could be established within the district. Years of record ranged between 1969 and 1996. The acreage for these 10 districts encompasses roughly 25% of the total irrigated acres in California. The data from individual districts show similar trends as previous surveys: decreasing use of gravity-driven surface irrigation; increased use of “combinations” (sprinklers for germination followed by surface methods); and a slight increase in sprinkler and microirrigation methods. Incidentally, there were three districts that responded both to our informal survey and to requests for information within USBR conservation plans: Shafter-Wasco, Terra Bella and Westlands. The acreages under different irrigation methods for these three districts, in response to independent requests for information, were reasonably consistent.
Tracking adoption
By collecting information from a variety of sources, we have demonstrated a consistent trend in agricultural water use: decreasing use of gravity-driven surface irrigation and increasing use of pressurized-sprinkler and drip irrigation. Although this trend is generally known in the scientific and agricultural community, this is the first time these disparate sources have been brought together for comparison and publication. The trend expresses the degree to which the agricultural community is making positive adjustments voluntarily in the absence of mandatory regulations.
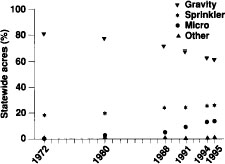
Fig. 1. Irrigation methods, 1972-1995. Rice acreage excluded (consistently flooded) except for 1995 NRCS estimates. Furrow/sprinkler combination in sprinkler category. Data sources: 1972—DWR; 1980—DWR; 1988—BOC; 1991—DWR; 1994—BOC; 1995—NRCS.
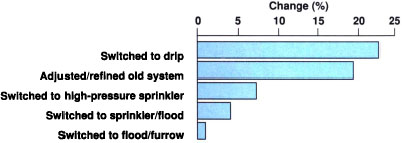
Fig. 2. Shifts in Irrigation technology among 120 Central Valley farmers. Source: Dornbusch & Co., 1995
Reliable data of irrigation (and fertilization) practices are needed for assessing adoption rates of improved systems and management practices, identifying research needs and helping agriculture justify its use of water resources. To continue tracking the irrigation adoption curve, a statistically robust, periodic, confidential and consistent survey method that is acceptable to farmers and/or consultants is needed.

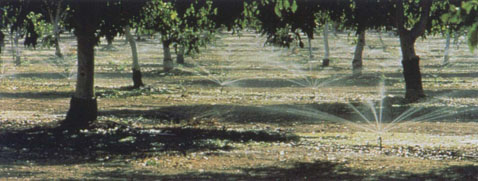
Drip and other microirrigation methods give growers more control over the amount of water applied to the field and tend to distribute water more uniformly within the intended root zone.
Irrigation shifts toward sprinklers, drip and microsprinklers

