


All Issues
Field-based phenological model predicts pink bollworm emergence
Publication Information
California Agriculture 50(5):44-48. https://doi.org/10.3733/ca.v050n05p44
Published September 01, 1996
Abstract
Control of pink bollworm, a serious pest of cotton in southeastern California, is enhanced by knowing when the different stages of its development will occur. Prediction of pink bollworm development requires a phenological model that relates development to a thermal scale. For spring emergence, the study showed that heat unit accumulation starting Feb. 1 was the best predictor of beginning and peak emergence. This research used field-collected data to establish lower and upper temperature thresholds of 57° and 91 °F (13.9° and 32.8°C), respectively; 409° and 918°F-days (227° and 510°C-days) from Feb. 1 to the beginning and the peak of spring emergence, respectively; and 866°F-days (492°C-days) between generations, from adult moth to adult moth.
Full text
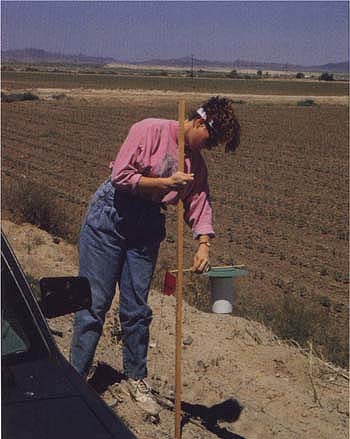
A field worker sets out a pink bollworm pheromone trap adjacent to seedling cotton crop. The numbers of male moth captures are used to plot generation peaks.
Pink bollworm (Pectinophora gossypiella) larvae are serious pests of cotton in the desert southwest that reduce seed cotton yield and lint quality. Pink bollworms overwinter as quiescent (diapaused) larvae in the previous season's bolls, plant debris and soil. In the spring, beginning in late March and continuing through early July, these diapaused larvae pupate and emerge as adult moths. The moths mate and the females lay eggs on terminals, leaves, stems and young floral buds (squares) of the cotton plant. Neonate larvae that develop within squares mature at or near bloom, drop from the infested flower (rosetted bloom) to the soil, pupate and emerge as adults. This chain of events is repeated for subsequent generations, except that most of the subsequent larvae develop in bolls rather than in squares. Up to five generations can occur during a cotton growing season.

Pink bollworm emergence cages were established over green cotton bolls infested with larvae. Midwinter irrigation reduced the numbers of spring-emerging moths and spring irrigation caused a “shutdown” of moth captures followed by a distinct flush of moth emergence.
Control of pink bollworm is enhanced by knowing when developmental events, such as beginning and peak of spring emergence, will occur. As with all insects and plants, the pink bollworm's development is related to temperature. Thus its developmental events can be better predicted from a thermal scale than from a chronological one. A thermal scale is constructed by accumulating heat units, also called degree-days, between upper and lower temperature thresholds from initiation to end of a developmental event, such as egg to adult moth, or, if the initial date is unknown, from an arbitrary date, such as Jan. 1, to the end date. The lower temperature threshold is the temperature below which no development occurs. The upper threshold is the temperature above which the growth rate remains constant or diminishes.
Researchers have used several different temperature thresholds, obtained mainly from laboratory studies, for pink bollworm development. We conducted studies in the Palo Verde Valley to determine thresholds for pink bollworm development from field data and to obtain heat units for key developmental events during the cotton growing season. We monitored pink bollworm activity by counting numbers of free-flying male moths captured in pheromone (sex attractant) baited traps and numbers of male and female moths captured in screened cages placed over field-collected infested cotton bolls.
Developing the heat unit model
Emergence cage studies
We obtained initial and ending dates for the developmental event of overwintered larvae to adults from trials that used late-season, field-collected, pink boll-worm-infested green bolls. Our main purpose in those trials was to study the effects of fall, winter and spring cultural practices on numbers and timing of spring-emerging moths. One of the cultural practices was irrigation. In midwinter, irrigation reduced the numbers of spring-emerging moths and in the spring caused a “shutdown” of moth captures followed by a distinct flush of moth emergence, the latter providing dates for periods of heat unit accumulation.
Community Crews of inmates from the Chuckawalla Valley State Prison at Blythe, as well as non-inmate field workers and Cooperative Extension crew members, collected green bolls in the field each fall from 1986 through 1990 and separated the bolls randomly into sets of 400 each to be placed under screened emergence cages. For each designated cage location, workers made a square, flat-bottomed depression the size of the bottom of the pyramid-shaped screened cage. They spread one set of bolls evenly in the depression, buried them under 2 to 3 inches (5.0 to 7.5 cm) of soil and placed an emergence cage over the buried bolls. Bolls were collected on several days each fall because the numbers of bolls required could not be collected and handled in one day.

Fig. 1. Mean numbers of pink bollworm moths captured per cage per night (24 cages) from green cotton bolls buried under 2 to 3 inches of soil between Nov. 3 and 6, 1988, and assigned to three different irrigation regimes. Bolls irrigated July 6 received no earlier irrigation. Bolls irrigated May 16 were irrigated in February. Bolls irrigated April 18 were irrigated in November and February.
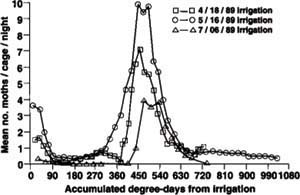

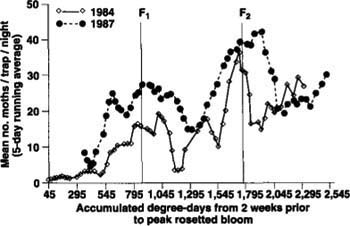
Fig. 3. Mean numbers of male pink bollworm moths captured per trap per night (4 traps in each of 27 cotton fields in 1985, mean numbers of pink bollworm-infested rosetted blooms along 131 feet of row in each quadrant of the fields, and an estimated susceptible square curve (solid line) created to precede the total white bloom curve by 2 weeks. Circle #1 denotes when adult male moths mate with female moths, which may oviposit on the first susceptible squares (circle #2) and cause rosetted blooms 2 weeks later (circle #3). The first moths (F1) emerge (circle #4). The peak of the F1 comes from larvae in blooms at the peak of the rosetted bloom curve (circle #5).
At least three times a week during the spring emergence period, crew members counted the moths captured in the inverted glass jars at the apex of the emergence cages. These trials provided 21 irrigation events with initial dates ranging from March 18 to July 13. The peak emergence flushes occurred 16 to 41 days after the irrigations.
Temperature data
Along with pink bollworm development data, we needed temperature data in order to construct a thermal scale. The temperatures that directly affect pink bollworm development are the temperatures in the cotton canopy, in squares and bolls, and in the soil. However, air temperature is more widely available to researchers and growers, and from a practical standpoint was the index of choice. Because of the diurnal variation in temperature, it is necessary either to use temperatures recorded in small increments of time, such as every 15 minutes, or to use a curve that approximates those values. A sine curve using the daily minimum and maximum temperatures gives a good approximation, adequate for obtaining heat unit values, to the actual diurnal curve. We chose to use minimum and maximum temperatures, using only two values every day instead of the 96 or more with “continuous” readings.
We obtained daily minimum and maximum air temperatures from a recording thermograph in a class A weather station at the emergence cage sites for 1988 through 1990, the period during which it was set up and providing reliable data. Otherwise we used California Irrigation Management Information System Station 36, in the northern section of the Palo Verde Valley, and Station 72, in the southwest section of the valley. Both stations used a Campbell Scientific CR-21 Micrologger.
Temperature thresholds
We used the BASET program on the UCIPM computer system to establish the upper and lower temperature thresholds for the 21 irrigation-emergence events. BASET calculates degree-days using a range of values for upper and lower thresholds in all combinations to determine which combination gives the smallest coefficient of variation for degree-days between events. In other words, BASET selects the upper and lower thresholds, which give the best predictability of the number of days from irrigation to peak numbers of emerging moths.
Results
Heat units for the event irrigation to peak emergence flush were 459°F-days (255°C-days), with lower and upper thresholds of 57° and 91°F (13.9° and 32.8°C), respectively. figure 1 shows the number of moths per cage per night (pink bollworm moths fly mainly at night) plotted versus days after irrigation for three of the events. The numbers of moths varied between the events due mainly to differences in irrigation regimes. The main point is that the peak number of moths occurred later after irrigation when irrigation occurred during April, a cooler time, rather than July. However, with the thermal scale, the events coincide (fig. 2). The thermal scale of degree-days or heat units more accurately shows the development and emergence of adult moths from overwintering larvae than does the chronological scale of days after irrigation.
Expanding the heat unit model
Spring emergence and subsequent generations
The response of diapaused pink bollworms from infested bolls to irrigation provided 21 events with initial and ending dates under a variety of temperature situations, enabling us to determine upper and lower thresholds. However, we needed to use those thresholds to calculate heat units for spring emergence and generation times of pink bollworms as those events occur in cotton fields. We determined dates of beginning and peak spring emergence for each of the seven years — 1985 through 1987 and 1989 through 1992 — from plots of moth captures in 48 pheromone-baited traps, called survey traps, which were placed along roadsides throughout the Palo Verde Valley. The beginning of spring emergence was defined as the date of the second consecutive observation with a mean of 1 or more moths per trap per night. These survey traps were used to obtain a valleywide estimation of spring emergence not tied to or influenced by the cultural practices of individual growers. As there is no specific date for the initiation of spring emergence, we accumulated degree-days from the first of January, February, March and April, using the thresholds selected from the irrigation event data, to determine which initial date would be best. The UCIPM Degree-Day Utility program was used for that determination.
For generation events, we obtained dates of peak moth activity from plots over time of male pink bollworm moth captures in pheromone-baited traps used in large-scale trials in growers' fields in 1983 through 1989. We had 12 first (F1) and second (F2) generation events. The third and later moth generations were not used because it was nearly impossible to determine peak dates in most years due to overlapping of the generation curves and the escalating numbers of moths captured in late season.
The current season generations, as distinguished from the overwintered moths, are tied to the growth of the cotton plant. Because planting dates and cultural practices may differ between fields, we used traps situated in fields for the generation dates, rather than the survey traps. The date used to initialize heat unit accumulation for the F1 generation comes from the relationship of the moth to the cotton plant. Adult male moths mate with female moths, which oviposit on young cotton plants (fig. 3). Some of the resulting neonate larvae enter susceptible floral buds — 3/16 inch (0.46 cm) to 1/4 inch (0.64 cm) in diameter. These larvae in turn give rise 2 weeks later to rosetted blooms, from which come the first moths (F1), produced in the current season's crop. The peak of the F1 generation comes from larvae that cause the peak of the rosetted bloom curve. Thus the initial date for heat unit accumulation for the F1 is 2 weeks prior to peak rosetted bloom.
Workers counted rosetted blooms twice weekly during the bloom period. The date of peak rosetted bloom was determined by plotting the number of blooms over time. The initial date for the F2 generation was the peak date of the F1. Thus our generation events were adult moth to adult moth. We accumulated heat units for the generation events using the UCIPM Degree-Day Utility program.
Results
For spring emergence, we found that heat unit accumulation starting Feb. 1 was a better predictor of beginning and peak emergence than the other months we tried. Mean degree-days from Feb. 1 to the beginning and to the peak of spring emergence were 409° and 918°F-days (227° and 510°C-days), respectively. Peaks of emergence, as determined by plots of male moth captures, were widely divergent for 1986 and 1991 (fig. 4), due to the cooler spring in 1991. However, when numbers of moths are plotted on the thermal scale, spring emergence for the 2 years coincides (fig. 5). figure 6 shows the numbers of moths for the first two generations for 1984 and 1987 plotted on a calendar scale; peak generation points were separated by about 2 weeks. figure 7 shows the first two generations for those years, plotted on a thermal scale, indicating 886°F-days (492°C-days) per generation.
Recommendations for control
The temperature thresholds for pink bollworm development that we obtained are similar to, but not the same as, those developed from laboratory data and used by other researchers. We feel that the same thresholds and therefore the same degree-days should be used for all research work, extension efforts and grower-oriented predictions for pink bollworm developmental events in the desert southwest, including southeastern California. This would avoid confusion and increase information exchange about pink bollworm phenology.
Guidelines and recommendations for pink bollworm control are available from many state and local sources. In view of the significant irrigation-induced spring emergence of pink bollworm moths, we especially emphasize the following points: When following cotton with cotton, pre-irrigate and plant as early as possible, yet attend to guidelines that ensure adequate soil temperature for germination and seedling emergence. Apply the next irrigation early to prevent even slight moisture stress and to promote maximum moth emergence prior to the presence of susceptible squares.
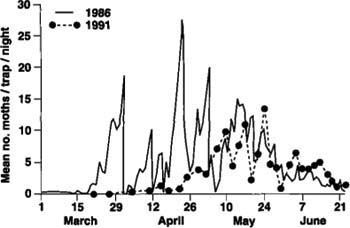
Fig. 4. Mean numbers of spring-emerging moths captured per trap per night in 48 pheromone-baited survey traps checked daily in 1986 and twice weekly in 1991.
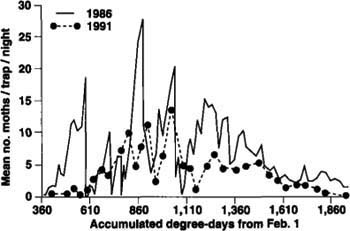
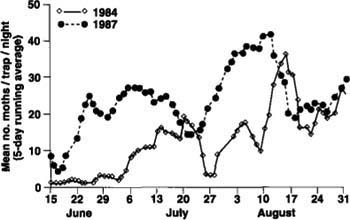
Fig. 6. Mean number of F1 and F2 male pink bollworm moths captured per trap per night in pheromone-baited traps in cotton fields in 1984 and 1987 (168 and 96 traps, respectively).
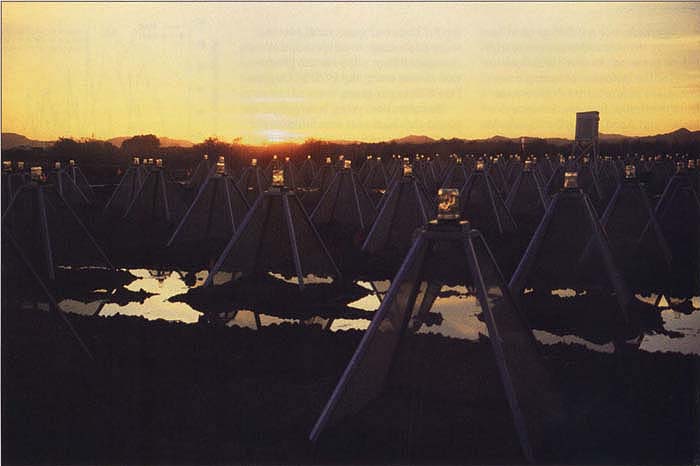
Sunlight at dusk is reflected through the inverted, pint capture jars placed at the apex of the pyramid-shaped pink bollworm emergence cages. For spring emergence, heat unit accumulation starting Feb. 1 was a better predictor of beginning and peak emergence than other months.
Field-based phenological model predicts pink bollworm emergence

