


All Issues
Nitrogen isotope ratios identify nitrate contamination sources
Publication Information
California Agriculture 50(2):32-36. https://doi.org/10.3733/ca.v050n02p32
Published March 01, 1996
Abstract
Nitrate contamination of groundwater is becoming a widespread problem in California. To evaluate the utility of stable nitrogen isotopes for identifying sources of nitrate contamination, nitrogen isotope ratios (?15N) were measured on nitrate extracted from core samples taken below natural, fertilizer, on-site sewage disposal (septic) and animal sources in the Sacramento and Salinas valleys. The mean ?15N value from natural sources was not significantly different from that of fertilizer sources. The mean ?15N value from animal sources was significantly different from that of septic sources and natural and/or fertilizer sources. Nitrogen isotope ratios tend to be site specific and should be measured below suspected sources in the subsurface and in groundwater.
Full text

Nitrate (NO3) concentrations higher than the drinking water standard in groundwater are common in many parts of the world. Multiple sources of NO3 contamination generally occur within the same watershed or groundwater basin. Sources include animal feedlots, horse corrals, dairy waste lagoons, manure applied to land, municipal sewage effluent, on-site sewage disposal systems, urban and agricultural fertilizer, natural soil organic matter and, in some cases, geologic sources. It is often difficult to ascertain which of these sources in a watershed may be contributing significant amounts of NO3 to groundwater.
The nitrogen (N) isotope method of distinguishing sources is based on measuring the two stable isotopes of N (14N and 15N) in NO3 of the sample. A common way of representing these ratios is delta 15N (?15N), which is the difference between the ratio 15N/14N of a sample and that of a standard (in the atmosphere) divided by the ratio of the standard, with the entire quantity multiplied by 1,000. This results in a ?15N value that typically varies less than several per mil (%0) from that of the standard. The percentage of the two isotopes is nearly constant in the atmosphere at 0.366% 15N. However, because of the slight difference in atomic mass of the two isotopes, certain chemical and physical processes often preferentially utilize one isotope, causing a relative enrichment of that isotope in the product and a relative enrichment of the other isotope in the remaining reactants. Because of these isotopic fractionation processes, NO3 from various N sources has been shown to have different N isotope ratios. This ratio in a sample depends on the series of reactions that formed the N compound and the composition of its precursors. If the sample is enriched in 15N relative to the standard, then the ?15N value is positive, and if the sample is depleted in 15N, then the ?15N value is negative. From literature sources, the ?15N values of NO3 from soil organic nitrogen, fertilizer, animal waste and septic tank effluent range from approximately +2 to +8%0, -3 to +2%0, +9 to +25%0 and +6 to +25%0, respectively.
This study evaluates the use of N isotope ratios as a tool for identifying NO3 contamination sources in groundwater for certain California conditions. The ?15N values in soil water and groundwater were measured in vertical profiles directly beneath various sources of NO3 contamination (for example, fertilized fields, animal waste sites, septic systems and unfertilized, uncultivated land), from the source to the groundwater.
Sampling in Davis, Salinas Valley
Two study areas were chosen for field sampling, based on differing hydrogeologic conditions and ease of access for drilling. These areas were in the southern Sacramento Valley, where all sampling was performed in the vicinity of Davis, and in the Salinas Valley. Each study region contained sampling sites representing four different sources of NO3: natural soil organic matter, inorganic fertilizer, animal feedlot/dairy and septic tank effluent. Soil and subsurface sampling was accomplished by drilling and sampling with an 8-inch-diameter, continuous-flight, hollow-stem auger and with a 2.5-inch-diameter California split spoon sampling ahead of the auger. Cores were taken continuously from the ground surface to the water table. Drilling continued into the water table to a depth of 10 feet below the water-table surface whenever possible. A water sample was collected from the bottom of each borehole upon reaching groundwater, using a bailer inside the auger. Subsamples of the core were taken approximately every 5 feet and were preserved for analysis. After the core was taken in the field, the sample was placed in a polyethylene zip-lock bag and placed in an ice chest filled with dry ice. The sample was then transferred to a freezer until it was processed.
Nitrogen isotope analyses
Nitrate in the soil samples was extracted with deionized water (1:5). Samples that were still cloudy after vacuum filtering were centrifuged and the decantant refiltered. A small amount of the thawed soil was taken to determine moisture content.
Steam distillation was used to convert the inorganic forms of N in the soil-water extracts to a stable form of ammonium salt needed for N isotope analysis. These samples were then sent to a laboratory for N isotope analysis. Standard deviation of 6 to 12 samples of reference standards was no larger than 0.8 ?15N units. Multiple extractions of field samples were generally within this same range. Thus we do not consider samples significantly different if they fall within ±1 ?15N unit.
NO3 varies with location, depth
We drilled 26 boreholes during this study. Results are shown in terms of NO3 concentrations and ?15N values versus depth for the Davis area (figs. 1 and 2) and the Salinas Valley area (figs. 3 and 4). Some gaps occur in the ?15N values due to insufficient NO3 to conduct isotope analysis. Concentrations of ammonium, chloride and sulfate were also determined and used in the interpretation, but are not plotted here. In general, ammonium concentrations were negligibly small.
NO3 concentrations vary considerably with location and depth owing to differing land uses, soil-water fluxes and geochemical processes (figs. 1 and 3). Most of the data represent nitrate in soil-water extracts expressed as ?g/g oven-dried soil.
As expected, NO3 concentrations beneath the natural sources were low. NO3 concentrations beneath the septic sources also tended to be low. This could be caused by the boreholes not intercepting the main discharge zones of the on-site sewage effluent, which can seep from the leach lines or pits in a spatially and temporally erratic fashion. Nevertheless, we are confident that our sampling captured enough NO3 to register ?15N signatures of the various sources. The high NO3 concentrations in shallow groundwater beneath the fertilizer, feedlot and septic sites in the Davis area and beneath the fertilizer and feedlot sites in the Salinas Valley could reflect both local and off-site sources.
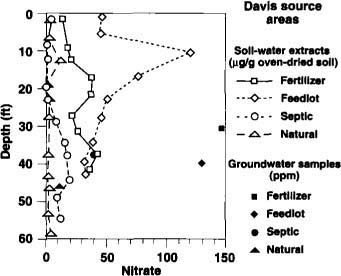
Fig. 1. NO3 concentrations with depth for inorganic fertilizer, animal feedlot, septic tank (on-site sewage disposal) and natural soil organic matter sites in the Davis area (southern Sacramento Valley). Solid symbols represent balled groundwater samples. Soil-water extract concentrations are in ?g/g oven-dried soil, and groundwater concentrations are in ppm.
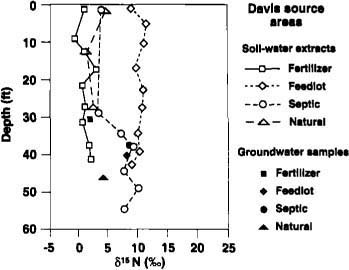
Fig. 2. ?15N concentrations with depth for inorganic fertilizer, animal feedlot, septic tank (on-site sewage disposal) and natural soil organic matter sites in the Davis area (southern Sacramento Valley). Solid symbols represent bailed groundwater samples.
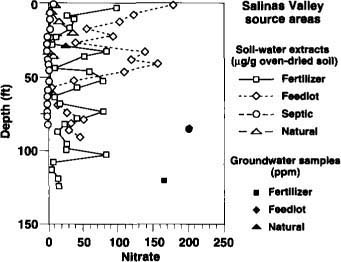
Fig. 3. NO3 concentrations with depth for inorganic fertilizer, animal feedlot, septic tank (on-site sewage disposal) and natural soil organic matter sites in the Sailnas Valley. Solid symbols represent bailed groundwater samples. Soil-water extract concentrations are in ?g/g oven-dried soil, and groundwater concentrations are in ppm.
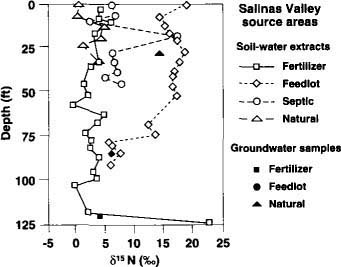
Fig. 4. ?15N concentrations with depth for inorganic fertilizer, animal feedlot, septic tank (on-site sewage disposal) and natural soil organic matter sites in the Salinas Valley. Solid symbols represent bailed groundwater samples.
Natural soil organic matter
sources
?15N values beneath the unfertilized, natural soil organic matter sites were very consistent among the borings in the unsaturated zone and varied between about zero and +5%0 (figs. 2 and 4). The ?15N values in the groundwater samples for the Salinas site were all too high for a natural organic matter source and suggest a likely non-natural source in the up-gradient direction.
On-site sewage disposal
sources
?15N values from the Davis on-site sewage disposal (septic) site (fig. 2) showed an increasing trend with depth, but were well below the largest ratios expected for animal waste. This borehole was drilled between two leach lines spaced 25 feet apart. We suspect that water from the leach lines did not move far enough horizontally to intersect the borehole location until a substantial depth was reached; this would explain the low concentrations of NO3 and low ?15N values in the shallow section. At the Salinas site (fig. 4), the borehole was drilled beside a deep vertical sewage disposal pit. Except for one very high ?15N value at the Salinas site, most of the ?15N values from the human waste disposal systems lie between +5 and +10%0.
Animal waste sources
At the Davis animal waste site, a horse corral that had been in use for at least 30 years, the ?15N value was consistent at about +10%0 throughout the vertical subsurface profile (fig. 2). The groundwater sample showed a slightly lower ?15N value than the soil water. At the Salinas Valley animal waste site, three boreholes were drilled in two of four abandoned dairy waste evaporation ponds and the animal feeding pens. The borehole with the most consistent ?15N values of the three boreholes had a nearly constant value of about +17%0 in the upper 50 feet of the profile (fig. 4). Below 50 feet, the ?15N values decreased to around +6%0; however, the other two boreholes at this site showed high ?15N values both deep and shallow. The spatial variability of ?15N values at this site can be attributed to subsurface heterogeneity and to the fact that the site contains several point sources of animal waste.
Fertilizer sources
Five boreholes were drilled at the Davis site and 10 at the Salinas site. Figures 2 and 4 give examples of ?15N values with depth for the two sites. The Davis site has been cropped with corn, alfalfa and sugar beets for many years. The Salinas site is in an irrigated agricultural field that has been in a mixed vegetable cropping system for several decades. Although most of the fertilizer applied was inorganic N, some compost containing animal waste was also applied occasionally at the Salinas site. The ?15N values for these sites were nearly constant with depth, consistent with the long-term use of fertilizer. The constant ?15N values with depth also indicate that denitrification in the subsurface must have been small. The cyclic high-low trend in NO3 concentrations beneath the Salinas site (fig. 3) is due to geologic layering of the subsurface profile at this location, with the lower values tending to locate in the coarser-grained sediments. The lack of similar cyclicity in ?15N at the same borehole (fig. 4) attests to the independence of ?15N values with respect to concentration.
Comparisons of different
sources
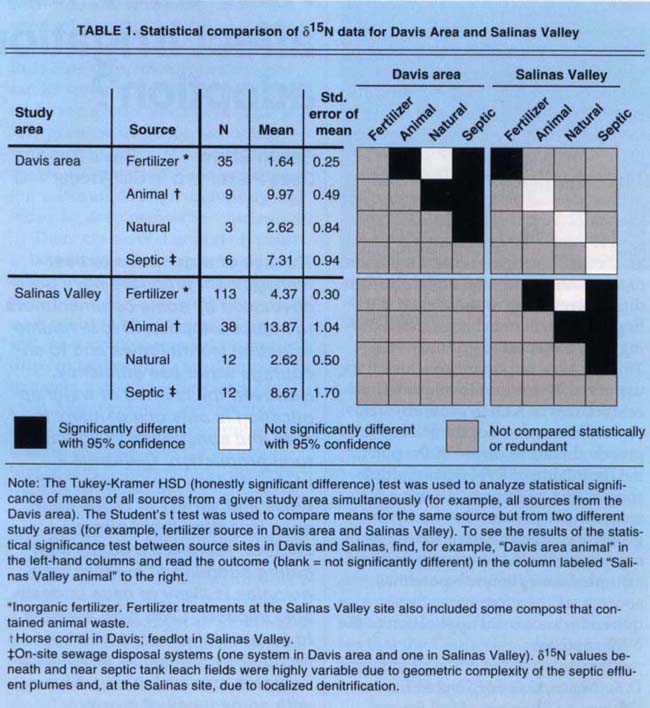
Table 1 shows statistical comparisons of the differences in mean ?15N values for the various source types and locations. These statistics are based on all of the ?15N data, including those boreholes not shown in figures 1 through 4. The mean ?15N value for the agricultural (fertilizer) source was not significantly different from the mean of the natural background source at the 95% confidence level. The animal sources were significantly different from the septic sources and the fertilizer and natural sources.
In addition, we made statistical comparisons between mean ?15N values between areas for each source type. There was no significant difference in means for the natural, septic and animal waste sources between the Davis and Salinas areas, but means for the fertilizer sites were significantly different. The elevation of mean ?15N values at the Salinas fertilizer site over those at the Davis fertilizer site may be partly due to the occasional application of compost containing animal waste at the Salinas location and/or to a significant amount of nitrogen-fixing legumes in the cropping history of the Davis location.
Mixed sources of groundwater N
The ?15N data shown in figures 2 and 4 are chiefly from the unsaturated zone directly beneath known source types. In groundwater investigations of NO3 contamination, however, much of the ?15N data will represent deeper groundwater pumped from production wells. If this deeper groundwater contains NO3 contamination from more than one source, the ?15N values will reflect a mixture of those sources. Therefore it is typically not possible to “fingerprint” the source of NO3 contamination by merely measuring ?15N in a few water wells. Clearly, determining the sources of NO3 contamination in groundwater commonly requires careful hydrogeologic analysis of groundwater migration rates and flow paths as well as an exhaustive inventory of potential NO3 sources. In this analysis, the ?15N technique is an important tool rather than “the solution.”
Even if an area contains only one source of NO3 contamination that is theoretically distinguishable by ?15N techniques, it is possible that the ?15N values measured in groundwater or deep unsaturated zone will be measurably higher than in the shallow zone directly beneath the source. The reason is that denitrification, the process whereby NO3 is converted to N2O and N2 gases, can raise the ?15N values above those of the original source. Denitrification is most likely when anaerobic conditions occur in a biologically active soil zone, which in turn most likely appears when the water table is within a few feet of land surface. When the water table is shallow, there is greater likelihood that anaerobic conditions of the saturated zone extend sufficiently into the biologically active soil zone to drive denitrification. Clearly, in addition to hydrogeologic analysis, application of the ?15N technique requires collecting data on ?15N values beneath the sources of concern to detect whether denitrification is occurring and to verify the ?15N signatures of the sources. Additional measurement of ?15N values beneath septic sources is particularly needed because of the dearth of such data in the literature.
In this study, little to no evidence of denitrification was found, presumably because the water table was 40 to more than 100 feet below land surface at all sites, well below the soil zone. That is, ?15N values tended not to increase with depth, except beneath the Davis septic site (fig. 2) and in one of the boreholes drilled at the Salinas septic site. At the Davis septic site, the borehole did not intersect the plume until a depth of approximately 25 feet, which explains the increase in ?15N value with depth. At the Salinas Valley septic tank site, the ?15N value increased with depth and the NO3 concentrations decreased with depth, which could be indicative of denitrification. In addition, a few locally elevated ?15N values were found at various sites, such as the deepest sample beneath the Salinas Valley fertilizer site (fig. 4). However, ?15N values from the other boreholes and from deeper groundwater verify that these elevated values are isolated anomalies, apparently caused by highly localized processes.
Isotope ratios as indicators
Nitrogen in the subsurface zone existed primarily as nitrate, except for one septic and one dairy lagoon site in the Salinas Valley where significant amounts of ammonium existed. The ?15N values determined from the various sites fall within the range of values reported in the literature, but with lower variances. The mean ?15N value for the natural background sites was about +2.6%0 in both the Salinas Valley and Davis study areas. Mean ?15N value for the fertilized sites was slightly greater than for the natural sites with +4.4%0 in the Salinas Valley and slightly lower at +1.6%0 in the Davis area. The animal waste sites had a mean value of +10%0 at Davis and +14%0 in Salinas Valley. The on-site sewage disposal sites had mean ?15N values of about +7.3%0 at Davis and +8.7%0 at Salinas Valley. It is clear from our data that the ?15N methodology cannot be used to distinguish between fertilizer and natural soil organic matter sources. However, in the sites that we examined, the ?15N method can be used to distinguish between animal sources and fertilizer and/or soil organic matter sources. In addition, our data show that there is a significant difference between mean ?15N of the animal and septic sources. These results exemplify the necessity of measuring the specific ?15N of suspected sources of NO3 contamination for the particular area of interest. Simply using values from the literature may not allow clear separation of source types.
The ?15N values at most sites were fairly consistent with depth from the surface to the water table. There is no evidence from our data that denitrification is a significant process at any of the sites, with the possible exception of the Salinas Valley septic tank site. Thus, except for one site in the eight main test sites, the results demonstrate that measuring the ?15N value immediately below the NO3 source can be an accurate indicator of the fingerprint of that source and that, under the conditions prevailing at these sites, the fingerprint will not change much during NO3 transport to groundwater. This is a very important conclusion for use of the N isotope technique to indicate sources of NO3 in groundwater. Nevertheless, users of the ?15N approach should be aware of the potential for mixing of ?15N from multiple sources and of denitrification under some circumstances. Careful hydro-geologic characterization as well as sampling of both the unsaturated and saturated zones beneath potential sources are therefore typically required for successful application of the ?15N approach.
Citations
Nitrogen isotope ratios identify nitrate contamination sources

