


All Issues
Can we stop farmland losses? Population growth threatens agriculture, open space
Publication Information
California Agriculture 49(6):11-17. https://doi.org/10.3733/ca.v049n06p11
Published November 01, 1995
PDF | Citation | Permissions
Abstract
California, the nation's top agricultural producer, also leads the states in the number of new residents added annually. California's population is projected to double to 63 million by 2040. If the resulting increase in urban acreage replaces farmland, California agriculture will lose nearly 5 million acres — 17% of today's total farmland base. With it will go open space, which is now a refuge for some wildlife. In the past, population growth did not reduce farmland acres because there was always more land to convert to agriculture. That scenario no longer exists due to limited cultivable land and water. Adaptations in farming practices and urban form such as higher densities and more compact development could limit the conversion of farmland to urban uses.
Full text
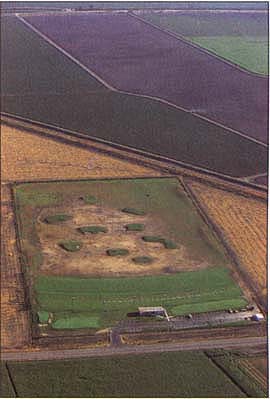
From 1986 to 1992, the amount of farmland in 34 of the state's 58 counties declined by 295,000 acres. Most was converted to urban uses. This golf course, a precursor of development, sits in the midst of farmland.
California's population will double to 63 million by 2040, according to recent projections by the California Department of Finance. Sixty-three million would exceed the current populations of several large nations including Egypt, France, Iran, and Italy. Can California really accommodate such population growth on its 156,000 square miles?
What is California's “carrying capacity” for people? In other words, how many people can be supported by the state's present resource base? Identifying such a limit is difficult in part because we do not fully understand how to husband and creatively manage land, water, clean air and other resources to support an expanding population. In addition, estimating California's ultimate population capacity would be fraught with uncertain assumptions about factors such as technical progress and future standards for acceptable quality of life.
Instead of attempting difficult and questionable judgments about carrying capacity, this paper examines resource-population relationships in one growth-impacted arena: California's farmland and agricultural practices. As well as leading all other states in the number of new residents added annually, California tops the nation in agricultural production. Farm market values and the diversity of plant and animal production give us this distinction. The Central Valley alone produces about 250 different agricultural commodities and may be the richest and most diverse farming region in the world.
In California's rapidly growing society, cities and farms compete for land as they do for other resources such as water. Housing more persons in the state means converting more farmland acres to urban use because the most buildable sites are located on flat valley lands with access to water. This also means biodiversity losses because farmland includes some wildlife habitat. If nonprime land is also converted to agricultural use, additional habitat will be degraded or lost.
What do past trends and future projections tell us about the relationships between population growth and changes in farmland supply? And how can the negative impacts of continued population growth be limited by adaptations in both agricultural practices and the form of urban growth?
California population growth
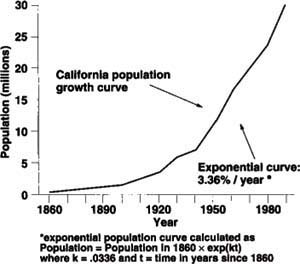
Rapid growth has always been the norm for California. From 1850 through 1990, the population grew from less than 100,000 to 29.9 million (fig. 1). During that period, growth per decade averaged about 41% and never dipped below 19%. Annual growth rates in 1860-1990 averaged 3.36%. In the last full decade, 1980-90, the average yearly growth rate was 2.29%.

During various decades since 1940, growth rates for individual California counties and regions have been astonishing — between 6 and 8% annually for extended periods. (Examples are Solano, Contra Costa, San Diego, Orange, and Santa Clara counties.) Currently, the fastest growing regions of the state and their 1993-94 growth rates include Imperial County (3.6%), the central Sierra foothills east of Sacramento (2.6%), the San Joaquin Valley (2.5%), and the “Inland Empire” of Riverside and San Bernardino counties (2.3%).
However, California's overall growth rate has slowed in the past few years, primarily due to the economic recession of the early 1990s.
From 1989 through 1994, the state's population growth slowed down to an average of 1.9% per year, still adding more than 400,000 persons per year. However, even this reduced growth rate is high relative to international levels — 20 times the growth rate in Italy (0.01%), higher than that in China (1.1%), and similar to those in Brazil (1.6%), Mexico (1.9%) and India (1.9%).
The 1980s immigration — about half of which was international — accounted for about 330,000 new California residents a year, or a little more than half of the total 600,000 annual increase, according to estimates provided by Leon Bouvier in his 1992 monograph Fifty Million Californians.
While projected population increases for California vary depending on the assumptions used, there is little question that further substantial growth is in store for the state. Figure 2 shows projected population growth to 2040 under four different scenarios: (1) continuation of the 1980 to 1990 rate (2.29% per year); (2) continuation of the 1992 to 1993 rate (1.8% per year); (3) continuation of the 1993 to 1994 rate (1.24% per year); and (4) continuation of the 1980 to 1990 rate excluding all domestic and foreign immigration (1.09% per year).
Urbanization and farmland
From 1850 to about 1955, both population and farmland steadily increased in California. Immigrants came from all over the world to develop the agricultural potential of the state's Mediterranean climate, extensive lands with diverse fertile soils and water tapped through federal, state and local projects. In the early decades of this era, before transportation improvements permitted rapid shipping of agricultural products, local population growth stimulated increases in the amount of California's land under cultivation.
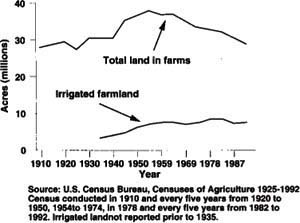
In 1954, however, the total amount of land in agricultural use in California (fig. 3) peaked and then began to drop, signaling a new and negative relationship between changes in numbers of people and farmland acres. On the other hand, the state's irrigated farmland acres (which is almost the same as total harvested cropland) did not peak until 1978. Until that time, plentiful supplies of cheap irrigation water provided by federal and state sources were available. According to the Census of Agriculture, in 1992 California had about 28.9 million acres of total farmland and about 7.5 million acres of irrigated land, representing decreases of 23.5% and 11.0% from the peak years for these acreages, 1954 and 1978 respectively.
While the decline in California's farmland acres cannot be attributed solely to urban development, there is little question that the massive urban growth during the second half of this century has cut directly into the farmland base. Throughout most of California's history, population growth did not reduce farmland acres because there was always more cultivable land to convert to agriculture. That scenario no longer exists due to limits in the availability of both cultivable land and irrigation water. Today the expansion of urban development subtracts acres from a relatively fixed farmland base.
Data from the Farmland Monitoring and Mapping Program demonstrate the close connection between urban land increases and farmland decreases. Established by the state Department of Conservation, this program has used information from aerial and soil surveys to track biennial changes in agricultural and other landuse categories since 1984. Not all counties have been completely mapped since that time, but data on land conversions from 1986 to 1992 are available for 34 counties that have 63% of the state's land area and about 90% of its population.
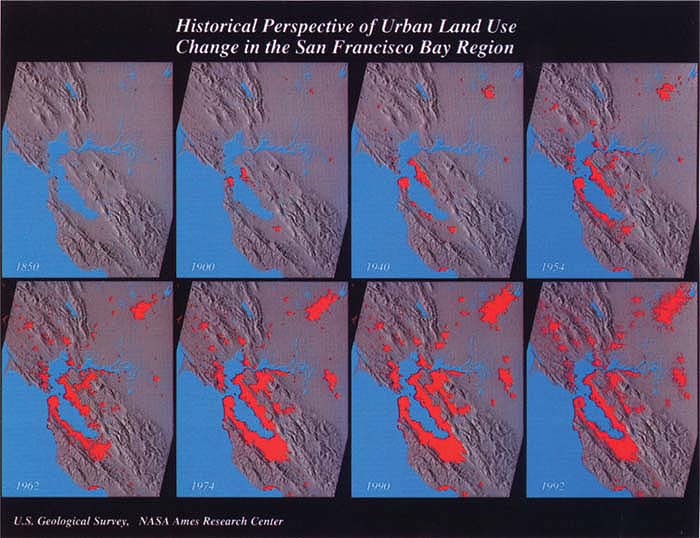
Historical perspective of urban land use change in the San Francisco Bay region. Red areas are “built up” or urbanized regions based on data from historic maps (years 1850 through 1962) and satellite images. Maps are computer generated.
In these counties, the total amount of agricultural land declined by 295,000 acres during the 6-year period. Most of this — 262,000 acres, an area slightly larger than the total urban area in Orange County — was converted to urban and built-up land (that is, land with at least one building unit per 1.5 acres). While the farmland base in the 34 counties decreased by 1.6%, the total urban area increased by 12.3%.
Assuming that this conversion trend continues, what are the possible long-term impacts on California's farmland base? If the state's population doubles by 2040 as projected, the amount of land devoted to urban uses may also double from the current 4.8 to about 9.6 million acres. If all or most of this increase in urban acreage comes at the expense of agricultural land, then California conservatively will lose nearly 5 million agricultural acres by 2040 — a decrease of about 17% from today's total farmland base. And the percent decline likely would be much larger for the 7.7 million-acre cropland base because most of the expanding urban acreage of the state is surrounded by cropland. For example, some of the largest, most rapidly growing cities in the Central Valley are on the valley floor, which has some of the state's richest agricultural soils.
Adaptation in agriculture
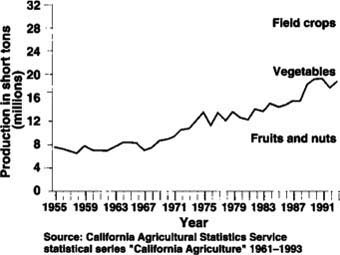
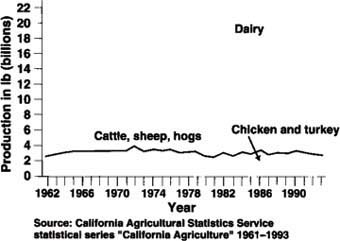
A declining farmland base, however, does not necessarily bring about decreases in production. Even though the amount of land devoted to agriculture has decreased since 1955, production of most cropland and animal commodities has increased as a result of changes in agricultural technologies and resource use. According to data collected by the California Department of Food and Agriculture (CDFA), orchard crop (fruit and nut) production almost doubled and vegetable production increased by about 3.5 times between 1955 and 1991 (fig. 4). Similarly, the production of animal commodities — red meat (beef, lamb and pork), poultry (chicken and turkey), and milk and cream — increased between 1962 and 1991 (fig. 5). Despite a declining grazing land base, production in red meat animals, which peaked after 1970, remained relatively steady after the late 1970s. Dairy and poultry production both more than doubled. Milk production, in particular, has thrived as a result of irrigated pasture and alfalfa derived from irrigated croplands. Poultry and dairy facilities have continued to increase production by introducing new breeds of animals and intensifying technical and management inputs in larger scale facilities, using smaller amounts of land and relying on feed products from intensive irrigation based croplands.
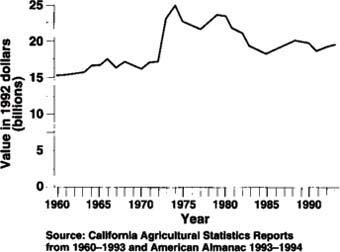
Production values also have increased over the past four decades. While total farmland in the state declined by 8.9 million acres between 1954 and 1992, the statewide market value of farm products increased by $14.2 billion. During this 38-year period, the 672% increase in market value far exceeded the 464% increase in the rate of inflation (Consumer Price Index). From 1974 to 1994, however, inflation-adjusted market values declined (fig. 6).
Adaptation in urban form
Still another form of adaptation to population and land pressures is to change the ways in which Californians use land in the urbanization process. Planners and others have long advocated higher densities for residential and other urban land uses to limit the costs of public service and transportation as well as to minimize the impacts of growth on natural resources. This is also the message of the 1995 policy document strongly criticizing California's past sprawling development patterns that was issued by an unusual coalition — Bank of America, California Resources Agency, Greenbelt Alliance and Low Income Housing Fund.
By national and international standards, California is not a crowded state. Our statewide population density in 1990 was 191 persons per square mile. Even subtracting the 45 million acres of federal land that is effectively excluded from urbanization (being parks, forests and deserts), the density approximates 360 persons per square mile on the remaining 55 million acres. This is still well below northeastern state averages. Densities for heavily urbanized states in the northeast ranged from 1,042 persons per square mile for New Jersey to 678 for Connecticut. For the major countries in Western Europe, densities were between 959 for the Netherlands and 259 for France.
California cities are much less densely populated than the largest eastern municipalities. While New York has about 24,300 persons per square mile and Chicago has 12,200, in 1990 California's 16 largest cities had a combined density of only 5,708 persons per square mile. Moreover, most of California's current population growth occurs in smaller cities and unincorporated fringe areas. In the Central Valley, where population pressures on farmland currently are the most intense, city densities average 3,500 persons per square mile — about 25% less than densities in comparably sized communities in the state's coastal areas.
What are the prospects for increasing the density of California's urban development? The obstacles to this more efficient use of land are largely behavioral and political. For example, many California homebuyers prefer large lots and rural lifestyles. In addition, existing homeowners often oppose proposals to build denser projects in their neighborhoods because they equate higher residential densities with low-income apartment dwellers and problems such as congestion, crime and deflation of property values.
Yet more densely settled communities need not be unattractive or dangerous places in which to live. Increasingly, developers and planners in various California communities are creating more compact and pleasing neighborhoods, many following neotraditionalist designs that emphasize compact, mixed-use development. While 6,000- and 7,000-square-foot parcels per house are typical in California projects, new residential projects contain single family homes on lots as small as 4,000 square feet (approximately 10 homes per acre) in some communities such as Turlock and Woodland. Besides the obvious cost advantages of the smaller parcels, these new projects include innovative designs such as common open areas that limit the sense of congestion and so enhance their marketability.
Even modest increases in residential density can substantially reduce the rate of converting farmland to urban use. Central Valley cities, for example, average about five single family residences per acre. Increasing that density to just seven homes per acre reduces the land required for a given population by 28%. With about 30,000 acres converted annually from farmland to more intensive urban uses throughout the 18-county Central Valley, a 28% reduction would preserve 9,000 acres a year.
Other ways that growing cities can use their land more efficiently include setting aside less land for ambitious commercial or industrial projects that may fail to come to fruition and designing narrower streets — rights of way account for as much as one-fourth of the developed area in the typical California city.
Farmland: a limited resource
As a limited resource, California's farmland is the arena for ongoing competition between cities and farms. Urban development directly cuts into the farmland base in this state because expanding cities generally are located in the midst of prime cropland.
The negative consequences of this competition, we suggest, can be lessened by adaptations in agricultural practices and in urban form. Growers and ranchers can continue to make more productive use per acre of a decreasing farmland base, while cities and other urbanizing communities can consume smaller amounts of land by increasing their population densities and infill development. Judging from past experiences, agricultural adaptations may be easier to achieve than changes in urban form. While farmland owners generally make production decisions according to market, technological, taxation and farm policy considerations, communities grow according to more perceptual and personal factors. As long as California homebuyers and builders equate large residential lots with quality of life, limiting the conversion of farmlands will continue to be difficult.

California is not a crowded state by national and international standards, but its sprawling development is crowding out farmland. Throughout the Central Valley, about 30,000 acres are converted annually from farmland to urban uses. Increasing residential density can reduce this rate.
In any case, changes in farming practices and urban form will only temporarily ameliorate the problem of accommodating both a rapidly growing population and a very large and productive agricultural industry in the same state. For example, the state will continue to lose dryland farming acres that have important environmental values. If current population and landuse trends continue, the state's agricultural production will be sorely restricted in future decades. A California with more than 60 million residents, as seems entirely possible within the next 50 years, will be an entirely different state in terms of both its agriculture and its urban population.
Can we stop farmland losses? Population growth threatens agriculture, open space

