


All Issues
Long-term survival question: Why do oaks produce boom-and-bust seed crops?
Publication Information
California Agriculture 49(5):7-12. https://doi.org/10.3733/ca.v049n05p7
Published September 01, 1995
PDF | Citation | Permissions
Abstract
Annual differences in acorn crop size of California oaks do not correlate with rainfall the year before, but instead with weather conditions favorable for pollination and, in two species, rainfall 1 and 2 years prior to acorn fall. Despite considerable differences in mean productivity, correlated in part with local differences in water and nutrient availability, acorn production by individual trees within populations are generally synchronous. Synchrony extends over fairly large geographic areas, although whether on a statewide scale is not yet known. Knowledge of acorn production patterns may facilitate conservation of oaks rangelands, improve our understanding of wildlife ecology and provide insights into the social structure of California's Native Americans.
Full text
Acorns are among the most abundant natural food resources in California. Although it is difficult to determine exactly how many are produced, we can derive a rough idea by multiplying the estimated yield of acorns per acre — at least 1 ton when the crop is good — by the approximately 7.6 million acres of oak woodlands in California. This gives a total of 7.6 million tons of acorns per year, far overshadowing the record 1993 California walnut crop of 260,000 tons. This surfeit of acorns provides food for a vast array of wildlife, from scrub jays (Aphelocoma coerulescens) and acorn woodpeckers (Melanerpes formicivorus) to turkeys (Meleagris gallopavo), from mule deer (Odocoileus hemionus) to wild pigs (Sus scrofa).
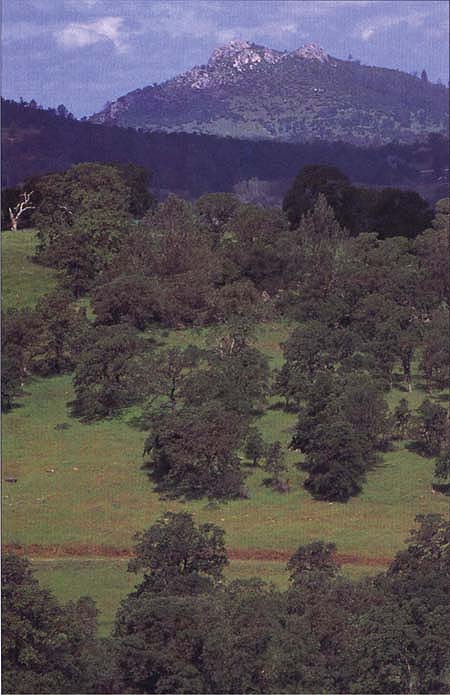
Oak woodlands such as this one cover millions of hectares of California rangelands.
However, there is a downside for species that are dependent on acorns: production is highly variable, and virtually no acorns are produced in some years. These striking annual differences are known as “mast-seeding” or, more simply, as “masting.” Native Americans in California dealt with this problem by using “granaries” capable of preserving acorns for an extended period of time. Few species of wildlife can mimic this adaptation, and acorn crop failures probably have a severe impact on the population sizes of many species.
Our work on acorn production began as an adjunct to studies of avian ecology at Hastings Reservation, located in the upper Carmel Valley on California's Central Coast. Hastings is run by UC Berkeley's Museum of Vertebrate Zoology and is a unit of UC's Natural Reserve System, which offers secure sites for long-term field research throughout California.
When we started our study in 1980, concern had begun to be expressed about the conservation of California's native oaks, and several groups were investigating factors contributing to poor regeneration. However, despite numerous reports in the literature of variable acorn production in California and elsewhere, there was no consensus on the factors causing this variation or on the patterns of variation at levels other than among years. Anecdotally, most people we talked to believed that acorn crops are primarily determined by rainfall, but we were unable to find any published evidence supporting this conjecture.
Our protocol, inspired by the statewide surveys organized in the 1970s by Chuck Graves of the California Department of Fish and Game, involved marking individual trees and visually censusing them for acorns in September prior to acorn fall. Two observers, using binoculars when necessary, chose different parts of the tree and counted as many acorns as possible in 15 seconds. The sum of these values was acorns counted per 30 seconds, or “N30.” A total of 250 mature trees were originally chosen, divided among the five species common at Hastings Reservation: valley oak (Quercus lobata), blue oak (Q. douglasii), coast live oak (Q. agrifolia), canyon live oak (Q. chrysolepis) and California black oak (Q. kelloggii). Trees were all located within 2.2 miles of each other. These same trees have been surveyed each year, yielding a 15-year record of acorn production through 1994.
This procedure has several advantages over the alternatives of using acorn traps or otherwise categorically surveying acorn crops. Traps are difficult to set up, labor-intensive to maintain and they ultimately yield small sample sizes, both in terms of the number of individual trees that can be surveyed and the proportion of a focal tree that is sampled. Even more importantly, arboreal acorn removal by acorn woodpeckers, scrub jays, common crows (Corvus brachyrhynchos), squirrels (Spermophilus spp. and Sciurus spp.) and a variety of other species can be considerable, sometimes leaving few acorns to fall on the ground even if a particular tree initially produced a relatively large crop. Measuring acorns falling to the ground may be a good idea if the goal is to measure the seeds available for potential regeneration or for ground predators, but not if the goal is to assess the production patterns of the trees themselves. Therefore we believe that visual surveys not only provide a means of assessing acorn production that is vastly more efficient than traps, but one that often produces more accurate results as well.

Left, a large valley oak (Quercus lobata) at Hastings Reservation in Monterey County. This species, perhaps the largest North American oak, was formerly a common border along rivers in California and is currently of particular concern due to poor regeneration. Above, close-up of a valley oak in bloom.
Counting acorns, rather than simply categorizing the crops of individual trees, can present difficulties. Visibility of seed crops may differ among years and among individuals, and can be particularly different for evergreen and deciduous species. However, the advantage of a continuous measure of acorn production is the generation of quantitative data that can be subjected to a wide range of statistical analyses. Analyses that we refer to here include Spearman rank correlation, a measure of the association between two continuous variables ranging between -1 (a perfect inverse correlation) and 1 (a perfect positive correlation); Kendall's coefficient of concordance, a measure of association among three or more continuous variables ranging between 0 (no concordance among variables) and 1 (perfect agreement); and stepwise linear regression, a technique that examines a relatively large number of variables, themselves potentially correlated with each other, and determines which are good predictors of a single dependent variable.
Year-to-year variation
As expected, we found that acorn crops varied widely from year to year (fig. 1). For example, during our 30-second surveys, we counted an average of less than 1 acorn per tree for blue oaks in 1986 and more than 60 per tree in both 1985 and 1987. More surprisingly, there was no significant correlation between the acorn crops of the different species, with the exception of valley and blue oaks, two closely related species in the same subgenus (table 1). In other words, a good year for coast live oaks is not necessarily a good year for any of the other species in the study area.
A major factor contributing to this asynchrony is the phenology (the timing of flower and seed production) of the different species. In particular, valley, blue and coast live oaks are “1-year” species, which require a single year from flowering to mature acorns, whereas California black and canyon live oaks are “2-year” species, which require 2 years from flowering to mature acorns. Therefore if all species were responding to the same favorable conditions for seed set, acorn production would be synchronous among species that require the same number of years to mature acorns, but not between 1-year and 2-year species. This is generally what we observe: correlations between the acorn crops of species that require the same number of years to mature acorns are positive (4 of 4 pairwise comparisons), and their mean absolute value is significantly larger than the generally negative (5 of 6 pairwise comparisons) correlations among species that require different numbers of years to mature acorns (table 1).
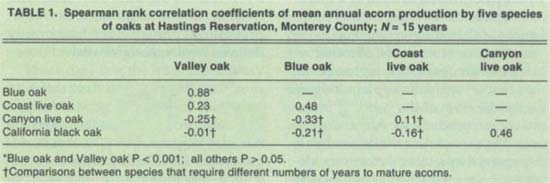
TABLE 1. Spearman rank correlation coefficients of mean annual acorn production by five species of oaks at Hastings Reservation, Monterey County; N = 15 years
What causes these striking annual differences in seed production? To assess the possible causes of mast-seeding, we performed stepwise multiple regressions of 12 pertinent weather variables on the mean annual acorn crops of each of the five species. The variables we examined included rainfall and seasonal conditions that might influence flower initiation, pollination and fertilization, or seed set. The results varied for the different species, but concurred in the conclusion that rainfall the preceding winter did not significantly influence the acorn crops of any of them.
Conditions in April prior to the autumn acorn crop were particularly important for both valley and blue oaks; crops were heavier in years when mean April temperatures were warmer. April is the key month for pollination of oak flowers, as anyone with hay fever can confirm. Based on regressions, April temperatures explain nearly 73% of the variance in the annual crop of valley oaks and 47% of the variance in blue oaks (fig. 2). These results suggest that weather conditions during pollination are most likely the primary factor determining annual variation in the acorn crops of these two species.
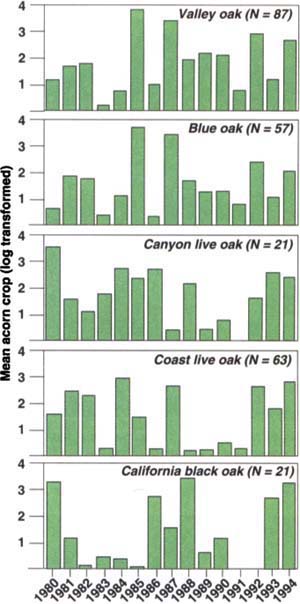
Fig. 1. Mean acorn crop (log-transformed) of five species of oaks surveyed at Hastings Reservation, Monterey County, 1980-1994. Sample sizes (N trees) are listed.

Fig. 2. Relationship between mean April temperatures and the subsequent mean acorn crop of valley and blue oaks at Hastings Reservation; N = 15 years. Spearman rank correlation rs = 0.85, P < 0.001 (valley oak); rs = 0.64, P = 0.005 (blue oak).
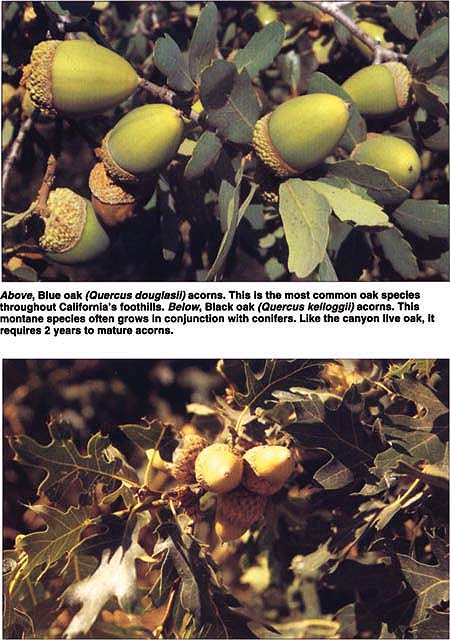
Above, Blue oak (Quercus douglasii) acorns. This is the most common oak species throughout California's foothills. Below, Black oak (Quercus kelloggii) acorns. This montane species often grows in conjunction with conifers. Like the canyon live oak, it requires 2 years to mature acorns.
For the coast and canyon live oaks, mean acorn production was positively correlated with rainfall, not in the winter preceding acorn fall but that occurring 1 and (for canyon live oak) 2 years earlier. Approximately 38% of the variance in mean annual acorn production of coast live oaks was explained by rainfall 1 year earlier, and 31% of the variance in acorn production of canyon live oaks was explained by rainfall 2 years earlier. This suggests a delayed influence of water availability affecting acorn production, or possibly a more direct influence of rainfall on flower initiation, which occurs in the late summer and autumn 1 year prior to acorn fall in coast live oaks and in the autumn 2 years prior to acorn fall in canyon live oaks.
So far, our studies of California black oak are less satisfying: none of the weather variables explain a significant proportion of the variance in annual acorn production. Apparently even 15 years of data is not enough to determine the weather factors synchronizing acorn production in this species.
In our analyses, we tried to identify which of several environmental variables might influence acorn production. As we did so, we examined variation in production at several levels: among years, among individual trees and among sites. We also used the results from these analyses to test hypotheses for the ultimate cause of mast-seeding in California oaks.
Tree-to-tree variation
On top of the large variability in acorn production from year to year, it soon became evident that individuals of the same species varied drastically in their overall acorn productivity. For example, out of 85 valley oaks for which we have a complete sample of 15 years of data, 11 trees never produced a “very good” crop of acorns (arbitrarily defined as a year in which we counted 25 or more acorns during our survey), while 1 tree produced very good acorn crops in 13 of the 15 years. Most trees produced very good crops in 3 or 4 out of the 15 years.
We are currently investigating the factors that contribute to these individual differences. So far one of the most promising factors, at least for valley and blue oaks, appears to be groundwater availability as measured by predawn xylem water potential. We measured groundwater availability in September 1991 at the end of the dry season and following 5 years of below-average rainfall on the Central Coast. Xylem water potential measures hydration of individual trees and so is an indicator of their access to soil water. This single measurement correlated positively with overall long-term mean productivity of individual trees, explaining 18% of the variance in blue oaks and 22% in valley oaks (fig. 3). Thus water availability influences differences in acorn production by individual trees, as well as providing a partial, albeit temporarily delayed explanation for year-to-year variation.
Although individual trees differ greatly in their overall productivity, the acorn production patterns they exhibit are in general similar; that is, a good year for a high producer is also a good year for a poor producer. However, for the latter this may mean that the tree produces only a very few acorns, whereas the former tree may be loaded. These patterns are illustrated in figure 4, where we have divided up the complete sample of 85 valley oaks into three approximately equal-sized groups depending on whether their overall mean acorn production was “good” (mean N30 ≥ 9), “bad” (9 ≥ mean N30 ≥ 3), or “ugly” (mean N30 < 3). All three groups of trees are strongly correlated with one another and show virtually identical year-to-year patterns.
Site-to-site variation
Given that annual mean acorn crops correlate with weather conditions such as April temperatures and rainfall in prior years, it seems likely that crops might co-vary on a fairly large geographic scale, at least insofar as these basic weather conditions correlate from region to region. So far we are able to test this possibility with 6 years of data on acorn production by three species (valley, blue and coast live oaks) from three sites on the Central Coast covering about a quarter of the total length of the state: Jasper Ridge Biological Station in San Mateo County (81 miles north of Hastings), Hastings Reservation in Monterey County, and Pozo in San Luis Obispo County (99 miles south of Hastings).
Unfortunately, 6 years of data are not sufficient to draw firm conclusions. However, indications are that the acorn crops are fairly synchronous across these sites: using Kendall's coefficient of concordance, significance values range between P = 0.09 for valley oaks and P = 0.02 for coast live oaks. Synchrony among populations of this last species is particularly pronounced (fig. 5). Despite differences among the sites, the first 3 years (1989-1991) were relatively poor years at all sites, while the last 3 years (1992-1994) were all relatively good years at all sites.
These data beg the question: How far does synchrony extend throughout the state? Of the eight major species of tree oaks in California, all but the Engelmann oak (Q. engelmannii), which is restricted to Southern California and adjacent Baja, have ranges extending over much of the state. In order to address this question, we initiated a statewide survey in 1994, censusing acorn production of six of California's tree oak species at 14 sites from Shasta County south to San Diego County. With luck, an answer should emerge just about the time we greet the new millennium.
Ultimate causes of mast-seeding
How do individual trees benefit by producing variable seed crops? There are two basic hypotheses. First, the size of the seed crop tracks some critical resource (the “resource-matching” hypothesis), therefore annual variation in resources causes masting patterns. Second, masting results from the reallocation of resources among years so as to increase the efficiency with which seeds are produced. This in turn may be through more efficient escape from predation (the “predatorsatiation” hypothesis), increased attraction of seed dispersers (the “seed-dispersal” hypothesis), or increased fertilization success, particularly in wind-pollinated species (the “windpollination” hypothesis).
The time scale on which masting occurs, combined with the large size of most oaks, makes experimental testing of these hypotheses difficult. However, each hypothesis makes predictions that are testable empirically For example, if the seed-production pattern of oaks has evolved to attract seed dispersers, some trees should differentially allocate resources to seed production in years when other trees have poor crops, thereby attracting a disproportionate share of potential seed dispersers. This would lead to discordant patterns of year-to-year variation in acorn production by individual trees and relatively small annual variation in overall acorn abundance. Similarly, the resource-matching hypothesis predicts that variation among years should be moderate, since trees should not be switching resources from either vegetative growth or reserves into seed production. These patterns do not match those we observed in California oaks.
In contrast, both the predatorsatiation and wind-pollination hypotheses predict the patterns of year-to-year and tree-to-tree variation observed at our study site. Predator satiation further predicts that a higher proportion of seeds should escape predation in mast years. Our data support this prediction: the rates of both insect parasitism and arboreal seed removal prior to seedfall by vertebrates decline significantly when individual trees produce larger crops. However, one major problem remains. To the extent that most predators are willing to eat any species of acorn, the predator-satiation hypothesis predicts that all species of oaks within a community should mast synchronously, thereby maximizing predator swamping. As shown in table 1, this is not the case, if for no other reason than because of the coexistence of species that require 1 and 2 years to mature acorns.
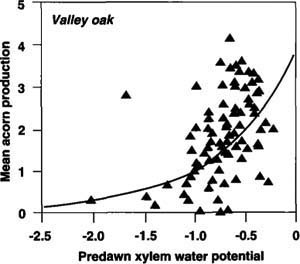
Fig. 3. Relationship between predawn xylem water potential of 85 valley oaks measured at Hastings Reservation in September 1991 and their long-term acorn productivity, averaged between 1980 and 1993. Larger negative numbers indicate greater water stress. Shown is a fitted exponential regression. Spearman rank correlation rs = 0.52, P <0.001.

Fig. 4. Mean annual acorn crop of valley oaks at Hastings Reservation divided into three equal-sized groups according to their long-term mean productivity. Spearman rank correlations between pairs of groups are 0.77 to 0.93; all P <0.001.

Fig. 5. Mean acorn crop of coast live oaks at three sites spanning 180 miles in the Central Coast, 1989-1994.
The primary alternative to the predator-satiation hypothesis is that large flowering efforts enhance pollination efficiency, resulting in occasional large seed crops. Because of the nondirected nature of fertilization, this is particularly likely in wind-pollinated species such as oaks. Several observations support the importance of pollination efficiency for acorn production by California oaks. Already discussed is the strong positive correlation between warm temperatures in April — conditions likely to favor efficient pollination — and the subsequent acorn crop for valley and blue oaks (fig. 2). Although no such correlation at this level emerges for coast live oaks, data on phenology obtained by monitoring flowering during the spring indicate that the size of the acorn crop on individual trees of this species correlates inversely with mean humidity during the flowering period, at least in years when the overall crop is fairly large (fig. 6). As before, conditions most likely to favor efficient pollination — in this case, relatively dry air — correlate with large acorn crops. Additional tests in the years ahead will allow us to directly address whether fertilization is more efficient when more flowers are produced, as required by this hypothesis.
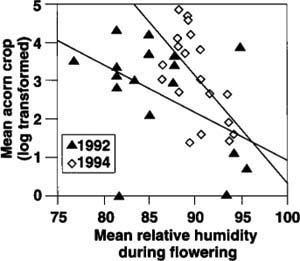
Fig. 6. Relationship between mean relative humidity during the spring flowering period of individual coast live oaks and the subsequent acorn crops of the same trees in 1992 and 1994, years when the acorn crop was good. Spearman rank correlation rs = -0.47, P <0.05 (1992); rs = -0.57, P = 0.01 (1994); both N = 19.
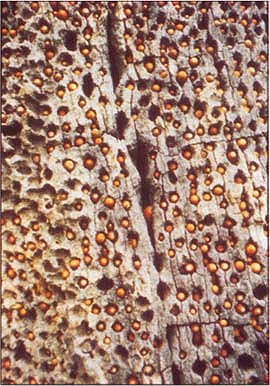
A close-up of an acorn woodpecker granary tree. Acorns are used extensively by a diverse array of California's wildlife.
Significance of mast-seeding
Our work has begun to document both how and why acorn production by California oaks varies among individual trees, years and populations. There are numerous practical applications of these data. First, variable acorn production is an important way that oaks increase the probability that the acorns they produce will evade predators and survive to germination. Understanding the environmental and evolutionary factors that contribute to acorn production patterns will allow us to better appreciate and conserve California oak rangelands, many of which are currently showing poor regeneration and are under considerable pressure from urban development.
Second, several important cultivated nut crops, including walnuts and pistachios, are wind pollinated and subject to considerable annual variation. Determining the reasons that oaks have evolved mast-seeding may help us stabilize and maximize nut production under artificial orchard conditions.
Third, acorns provide food for an astonishing variety of wildlife, including both game and nongame species. For example, acorn woodpeckers, among the most common native birds in California oak woodlands, are highly dependent on acorns. Populations of this species can crash to low levels during poor acorn years; conversely, when the acorn crop is large, birds sometimes breed in the autumn, fledging young as late as November. Current studies sponsored by the California Department of Fish and Game are likely to demonstrate similarly pronounced effects on game species such as deer and wild pigs.
Finally, although current use of acorns by humans is trivial (acorn cookies are good but hard to find, even in organic food stores), acorns were once a staple of California's Native Americans. Acorns made up over half the diet of some groups and significantly influenced tribal ranges. A thorough understanding of annual variation in acorn production and the geographic scale on which acorn crops vary is quite likely to yield additional insights into Native American sociology, from the size of tribal ranges needed to ensure a regular supply of acorns to the extent they may have had to trade with other tribes to make up for temporary shortfalls in acorn availability.
Long-term survival question: Why do oaks produce boom-and-bust seed crops?

