


All Issues
How new crop disaster policy could affect California
Publication Information
California Agriculture 49(3):7-13. https://doi.org/10.3733/ca.v049n03p7
Published May 01, 1995
PDF | Citation | Permissions
Abstract
With recent crop insurance reform, the federal government's responses to weather-related crop losses will change significantly. Among many changes, a newly created Non-insured Assistance Program (NAP) has important implications for California agriculture. NAP is a standing disasteraid program for non-insurable crops, including most vegetables, fruits and some tree crops. Our analysis shows that under one possible specification of NAP, crop disaster aid is likely to be sharply reduced.
Full text
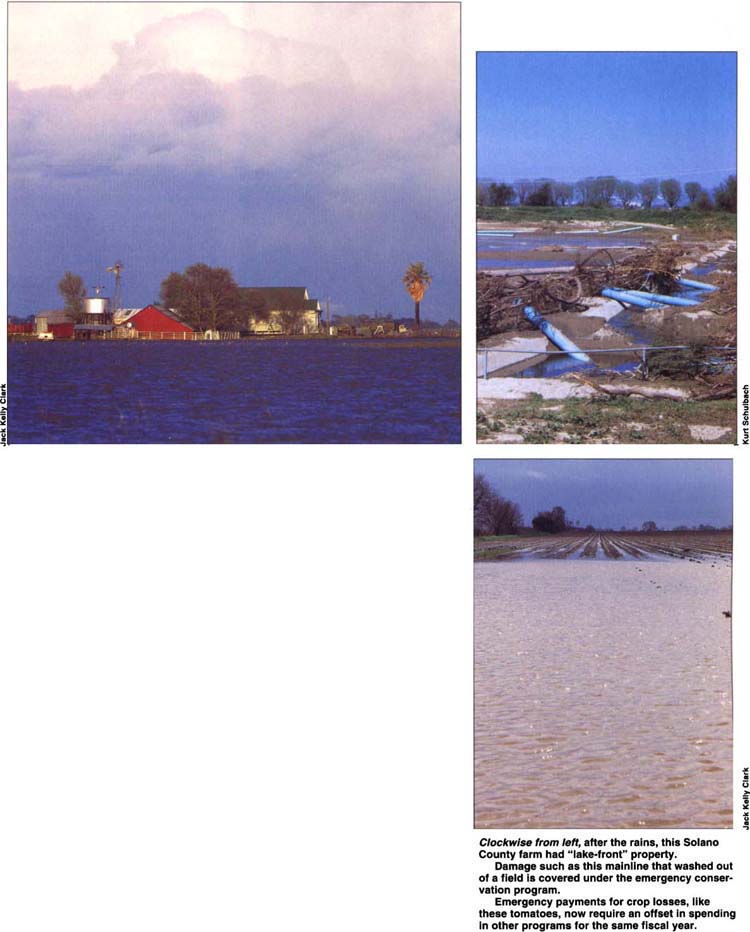
Clockwise from left, after the rains, this Solano County farm had “lake-front” property. Damage such as this mainline that washed out of a field is covered under the emergency conservation program. Emergency payments for crop losses, like these tomatoes, now require an offset in spending in other programs for the same fiscal year.
The storms that hit both Northern and Southern California in the first 3 months of 1995 resulted in extensive crop losses by destroying fields, hampering crop harvest and postponing the planting of some spring crops. This recent disaster emphasizes the relevance of crop insurance and disaster policy for agriculture in California. Crop losses from these storms will be covered under the Reform Act discussed in this article, but at the time this article went to press, detailed regulations were not yet available.
In October 1994, Congress passed and the president signed the Federal Crop Insurance Reform Act of 1994. This act revamps the federal crop insurance program to broaden producer participation and reduce the likelihood of future ad hoc crop disaster assistance. The U.S. Department of Agriculture (USDA) is currently implementing the reform for 1995 crops.
NAP regulations not yet finalized
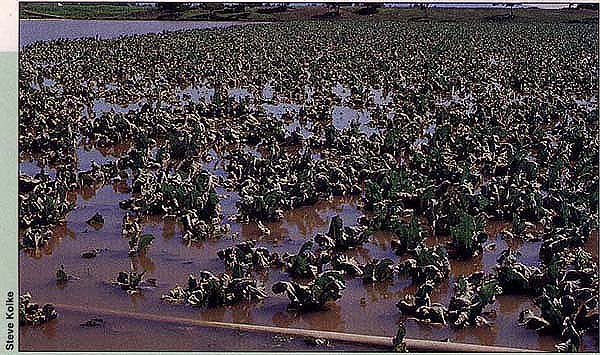
NAP provides disaster aid for cauliflower and other crops not currently eligible for federal insurance. It requires a 35% area loss to trigger individual payments.
As of this writing, USDA has not yet published Non-insured Assistance Program (NAP) regulations. Some of the variables critical to NAP payments need to be further defined. For example, in NAP calculations, what geographic region an “area” encompasses has not yet been decided. The definition of an “area” is important because the outcome of the area trigger — the precondition for individual eligibility for NAP payments — depends on the size of the area. The larger the area is, the smaller the area-wide loss is likely to be due to averaging. Thus, the larger area reduces the likelihood of an area becoming eligible for NAP payments. Further, USDA is also examining the possibility of using in NAP calculations yields based on each planting rather than on an entire crop year, which would also affect the outcome of NAP payment eligibility. (This is particularly relevant to California where multiple plantings in a season are possible.)
Our analysis provides an example of how one possible implementation of NAP could affect the level of disaster aid compared to the pre-reform period. Our scenario uses the assumption of a county-level trigger based on annual yield data. We chose the county trigger level because the county is the smallest geographical unit for which yield data are currently available. USDA may decide to use a narrower geographic unit than a county, or offer payments on a per-crop planting (rather than annual) basis. If these specifications are adopted by USDA, future NAP payments would be higher than the payment scenario provided in this study. Further, as USDA is researching the possibility of extending crop insurance to non-insurable crops, there may exist an opportunity for catastrophic and additional coverage for these crops in the future.
For several decades, ad hoc disaster assistance and crop insurance programs have provided payments to farmers to compensate for yield losses resulting from natural disasters. With crop insurance reform, however, USDA's response to weather-related yield losses will change significantly.
Ad hoc disaster assistance will be “on line” in the budget, requiring an offset in another federal program for its enactment. At the same time, catastrophic (CAT) yield coverage will be provided to producers for currently insurable crops, for a nominal processing fee. To be eligible for certain farm programs, producers must obtain at least CAT coverage for crops they produce that are of “economic significance.” For crops for which insurance is not currently available, the Reform Act provides federal assistance under Non-insured Assistance Program (NAP) provisions. NAP and CAT are intended to fill the role of current ad hoc disaster assistance and the prereform crop insurance program.
Crop insurance reform has significant implications for California producers. USDAs Farm Service Agency, which administers the federal multiperil crop insurance (MPCI) program, currently insures 51 crops. (The Federal Crop Insurance Corporation, which previously administered MPCI, is consolidated under the Farm Service Agency.) The program's focus is primarily on major row crops, such as corn and wheat, which are minor crops in California. In the past decade, crop insurance has become available for a number of specialty crops that are important in California. However, a significant portion of California agriculture is devoted to the production of non-insurable crops. With crop insurance reform, non-insurable crops are covered under NAP. USDA is currently researching the feasibility of offering insurance for many of these specialty crops.
The objectives of this paper are to inform California producers of recent changes in crop insurance and the significance of federal disaster assistance in California relative to other states in past years, and to empirically investigate how these changes could affect California agriculture, with a focus on NAP. Since NAP regulations are not presently available, this analysis uses a hypothetical specification of NAP implementation.
Federal assistance
USDA has operated two programs that aid farmers with crop losses: ad hoc disaster payments and crop insurance. Outlays for these programs have grown substantially since the mid-1980s (table 1), with the resulting budgetary pressure creating a major impetus for crop insurance reform.
Ad hoc disaster assistance
Since 1973, the scope of disaster aid has widened steadily from coverage of droughts and floods that affected specific regions and specific crops to much more widespread protection. Between 1988 and 1994, ad hoc disaster aid has been available for nearly all commercially grown crops in the United States. Unlike crop insurance, farmers pay no premium to receive ad hoc disaster aid. The government provides cash payments to qualifying producers whenever natural disasters cause actual yields to fall below specified levels.
Under this system, disaster payments have been available to eligible producers who suffered a loss exceeding 40% (for those without crop insurance) or 35% (for those with crop insurance) of a specified yield. For program crops (wheat, feed grains, cotton, rice), losses were determined based on a comparison with program yields. For most other crops, losses were based on comparisons with county average yields. The total payment due to a producer was calculated by determining the eligible amount of loss and multiplying it by the applicable payment rate. Disaster assistance has also been available for tree damage to orchards and forest crops.
USDA has paid 65% of the cost of replanting tree seedlings when a freeze or related condition caused a loss of over 45% of the trees. (For more detailed rules, see Title 7 of the Code of Federal Regulations.)
Multiperil crop insurance
Crop insurance, administered by USDA, provides payments to enrolled producers in the event of crop loss. Since its inception in 1938, federal multiperil crop insurance (MPCI) has been continually modified. The program was recast in 1980 with passage of the Federal Crop Insurance Act, which authorized major expansion of the program and attempted to make crop insurance the primary form of disaster protection. These changes were aimed at encouraging greater program participation to reduce farmers' reliance on direct disaster payments.
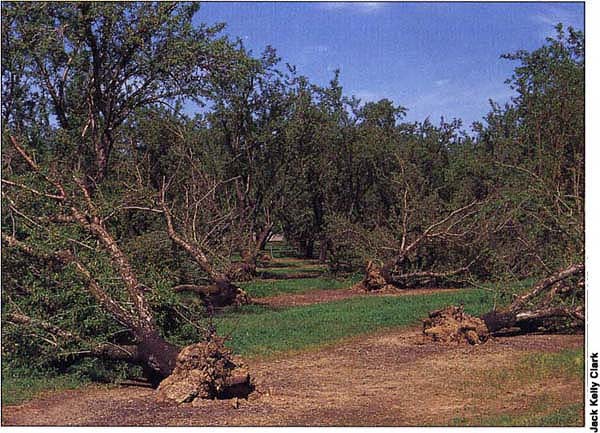
From 1988 through 1993, nut crops received the lowest total value of disaster payments. This season the almond industry expects to post losses in excess of $100 million due to uprooted trees, poor pollination and light fruit set.
Experience since then, however, has been disappointing. Despite low participation in the federal crop insurance programs (about one-third of eligible acreage nationally), crop insurance losses have been high, with indemnities exceeding premiums by more than 50% for the period 1981 through 1993. At the same time, disaster payments to farmers have been high, averaging more than $1 billion annually over the past 6 years.
Under the pre-reform crop insurance program (in effect through the 1994 crop year), a farmer could choose coverage at 35%, 50%, 65% or 75% of the farm's actual average yield calculated over a period of 4 to 10 years. A farmer received an indemnity payment based on his or her individual yield shortfall, calculated on a unit price elected at the time of crop insurance sign-up. The farmer could choose any price between 30% and 100% of the USDA announced price.
Currently, federal crop insurance is available for the following crops in California: almonds, apples, barley, citrus, corn, cotton, dry beans, figs, forage, fresh plums, grain sorghum, grapes (processed and table), oats, pears, potatoes, prunes, raisins, rice, safflower, stonefruit, sugarbeets, tomatoes (fresh and processed), walnuts and wheat. However, not all crops are insurable in every county.
Many specialty crops, particularly vegetables are not currently insurable. California is ranked first among vegetable-growing states, with vegetable production accounting for about 35% of crop revenue (22% of gross agricultural value) in the state in 1993. The current MPCI enrollment rate (the ratio of net insured acreage to eligible acreage) is about 10% in California. The national average is one-third. Crop insurance in California has performed well when measured by the average loss ratio (the ratio of total indemnities to total premiums). California's average loss ratio of 1 for the years 1981 through 1993 is actuarially sound (that is, premiums equal indemnities), and well below the national average of more than 1.5 for the same period.

A regional perspective
To analyze the distributional aspects of ad hoc disaster assistance, we used actual payment data for 1988 through 1993 — 6 years for which ad hoc disaster assistance data are available. Before 1988, ad hoc disaster payments were crop-specific and/or region-specific. Since 1988, ad hoc disaster payments have been available for almost all commercially grown crops in all regions, including California.
Disaster payments in California
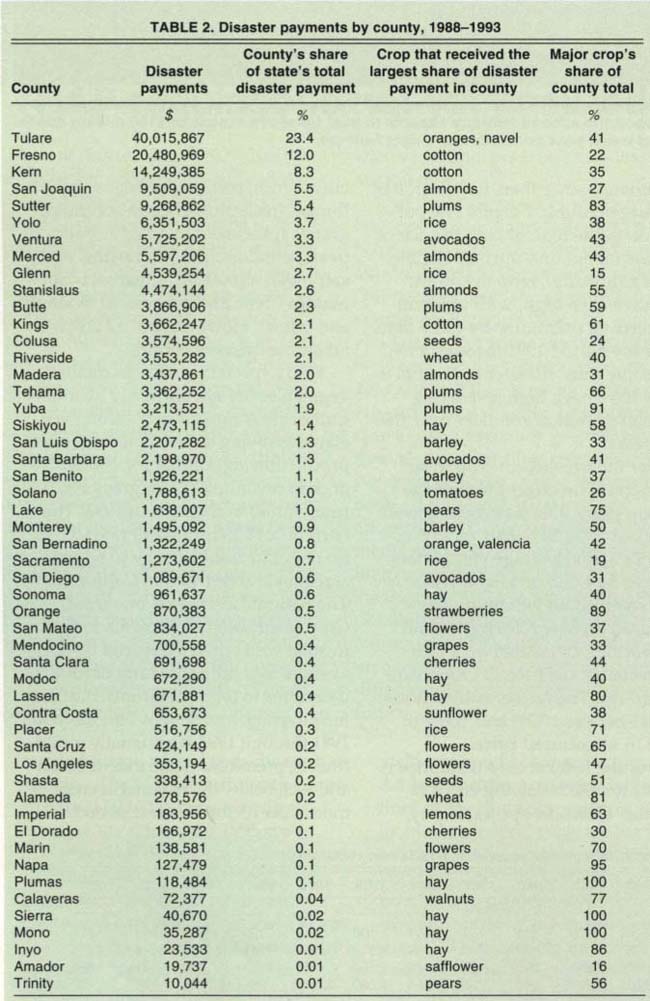
Over the 6-year period for which data exist, nearly half of the total disaster payments to California were distributed among three counties: Tulare, Fresno and Kern (table 2). When a county's share of disaster payments is compared with that county's contribution to the state's farm revenue, significant differences are observed. Tulare, which received almost onequarter of the state's total disaster payments, generated about 13% of the state's farm revenue (and 10% of the state's crop revenue). On the other hand, Monterey, the third largest farm-revenue county, contributed about 10% of the state's income, but received only about 1% of total disaster payments.
About 40% ($15.9 million) of Tulare County's 6-year total payments went to a single crop, navel oranges, in a single year, 1990. During the winter of 1990 Tulare County experienced an unusually severe freeze, which resulted in considerable losses to tree crops, particularly citrus. The county's revenue from orange production dropped from about $400 million to about $90 million. Federal crop insurance data on citrus also indicate a severe crop failure in that year. Statewide, 168 out of 190 citrus insurance policies collected indemnities for the 1991 citrus crop. That year indemnities exceeded premiums collected by a factor of eight.
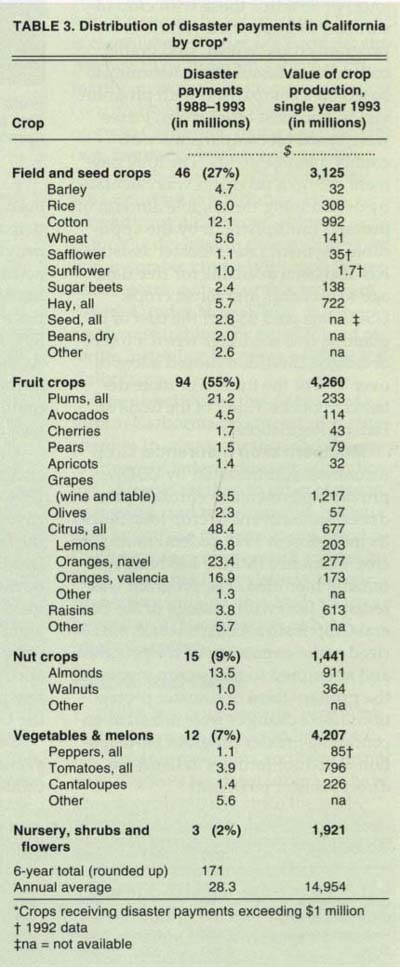
In many instances across the state more than half of a county's total disaster payments were made to a single crop; this was particularly the case for tree fruits, including plums, pears and citrus (table 2). Disaster payments to fruit crops were about eight times higher than payments to vegetable and melon crops (table 3). Field and seed crops received disaster payments almost four times higher than those made for vegetables and melons, even though field crops generate far less revenue than vegetable and melon crops in California. Nut crops received the lowest total value of disaster payments.
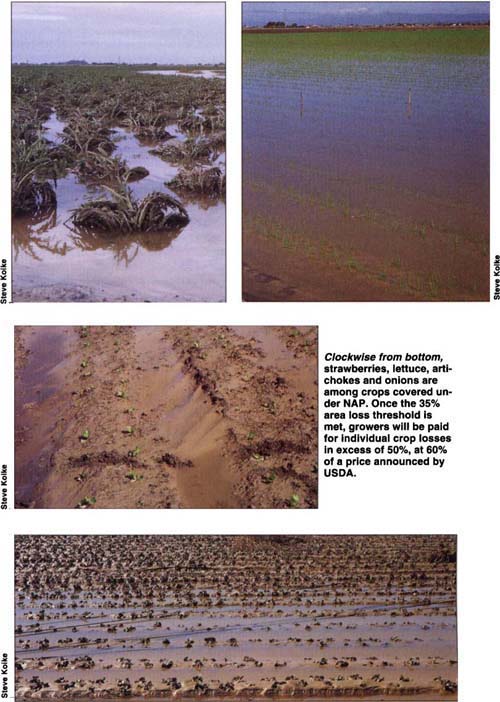
Clockwise from bottom, strawberries, lettuce, artichokes and onions are among crops covered under NAP. Once the 35% area loss threshold is met, growers will be paid for individual crop losses in excess of 50%, at 60% of a price announced by USDA.
Overhaul of programs
The main features of the Federal Crop Insurance Reform Act include a catastrophic crop insurance plan (CAT coverage); the option of subsidized “buy-up” coverage; linkage to certain farm programs; and a standing disaster assistance program (NAP) for noninsured crops. Major provisions include the following:
-
Repeal of “emergency” designation for crop losses. Authorities for the designation of ad hoc disaster programs for crops as “emergency” spending under “pay-go” budget rule are repealed. Future outlays for emergency crop losses will be “on-budget” rather than “off-budget,” requiring an offset in spending in other programs for the same fiscal year.
-
Catastrophic coverage. Federal crop insurance is supplemented with new catastrophic coverage level available to farmers for a processing fee of $50 per crop. The fee cap is $200 per farmer per county and $600 per farmer in total. CAT coverage will compensate farmers for crop yield losses greater than 50% of their actual production history yield (a 4- to 10-year simple average) at 60% of the expecte market price announced by USDA before the season.
-
Additional coverage. Farmers may purchase additional insurance coverage, providing higher yield protection (up to 75%) and/or price protection (up to 100%). Added coverage is subsidized at a higher rate than under the pre-reform program.
-
Linkages to other farm programs. To be eligible for price support or production adjustment programs, certain Farmers Home Administration loans, or a new Conservation Reservation Program (CRP) contract, farmers must have at least CAT coverage for each insurable crop of economic significance that they produce. A crop is of economic significance if it contributes 10% or more of the total expected value of all crops grown by the producer. Existing long-term contracts are not linked unless the terms are renegotiated.
-
Delivery systems. Farmers may choose to buy CAT coverage either through a private insurance company or through a local Farm Service
Agency (FSA) office. Insurance policies that provide protection above the catastrophic level are only provided by private insurers.
-
Non-insurable crops. The Non-Insured Assistance Program is a standing disaster aid program for crops that are not covered by crop insurance.
NAP provides coverage that is similar to CAT coverage, but also requires a 35% area loss to trigger any individual payments. Once the area-level threshold is reached, farmers will be paid for individual crop losses in excess of 50%, at 60% of a price announced by USDA. To prevent potential abuse, producers will be required to sign up and report basic production data to be eligible for NAP payments.
Unlike other states, a sizable portion of California agriculture will be covered under NAP. In 1992, 2.5 million out of 7.7 million harvested acres of California cropland consisted of currently non-insurable crops. These non-insurable crops generated over 40% of the state's total crop revenue. The particular importance of NAP to California prompted us to investigate how disaster aid under NAP could affect certain California crops under a hypothetical implementation setting.
How NAP could affect California
One key difference between NAP and the current ad hoc disaster program is that NAP requires an additional condition of an area loss for a given crop before any producer growing that crop in that area can be eligible for a NAP payment. Thus we first use actual county yield data to investigate the incidence of area losses large enough to trigger NAP payments. We then use actual disaster payment data to compare the levels of ad hoc disaster payments with and without the area-triggered loss requirement. This comparison enables us to infer how a specific NAP implementation method could change the level of federal disaster assistance to California agriculture.
For this exercise, four currently non-insurable crops (head lettuce, strawberries, celery and carrots) were chosen because of their economic importance to California. For this analysis, an area is hypothetically defined as a county. Historical county yield data for these crops were obtained from various issues of the Annual County Agricultural Commissioner's Reports. Yield data include 10 counties for head lettuce, 12 counties for strawberries, 6 counties for celery, and 7 counties for carrots.
“Normal” yields were calculated as a moving average of the county's peracre yields for the past 4 years. (USDA calculates the normal yield for an individual crop on a farm as an average based on a minimum of 4 years of yield records.) We consider the period 1988 through 1993, so the yield data used for this exercise start in 1984 to calculate the normal yield for 1988. After normal yields were obtained, we compared the actual yield with 65% of the normal yield for each crop, for each county, and for each year from 1988 through 1993.
Out of the total 210 (35 counties times 6 years), there were 4 incidences for which actual county yields fell below 65% of the normal yield during the period 1988 through 1993. Those incidences were Los Angeles in 1993 for strawberries, when actual yield (Ya) = 15.1 tons/acre and 65% of the normal yield (Yn) = 16.4 tons/acre; Riverside in 1993 for strawberries, with Ya = 10.7 tons and 65% of Yn = 10.87 tons; San Luis Obispo in 1990 for carrots, with Ya = 17 tons and 65% of Yn = 19 tons; and Riverside in 1991 for celery, with Ya = 9.15 tons and 65% of Yn = 17.6 tons. Under the NAP scenario that we considered, only farmers from these counties, for the crops and years specified, would have been eligible for NAP payments.
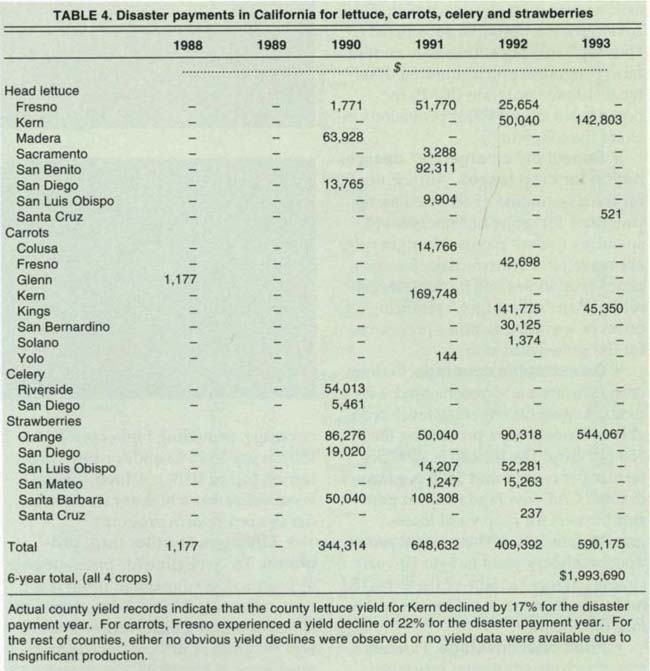
Investigating the past county records of actual disaster payments for these crops provides insights into the total dollars paid in those counties if our NAP scenario had been in operation in the last decade. Actual disaster payment records for these four crops (table 4) show that, of the four cases of crop loss described above, only celery in Riverside County received payments. Carrot growers from San Luis Obispo and strawberry growers from Los Angeles and Riverside counties did not receive disaster payments in any year, even though our data suggest that at least some growers appear eligible for payments. That is, if the county yield averaged 35% below the normal yield — the NAP trigger level — it seems likely that at least some growers would have had yields that were 40% below their normal yields.
The eligibility limitations for disaster payments may offer some explanation. The current law does not allow growers with qualifying annual gross revenues of over $2 million to receive disaster assistance. Disaster payments for crops are also limited to $100,000 per person, and combined benefits from livestock emergency programs and crop payments cannot exceed $100,000. (Combined crop insurance benefits and disaster payments cannot exceed income that would result from normal crop yields. However, this does not apply because none of the crops we considered have crop insurance.)
In addition to eligibility limitations, as described above, the gaps between the actual yield and the 65% of normal yield are small in all four cases except for celery, which is not inconsistent with disaster payment records. Further, strawberries in Los Angeles and Riverside counties involve small production, representing 2% of the state total for both counties.
As shown in table 4, ad hoc disaster payments for celery in 1990 for Riverside County were $54,013. However, this figure is based on payments for individual yield losses of more than 40%, whereas individual eligibility under NAP requires a 50% loss once the area trigger is met. We know, therefore, that payments under NAP would be at most $54,013, but might be zero if the actual loss for each recipient were between 40 and 50%. Thus the NAP payments for these four crops would have been at most $54,013. Using this upper-bound payment figure, the reduction in disaster payments is close to 97% — from $1,985,146, the sum of actual disaster payments for the four crops for the 6 years, to $54,013.
California takes small slice historically
In the wake of devastating winter storms, many California farmers have realized severe crop losses, particularly, for non-insurable crops. Historically California has not been a major recipient of federal disaster aid. For the crop years 1988 through 1993, the U.S. Department of Agriculture spent $7.8 billion on disaster payments to crop farmers. Of that amount, California received $171 million — 0.2% of the national total — the 14th highest among the 50 states. Texas received the largest amount, nearly $1 billion, followed by Minnesota, North Dakota, Iowa and Wisconsin. These 5 states received 45% of the total ad hoc disaster payments over the 6-year period.
These states differ significantly in the scale of their agriculture. More meaningful cross-state comparisons can be obtained by expressing each state's disaster payment receipts as a share of that state's crop revenue. The ratios of disaster payments to each state's crop revenue over the 1988-1993 period indicate that disaster payments made to Texas producers amounted to about 4% of the state's total crop revenue. The most extreme case is Wisconsin: for every dollar of crops marketed, Wisconsin received 8 cents in disaster payments. In contrast, disaster payments for California were only 0.2% of crop revenue over the 6-year period.
The states with substantial shares of disaster payments relative to their crop revenue were all in the Great Plains and Upper Midwest. For example, 6 states received more than 3% of their crop revenue from disaster payments: Wisconsin (8.5%), South Dakota (6.5%), North Dakota (6%), Montana (5.8%), Texas (3.9%) and Minnesota (3.8%). The top 10 states, with 2.5% or more of their revenue from disaster payments, were all in these regions or in the Southeast — the other four are Oklahoma (2.7%), Alabama (2.7%), Kansas (2.6%) and Georgia (2.5%). California, ranking 47th out of the 50 states, is in the group of states that includes Hawaii, Arizona, Rhode Island and New Hampshire.
Tabulating disaster payments for the whole country by crop category for the period 1988-1993 shows that 84% of total payments went for field and seed crops, 6% for tree fruits, 1.3% for tree nuts, 8% for vegetables and melons and 0.7% for nursery, shrubs and flowers. California received 0.2% of the disaster payments made to all states for field and seed crops, 20% of the total paid for tree fruits, 15% of the total for tree nuts, 2% of the total for vegetables and melons and 5% of the total for nursery, shrubs and flowers. It is interesting to note that for the category of vegetables and melons, California generates about one-third of national income and received 2% of disaster assistance payments. (In 1993, U.S. cash receipts for this category totaled $12.6 billion, of which California received $4.2 billion.)
Conclusions
The Crop Insurance Reform Act changes the two major assistance programs for farms that experience yield losses. Unlike other major agricultural states, California has not been a major beneficiary of crop insurance and disaster payments. With major changes in these programs, we investigated how California producers of non-insurable crops would be affected under reform. We found that, using a county-level trigger and a per-year average crop yield, NAP payments would likely fall below past ad hoc disaster assistance levels.
How new crop disaster policy could affect California

