


All Issues
New equations estimate evapotranspiration in Delta
Publication Information
California Agriculture 49(3):19-21. https://doi.org/10.3733/ca.v049n03p19
Published May 01, 1995
PDF | Citation | Permissions
Abstract
The San Joaquin-Sacramento river delta plays a critical role in California water issues, but little information about potential evapotranspiration (ET) in the region is available for water resources planning and development. Simple equations, based on long-term weather data from Stockton and Lodi, have been developed for estimating monthly ET in the Delta. These equations can provide ET data until reliable weather stations are installed.
Full text

The San Joaquin-Sacramento river delta is a region of critical importance to water issues of concern to California. The Delta is also a complex hydrologic regime influenced by both marine and fresh-water environments. Agricultural production in the Delta islands depends on the availability of fresh water and is important to the economy of the region. However, little information is available about the potential evapotranspiration (ETo) in the Delta, even though such information is crucial for regional and potentially statewide water resources planning and development.
Although installation of weather stations in the Delta is under consideration, presently no reliable stations with long-term, evaporation-related data records are located there. The purpose of this study was to develop simple equations for estimating monthly ETo in the Delta based on long-term weather data available from Lodi and Stockton. Such equations can bridge the gap in ETo data for the Delta until new weather stations are installed.
Evapotranspiration equations
The rate of evapotranspiration from the plant-soil environment depends primarily on the energy available for vaporization from solar radiation, but it also depends on relative humidity, temperature and prevailing wind speed. Several equations have been developed to estimate ETo, ranging from the relatively complex, energy-budget Penman-type equations to simpler empirical relationships that tend to be site specific. In the case of the Delta and the neighboring weather stations at Lodi and Stockton, there are insufficient data available for estimation of ETo from a Penman-type equation over the long term so we have chosen a semi-empirical equation developed for the Davis area by Hargreaves and Samani (J. of Irr. & Drn.Engr. 115[6] 1989). Of 16 stations in or near the Delta, we have chosen to use weather data from the fire stations in Lodi and Stockton because these stations have the longest daily data records of maximum and minimum temperature and precipitation, complete with reliable historical descriptions of the stations.
The Hargreaves and Samani (H-S) equation for ETo explicitly accounts for solar radiation and temperature, and was calibrated using alta fescue grass evapotranspiration from the weighing lysimeters at Davis. Although relative humidity is not explicitly contained in the equation, it is implicitly present in the difference in maximum and minimum temperatures (TD). That is, in regions having a Mediterranean climate, the wide range in day-time high and night-time low temperatures reflects low relative humidities, as compared to more humid environments where the range in daily temperatures is not as great. Similarly, Hargreaves and Samani simplified determination of the solar radiation term by relating it to temperature measurements and latitude. Thus, the final form of the equation appears to account for or compensate for the important climatic factors affecting ETo (with the exception of only partial inclusion of wind-energy effects through temperature), and requires only the latitude of the site of interest and measurement or data of the minimum, maximum and mean daily temperatures.
The H-S equation for reference evapotranspiration, ETo, in units of millimeters per month may be written:
ETo = 0.0023 (Tc + 17.8) R4 √To (1)where Tc is the monthly mean temperature (degrees centigrade) at the site, R4 is the extraterrestrial solar radiation expressed in mm/month, and To is the difference between the mean minimum and mean maximum temperatures for the month (degrees centigrade). Table 1 summarizes values for R4 in the Delta (38°N latitude). The factor 0.0023 includes units of reciprocal centigrade to the 3/2 power to maintain dimensional consistency.
Hargreaves and Samani compared the estimates of ETo from their equation with several other methods for estimating ETo, using data from Haiti, Bangladesh and Australia. They found that the ratio of their estimated ETo to measured lysimeter values was 0.94 with a standard deviation of 3.5%, as compared to an average ratio of 0.91 with a standard deviation of 6.9% for all the other methods. Although the H-S equation compared quite favorably with measured ETo data else-where, and has been recommended as the most practical means of estimating ETo when faced with limited data, we chose to verify the equation further using contemporary weather data from Manteca, a site near our long-term data sites at Lodi and Stockton and adjacent to the Delta.
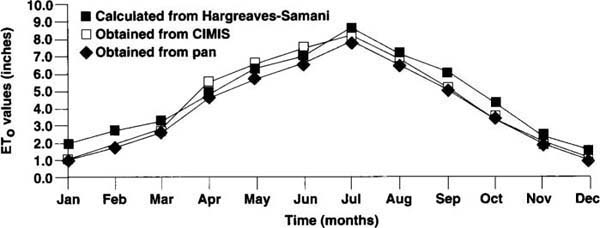
We compared estimates of ETo based on the H-S equation, modified Penman equation (California Irrigation Management Information System, or CIMIS station) and limited evaporation pan data for a pasture near Manteca on a daily and monthly basis for the period 1988 to 1992. Figure 1 compares monthly ETo estimates of the three methods during 1991, and shows close agreement between CIMIS-based estimates of ETo and those of the H-S equation during the early spring to late fall months. During the winter months, the H-S equation overestimates ETo because it does not adequately account for the effects of high relative humidity. Because the critical period for estimation of ETo is the summer months, we chose to develop H-S equation coefficients on a seasonal basis to allow us to correct for seasonal changes.
Weather data analysis
In order to develop the appropriate Delta coefficients for use in the H-S ETo equation, we used a regression analysis to compare estimates of ETo based on the Lodi and Stockton temperature data from 1921 to 1991 with pan evaporation data (adjusted for pan coefficients) measured monthly and considered to be reliable at the Thornton (1963-68), Oakley (1978-90) and Rio Vista (1978-89) stations located in the Delta.

Before comparing the Lodi- and Stockton-based data with that from the Delta stations, we adjusted the data sets for missing or extraneous values to eliminate determination of unrepresentative coefficients that are artifacts of inconsistent data sets rather than of the physical phenomena. Adjustments of the Lodi-Stockton raw data included replacement of a single outlier value by an average of the neighboring values. Similarly, missing pan data was obtained from a moving average of adjacent values; data from the Thornton station required the most completion with interpolated data. Adjusting the raw data yielded data sets that were homogeneous, or selfconsistent, a property that we verified statistically. Finally, we tested the correlation between the Lodi and Stockton mean temperature data from 1921-1991 and found a strong correlation, yielding a near-perfect regression coefficient of 96%.
Linear regression models were used to fit the ETo estimates based on the Lodi-Stockton temperature data with estimates of ETo from the pan evaporation data of the three stations in the Delta. We also tried more sophisticated nonlinear time series models to fit the data, but found that the simpler linear models yielded coefficients that better fit the ETo data, yielding regression coefficients in excess of 95%. The regression analysis was conducted using three subsets of the annual data reflecting the summer and winter seasons; that is, from January to March, April to September, and October to December. Breaking up the annual data in such a fashion also allowed us to compensate for the overestimation of ETo during the winter months by the H-S equation through use of the seasonal regression coefficients. As a result of using the three data subsets, three different seasonally dependent sets of H-S equation coefficients were developed for each station.
ETo estimates for each of the pan stations in the Delta can be determined based on the ETo estimate (Equation 1)from Lodi-Stockton (L-S) temperature data using the following equations:
January-March
ETo (Thornton) = -0.608 + 0.925 ETo (L-S) (2)ETo (Oakley) = - 0.588 + 0.972 ETo (L-S) (3)ETo (Rio Vista) = -0.642 + 1.110 ETo (L-S) (4)April-September
ETo (Thornton) = -0.604 + 0.989 ETo (L-S) (5)ETo (Oakley) = -0.994 + 1.102 ETo (L-S) (6)ETo (Rio Vista) = -1.091 + 1.230 ETo (L-S) (7)October-December
ETo (Thornton) = -0.341 + 0.765 ETo (L-S) (8)ETo (Oakley) = -0.433 + 0.913 ETo (L-S) (9)ETo (Rio vista) = -0.424 + 1.056 ETo (L-S) (10)Delta ETo equations
Finally, in order to estimate average ETo for the Delta based on ETo estimates from the three stations in the Delta, we assigned a weighting factor, based on the Thiessen polygon method, to each of the stations. Although microclimate variability within the Delta may be large, lacking any additional information we assumed that the ETo estimates for each of the Delta stations is representative of its local area. The weighting factors are 0.420, 0.408 and 0.172 for the Thornton, Oakley and Rio Vista data, respectively.
Thus ETo (Delta) from the local pan data, or estimates from the appropriate set of equations from Equations 2-10, is given by
ETo (Delta) = 0.420 ETo (Thornton) + 0.408 ETo (Oakley) + 0.172 ETo (Rio Vista) (11)Combining Equations 1-11 to determine Delta ETo based on the temperature measurements at Lodi-Stockton yields three simple equations for ETo (Delta).
Jan-March: ETo (Delta) = -0.6050 + 0.0022 (Tc + 17.8) Ra √TD (12)April-Sept: ETo (Delta) = -0.8466 + 0.0025 (Tc + 17.8) Ra √TD (13)Oct-Dec: ETo (Delta) = -0.3926 + 0.0020 (Tc + 17.8) Ra √TD (13)Example calculations
As an example of the simplicity of the proposed equations, we estimate Delta ETo for the month of January 1956. The month specifies that we use equation (12) and an Ra value of 213.9 mm/month (table 1). The mean maximum and minimum temperatures at L-S for January of 1956 were 12.0°C and 5.3°C respectively.
Therefore,
TD = Tmax -Tmin = 12.0 - 5.3 = 6.70°C andTc = 1/2 (Tmax + Tmin) = 1/2 (12.0 + 5.3) = 8.65°C.Substituting these values in Equation (12) yields
ETo (Delta) = -0.6050 + 0.0022 (8.65 + 17.8) (213.9) √6.70 = 31.6 mm/monthVerification of equations
As a final verification of our regression-coefficient-based H-S equation for the Delta, we compared our model predictions of ETo with an independently derived model developed by W. O. Pruitt at UC Davis. This step was necessary because we had already used the available ETo data for the Delta to develop our ETo equations; therefore ETo estimates based on an accepted method independent of our own were required. As part of a study for the California Department of Water Resources (DWR), Pruitt estimated monthly ETo for the Delta from 1975 to 1977 using four different methods:
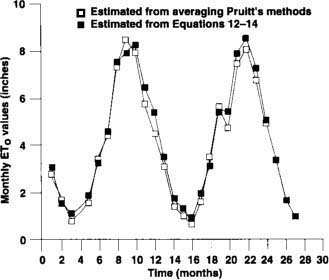
Fig. 2. Comparison of linear regression predictions of the Delta ETo with an independently derived model developed by W.O. Pruitt at UC Davis from October 1975-December 1977.
-
ETo estimated using DWR Bulletin #168 (1978) for Antioch, Brannan Island and Lodi.
-
ETo estimated from adjusted evaporation pan data at Brannan Island for dry months only.
-
ETo estimated from adjusted evaporation pan data at UC Davis for dry months only.
-
ETo estimated by direct measurement of ET using the grass lysimeter at UC Davis.
Our estimates of Delta ETo for 1975-77 closely correlated with the individual estimates of ETo developed by Pruitt. Figure 2 illustrates a similar comparison between our ETo estimates and the average of Pruitt's four methods. Our estimates of ETo compared quite favorably with Pruitt's; for example, the mean ETo estimates for the 27-month period were 4.03 inches and 4.08 inches with standard deviations of 2.64 inches and 2.61 inches for our method and the average of Pruitt's methods respectively, a difference in values of roughly 1%.
Summary and conclusions
Estimation of potential evapotrans-piration (ETo) in a region is often essential to water resources planning and management. We developed a set of simple predictive equations for estimating ETo in the Delta based on temperature data collected from Lodi and Stockton. Although the particular equations apply to the Delta, the approach that we used should apply equally well to most semi-arid regions, especially those that have a Mediterranean climate. Our ETo equations yield values that closely match available data and those of an earlier short-term methodology developed by Pruitt at Davis. Thus the equations for ETo based only on temperature data may be used to estimate monthly Delta ETo over the long term (as early as 1921), as well as in the present, until weather stations are established in the Delta.
New equations estimate evapotranspiration in Delta

