


All Issues
Can retailers depress lettuce prices at farm level?
Publication Information
California Agriculture 49(3):14-18. https://doi.org/10.3733/ca.v049n03p14
Published May 01, 1995
PDF | Citation | Permissions
Abstract
In recent years, lettuce growers have expressed increasing concern that the price consumers pay for lettuce in the grocery store does not reflect the price growers receive for their crop. They contend that the bargaining power of major grocery store chains has led to retail prices that remain persistently high even when farm prices are low. This analysis examined factors that determine the difference between retail and wholesale prices for iceberg lettuce and the price farmers received in four major US. cities: Atlanta, Chicago, Los Angeles and New York. The results suggest that retailer power can indeed depress farm prices, especially when available supplies are high and growers' bargaining power is consequently low.
Full text

Left, lettuce harvest costs run about $3 per 24-head crate and represent 50 to 60% of total lettuce production costs. Although lettuce is grown commercially in several states and many varieties of lettuce are grown, California's iceberg variety, above, is the dominant variety.
Lettuce is California's most important fresh produce crop and ranks ninth in sales value of the state's agricultural products. Sales of lettuce in 1992 totaled $627 million. This industry is significant not only to the California economy but to food buyers across the nation because it provides about three-quarters of the nation's supply of lettuce.
In recent years, the lettuce industry has faced severe economic stress due to declining consumption and increasing international competition. After rising throughout the 1980s, per-capita consumption of lettuce declined from 28.8 pounds in 1989 to 25.9 pounds in 1992. The industry also faces increasing seasonal competition from Mexico. The North American Free Trade Agreement will enhance this competition modestly through gradual phaseout of tariffs presently in the 7% range.
A key issue confronting California lettuce growers is the increasing power of food retailers in the fresh produce marketing system. The majority of lettuce is marketed directly from grower-shippers to retailers. Mergers have consolidated the buying power of large grocery retailers, and independent grocers often pool their resources by purchasing through a common agent. The result is that California vegetable growers are faced with a shrinking number of selling options.
Grower-shippers believe that asymmetry of power in the lettuce marketing chain has led to retail prices that remain persistently high despite volatile farm prices. This concern led frustrated California lettuce growers to place advertisements in major U.S. newspapers in the spring and summer of 1992, questioning why retail prices remained high despite low farm prices. Retailers disputed the growers' claims, arguing that growers fail to appreciate the costs retailers incur in bringing produce from the farm to the consumer.
We studied these conflicting claims for iceberg lettuce, the dominant variety of lettuce grown in California. Our analysis examined the factors that determine the difference between retail and wholesales prices, and the price farmers received, for iceberg lettuce in four major U.S. cities: Atlanta, Chicago, Los Angeles and New York. Our results suggest that retailer power can indeed depress farm prices, especially when available supplies are high and growers' bargaining power is consequently low. We discuss these results in more detail following a brief overview of the lettuce industry and a discussion of price determination processes in the industry.
California's lettuce industry
California owes its strong lettuce production to its rich soil and diversified climate. Unlike other states, California grower-shippers can supply lettuce year around, an attribute highly valued by retailers. Spring, summer and early-fall lettuce production is concentrated in the Salinas-Watsonville area, with early-spring and late-fall production mainly in Fresno County. The Imperial Valley supplies the bulk of winter lettuce. Seasonal competition emerges in the summer from New York, New Jersey and Colorado and in the winter from Arizona, Florida and Mexico.
Fresh lettuce is highly perishable, so rapid shipment to market after harvest is imperative. The use of traditional terminal markets as wholesale outlets for lettuce has declined and the majority of sales are being made directly from farmers to buyer agents representing major grocery store chains, or food service organizations. Sales at the traditional wholesale markets are usually handled by agents, who either purchase lettuce outright for resale or operate on a commission basis.
Lettuce is typically packaged in 24-head cartons and hauled by truck to a cooling facility, where it is examined by buyers. California lettuce is shipped almost exclusively by truck, as opposed to rail, which was common in the 1970s and early 1980s. An emerging industry trend is the processing of lettuce into ready-to-eat salads. This lettuce is sold in bulk bins, with processing facilities located at or near production areas. Large grower-shippers may operate their own processing facilities or provide lettuce under contract to outside processors. An estimated 21.9% of the 1992 lettuce harvest was shipped in processed form. Nearly all processed lettuce is of the iceberg variety.
Price determination
Most families view lettuce and salads as essential components of their diets. These factors contribute to making lettuce demand stable and unresponsive (inelastic) to price changes. Although more lettuce is consumed during summer, consumption in the lowest-demand month, November, is still about 77% of demand in May, the peak consumption month.
Because of its perishability, each week's lettuce harvest effectively represents a new crop with little opportunity to carry supply over from one week to the next. Any weeks harvest is the product of planting decisions made several months before. Thus, the supply in any week is fixed and independent of the current market price. The only exception occurs when price drops so low it does not pay growers to harvest the crop.
Harvest costs, including costs for labor, cartons, and local transportation, average $3 to $3.25 per carton. These costs effectively place a floor under the lettuce price; if prices drop below the cost of harvesting the crop, growers prefer to disk the crop under. Harvest costs represent 50 to 60% of total lettuce production costs so losses are about $2.50 per carton when prices fall to the harvest-cost floor. Figure 1 illustrates weekly farm prices for California iceberg lettuce from January 1991 through July 1992. Roughly one-third of these observations are at or very near the estimated harvest cost, indicating that pricing at the harvest-cost floor is common.
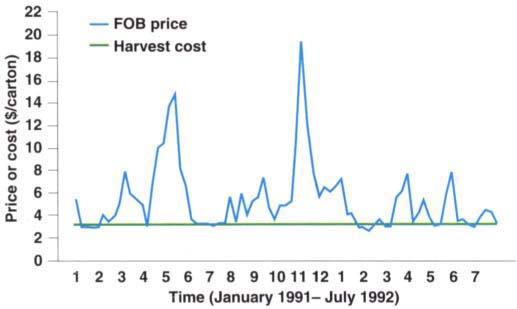
Because of lettuce's perishability, the harvest is vulnerable to weather-related disruptions. For example, extensive rainfall and flooding destroyed portions of the 1992 summer crop for New York and New Jersey and Arizona's 1993 winter crop. This type of disruption coupled with inelastic consumer demand causes extreme price volatility. As figure 1 illustrates, fluctuations of several dollars per carton in the farm price are not uncommon.
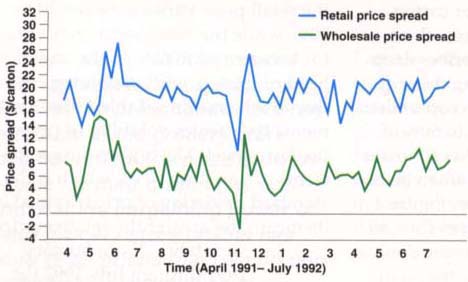
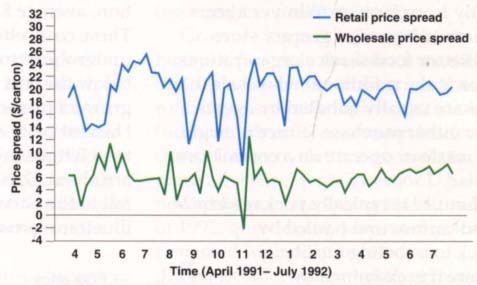
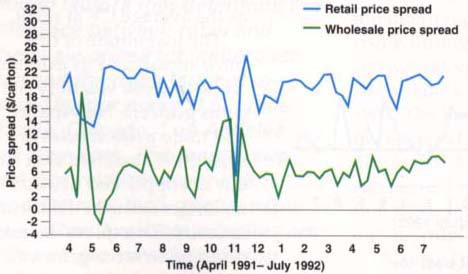
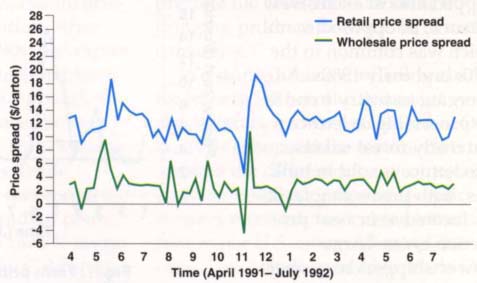
Growers' complaints about lettuce pricing center on the difference between the price consumers pay and the price growers receive for their crop. This price difference is called the farm-retail price spread. The difference between the wholesale and farm price is called the farm-wholesale price spread. These price spreads have been highly volatile (figs. 2-5).
Table 1 provides summary statistics on the price spread for each of the four cities. In each case, the farm share of the retail price varies between 20 to 30%, while the retail sector accounts for between 60 to 65% of the cost of a head of lettuce, with remaining costs due to wholesaling. Table 1 also documents the greater volatility of prices at the farm level. The higher the coefficients of variation (CV), which is the standard deviation of price divided by its mean, the greater the relative price variability. From January 1991 through July 1992 the CV of the farm price was 0.56, about five times as high as the average CV at retail.
The magnitude of this price spread and its extreme week-to-week volatility concerns growers. Newspaper and trade press articles in spring 1992 asserted that “the law of supply and demand” no longer exists in the lettuce industry. To explore the relationship between price and quantity in the lettuce industry, we developed a simple model of price determination (fig. 6).
Marketing costs include wholesaling costs, such as transportation, cooling and palletization (table 1), and retailers' costs. Per-carton transportation costs have averaged about $1 to San Francisco, $2.25 to Chicago, $2.50 to Atlanta, and $3.40 to New York.
Transportation costs are higher in the summer, the period of greatest demand for truck transport. Cooling and palletization charges are about $1 per carton. Retailing costs are difficult to assign to specific products and are a major bone of contention between growers and retailers over lettuce pricing.
The schedule dd in figure 6 represents the maximum price retailers can pay growers per carton after paying marketing costs. If retailers compete vigorously to procure lettuce, the farm price is bid up to the level where the available harvest, L, intersects dd. The farm-retail price spread in this case is determined completely by the level of marketing costs.
The dd curve intersects the harvest cost line, H, at the volume of crop labeled L*. Any volume greater than L* will not be harvested because the resulting retail price less marketing costs is not enough to pay the costs of harvesting. However, in weeks when the available supply is less than L*, a percarton surplus exists that is equal to the retail price minus harvesting and marketing costs. Figure 6 illustrates the amount of surplus per carton for three different harvest volumes, L1, L2, and L3. The surplus is larger for smaller crops due to a higher retail price. The existence of this surplus in weeks when there is a smaller harvest implies a range of indeterminancy for the farm price; the price may vary between the cost of harvesting the lettuce and the maximum price retailers can pay growers. Thus, depending upon the competitive structure of the lettuce industry, supply and demand may not uniquely determine the farm price, and concerns expressed about the pricing system may have credence.
Under conditions of vigorous competition, the entire surplus goes to farmers, and supply and demand do determine price. The reason is that vigorous price competition among buyers will bid the farm price up to the level of the retail price less per-unit marketing costs. But growers assert that lettuce is not marketed competitively. To examine that assertion, we considered two alternatives to the competitive model of lettuce price determination. The hypothesis of the first alternative model is that growers and retailers split any surplus, with farmers receiving a fixed proportion of surplus based upon their relative bargaining power and retailers receiving the rest. The hypothesis of the second alternative model is that relative bargaining power between farmers and retailers is not constant but, rather, depends on weekly market conditions. In particular, we hypothesized that as more lettuce becomes available on the market, either from California or other states, the growers' bargaining position weakens, and their share of the surplus is less. We refer to these two alternative models as bargaining models A and B, respectively.
Statistical analysis
We formulated a statistical model to analyze the weekly farm-retail and farm-wholesale iceberg lettuce price spreads for New York, Chicago, Atlanta, and LA from January 1991 through July 1992. We then tried to determine which alternative model best explained how lettuce prices were set. The basic statistical model specified the weekly price spread per carton of lettuce as a linear function of (1) percarton lettuce transportation costs from California to the consuming city (no transportation cost data for LA were available); (2) the volume of weekly California lettuce sales; (3) the volume of weekly lettuce sales from other states; and (4) the volume of weekly lettuce production occurring near the consuming city. Among the non-California cities, only New York City with summer production from New York and New Jersey had significant local production. Marketing costs for cooling, palletization, and retailing were relatively constant over the time period and should not have contributed to the volatility in price spreads illustrated in figures 2 through 5.
In addition to this model, we also estimated a model to test whether direct changes in the farm price affected the price spread. If farm price changes are passed swiftly from farm to retail or wholesale, they should have little effect on the price spread. However, if, as growers contend, decreases in the farm price are not immediately reflected in lower retail prices, then the farm price will be inversely correlated with the price spread. In other words, as the farm price goes down, the price spread will increase if retailers do not lower consumer prices by the same amount.
The key variables in testing the competitive model of price determination versus bargaining models A or B are the volumes of weekly lettuce sales from California and other states. If lettuce is marketed competitively, the farm-retail price spread should not be significantly affected by the amount of lettuce sold, as figure 6 indicates. Alternatively, if bargaining model A best describes pricing in the lettuce industry, the farm-retail price spread should decrease as the amount of lettuce sold increases. This model hypothesizes the price spread to consist of marketing costs plus retailers' fixed share of the surplus which, as figure 6 illustrates, decreases as the volume of lettuce shipped increases.
Only bargaining model B admits the possibility that the weekly farmretail price spread may be positively correlated with the volume of lettuce shipped during that week. Here the price spread consists of per-unit marketing costs plus retailers' variable share of the surplus. The amount of surplus per carton decreases as the volume of sales increases. But bargaining model B hypothesizes that retailers' share of that surplus actually increases because a large crop diminishes growers' relative bargaining power and enables buyers to more easily bid down the farm price. If the surplus does not shrink significantly and the retailers gain a larger share of the surplus, the farm-retail price spread will increase as the volume of lettuce shipped increases.
Results
We estimated the wholesale and retail price-spread models for each city as a system of seemingly unrelated equations. The results rather strongly support bargaining model B, wherein growers' bargaining power is diminished by large supplies of lettuce, either from California or elsewhere (table 2). The result is a higher price spread during periods of higher supply. Consider first the basic farm-retail price spread model in column 1, which excludes the farm price as an explanatory variable. Higher transportation costs induce higher price spreads as expected in each city. However, higher volumes of lettuce shipments from both California and non-California locations are also associated with higher price spreads in each city, and the effect is statistically significant in all except one instance. This result is only compatible with bargaining model B.


Fig. 6. Price determination in the California lettuce industry. The relationship between price and quantity demanded at retail is summarized by the demand curve labeled DD. The crop available for harvest in a given week is denoted by L. L* is the largest volume of lettuce that will elicit a price sufficient to cover harvest costs. The curve labeled dd represents the maximum price a retailer can pay for a carton of lettuce, the retail demand curve (DD) minus retailers' marketing costs (M). Ht represents the growers' lettuce harvest costs per carton in a weekly period. Surplus (S) is the profit available after subtracting harvest costs from the maximum price a retailer can pay. S1, the largest price margin, corresponds with L1, the smallest lettuce crop, and so on.
Inclusion of the farm price in the farm-retail price spread model (column 2) affects the results in an interesting and illuminating way. The negative coefficient for the farm price variable indicates that lower farm prices are associated with higher farm-retail price spreads. In all cases the effect is statistically significant. The value of these coefficients suggests that 12.5% (New York) to 33.8% (Atlanta) of the cost savings from a decrease in the farm price was not passed immediately back to consumers. Also note that the coefficients for the lettuce sales variables are lower than in the model with the farm price excluded. This suggests that the effect of higher shipments on the price spread is primarily due to the farm price, as hypothesized in bargaining model B. When the farm price itself is included as an explanatory variable in the statistical model, it accounts directly for some of this effect, thus reducing the explanatory power of the variables measuring the amount of lettuce sales from California and elsewhere.

We computed the percentage change in the price spread that resulted from a 1% increase in either California or non-California lettuce sales. These “elasticities,” when evaluated at the sample means, range from 0.05 (Chicago) to 0.17 (New York and Atlanta) for increases in California sales and from 0.05 (Chicago) to 0.09 (LA) for increases in non-California lettuce sales. For example, a 1.0% increase in California lettuce sales can cause a 0.17% increase in the farm-retail price spread for lettuce in New York and Atlanta, when other variables are held constant.
The farm-wholesale price spread equations in table 2 afford an interesting comparison to the farm-retail price spread equations. Wholesale terminal produce markets are perhaps the quintessential competitive markets, usually featuring many buyers and sellers and a standardized product. However, in the lettuce industry nowadays they represent residual markets for produce that is not sold directly from the field to retailers, food service organizations, or processors. For the basic model excluding the farm price (column 3), we find that the lettuce sales variables have little effect on the price spread; none are statistically significant. This outcome is predicted by the competitive markets model. Inclusion of the farm price in the equation (column 4) did not appreciably change the results.
Lettuce traveling by truck from California to eastern markets may spend up to a week in transit. Changes in the California farm price might reasonably impact prices in eastern markets with up to a week's lag. To test this possibility, we recomputed the wholesale and retail price spreads to incorporate a one-week lag in price transmission, that is, the price spread was computed as the retail or wholesale price in “week t” minus the farm price in “week t-1”. Re-estimating the statistical models for this revised price spread definition did not change the results in any important way.
Conclusion
The results of our study support growers' contention that the market power of large food retailers causes higher farm-retail price spreads. In particular, the results show that farmretail price spreads are higher during periods of high supply as buyers apparently use abundant supplies as leverage to bid down farm prices. These lower prices are not passed on fully to consumers.
Growers' energies in combating retailer power so far have focused primarily on the power of food chains to maintain high lettuce prices despite low farm prices. Growers have argued that lower retail prices would move more lettuce, thereby raising farm prices. However, given the inelasticity of lettuce demand, sales at retail are rather invariant with respect to price. Our results suggest that attention should be placed directly on the issue of buyers' power in the farm-level market and on low farm prices per se. High retail prices can work to growers' advantage if these prices stimulate correspondingly high prices at the farm level. However, our analysis indicates that the prevailing market structure in the California iceberg lettuce industry favors buyers over sellers and results in lower farm prices and higher farm-retail price spreads than would otherwise occur.
Can retailers depress lettuce prices at farm level?

