


All Issues
Drought takes toll on Central Coast's native oaks
Publication Information
California Agriculture 47(6):4-6.
Published November 01, 1993
PDF | Citation | Permissions
Abstract
From 1987 through 1992, California experienced one of the most widespread and severe droughts in the state's history. A survey conducted in three Central Coast counties during 1988–92, indicates that many native oak trees on rangelands succumbed to the drought. The smaller oak trees on poorer sites were most vulnerable.
Full text
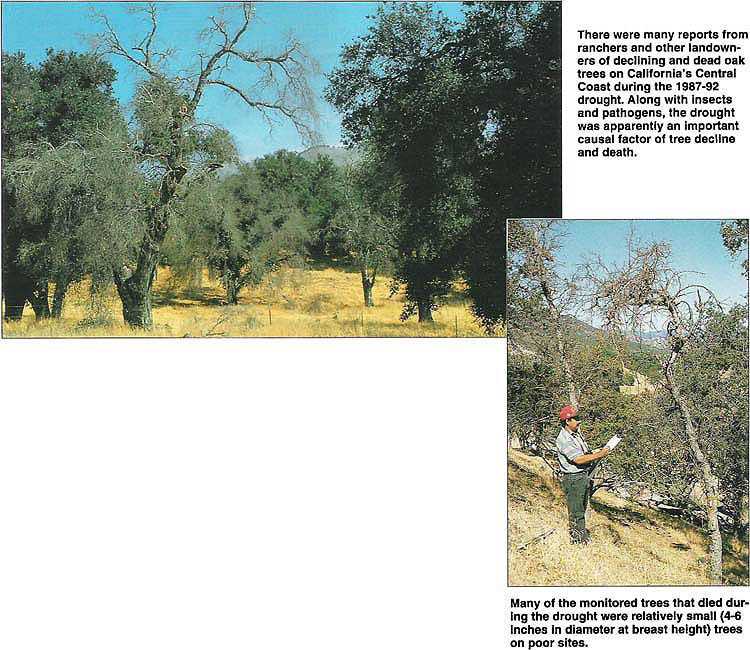
There were many reports from ranchers and other landowners of declining and dead oak trees on California's Central Coast during the 1987–92 drought. Along with insects and pathogens, the drought was apparently an important causal factor of tree decline and death.Many of the monitored trees that died during the drought were relatively small (4–6 inches in diameter at breast height) trees on poor sites.
In 1992, California entered the sixth year of the worst drought the state has experienced this century. The drought was especially severe on the California Central Coast. Although native oak (Quercus spp.) trees are well adapted to periodic drought, the severity of the latest drought has apparently contributed substantially to the decline and death of many trees. For the past several years, UC Cooperative Extension offices have received numerous reports from ranchers and homeowners that oak trees on their lands have died. Although it appears the 6-year drought is finally over, its effects on populations of native oaks may be here for a long time to come.
The period of the 6-year drought (1986–87 to 1991–92) coincided with a long-term study of acorn production of valley oak (Quercus lobata), blue oak (Q. douglasii) and coast live oak (Q. agrifolia). In 1988, we established permanent plots in Santa Barbara, San Luis Obispo, and San Benito counties. Along with several other variables, the status or vigor class of each tree on the permanent plots was recorded each fall, 1988 to 1992. Here, we report tree and site characteristics and the number of trees that severely declined or died during 1988 to 1992.
Methods
During summer and fall 1988, in Santa Barbara, San Luis Obispo, and San Benito counties, one-tenth-acre plots were located within stands of blue oak, coast live oak and valley oak, using a systematic-random sampling strategy. We established plots at predetermined intervals 200 feet from a road in the cardinal direction nearest to perpendicular with the road. Plots had a minimum of 10% oak canopy cover and at least three oak trees measuring 4 inches in diameter at breast height (dbh) or 4.5 feet from the ground. We excluded any plot not meeting these criteria.
We established 32 plots, 12 in Santa Barbara County, 7 in San Luis Obispo County, and 13 in San Benito. All of the plots were located on oak woodland grazed by cattle. Within the plots, the trunks of single-trunked oak trees and all the stems of multiple-trunked oaks over 4 inches dbh (all referred to as “trees” in this article) were marked in 1988 with numbered aluminum tags for permanent identification. We marked 401 trees — 36 valley oak, 115 blue oak and 250 coast live oak. The number of trees per plot ranged between 3 and 34 (average 12.5).
In late August to October 1988, we recorded for each marked tree the species, tag number, dbh (inches), height (ft), and its position in the canopy (i.e., whether the tree was growing completely under the canopy of other trees, “overtopped,” or whether it formed the canopy, “not overtopped,”) along with the slope and aspect of each plot. The status of trees was visually evaluated for the proportion of the tree with branch and foliage dieback; dead branches accessible from the ground were often examined manually for dryness and brittleness. Trees with greater than 50% dieback were classed “declined,” and trees that were entirely brown and leafless were classed “dead.” All other trees were classed “healthy.”
Using the method developed by the California Department of Fish and Game, trees were also ranked 1 to 4 based on the number of acorns observed — 1 for no acorns to 4 if acorns occur on the entire tree and limbs sag from the weight. Acorn production was low from 1988 through 1992 as explained for 1988 and 1989 on pages 161–163 in Proceedings of the Symposium on Oak Woodlands and Hardwood Rangeland Management (Garcia, S., W. Jensen, W. Weitkamp, and W. Tietje. 1990. Acorn yield during 1988 and 1989 on California's Central Coast. Gen. Tech. Rep. PSW-126, Berkeley, CA: Pacific Southwest Forest & Range Experiment Station). To further characterize the plots, we also recorded brush and ground cover present, wildlife signs (droppings and digging) and tree-harvesting history. Results of these measurements are not reported here.
Results
Rainfall
For the 6-year drought period of 1986–87 to 1991–92, total rainfall averaged 16%, 20% and 26% below normal for Santa Barbara, San Luis Obispo and San Benito counties, respectively. Annual rainfall, moreover, fell below the 30-year annual average 3 years and 5 years of the 6 drought years in Santa Barbara and San Luis Obispo counties, respectively, and all six of the drought years in San Benito County (fig. 1).
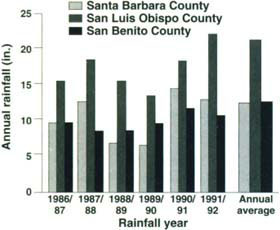
Fig. 1. Total annual rainfall recorded at weather stations in Santa Barbara (Santa Maria), San Luis Obispo (California Polytechnic State University) and San Benito (Hollister) counties during the 1986/87 to 1991/92 drought compared to the 30-year average annual rainfall for each county.
Tree mortality
At initial tagging in 1988, all of the trees were alive and healthy. Declined and dead trees began to show up on the plots when acorn production measurements were taken in late summer and fall 1990. By 1992, 10% (39 trees) of the 401 trees on the 32 plots were either declined (6%) or dead (4%).
Chi-square analysis showed a significant difference in tree vigor class among Santa Barbara, San Luis Obispo, and San Benito counties (table 1). The difference was due to the relatively large percent (14%) of trees classed declined in San Luis Obispo County compared to Santa Barbara (3%) and San Benito (1%) counties.
The drought took about an equal toll on each of the three oak species. There were no significant differences by chisquare test in the proportions of declined or dead valley oak (8%), blue oak (13%) and coast live oak (8%) trees in 1992 (table 2). Moreover, the proportion of declined trees to dead trees was similar for each oak species (6% declined vs. 3% dead for valley oak; 5% vs. 8%, respectively, for blue oak; and 4% vs. 5%, respectively, for coast live oak).
Tree characteristics
Tree and stand characteristics examined in this study that may have affected susceptibility to the drought are tree size and dominance status.
The product of tree dbh and height was used as a tree size index. Significantly more small trees — as determined by t-test — succumbed (classed declined or dead) during the drought than larger trees (size index = 327 and 426, respectively), regardless of species. By species, more smaller blue oak (size index = 130 vs. 278) and coast live oak (size index = 252 vs. 407) trees were declined or dead than larger trees; the difference was significant by t-test for blue oak. Although declined or dead valley oak trees were larger than healthy trees (size index = 1,847 vs. 1,009, respectively), the difference was not significant according to t-test. The sample size (n = 3) of declined and dead valley oak trees is too small to conclude that the size difference was not due to chance alone.
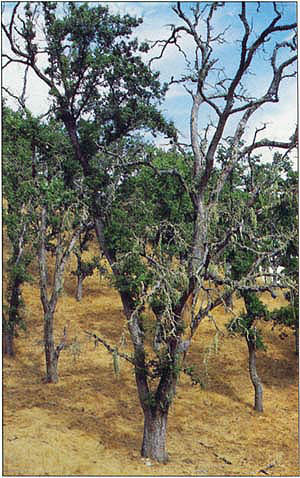
In some cases, dieback of monitored trees did not occur over the entire tree. Here, a large branch of a valley oak tree has died; the valley oak behind it also died during the drought.
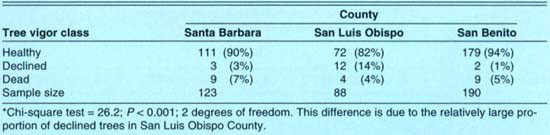
TABLE 1. Distribution of 401 oak trees in vigor classes by county in 1992 on 32 plots monitored 1988–1992*
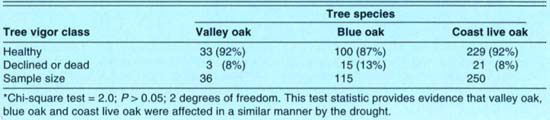
TABLE 2. Distribution of 401 oak trees in vigor classes by species in 1992 on 32 plots monitored 1988–1992 in Santa Barbara, San Luis Obispo and San Benito counties*
With valley oak, blue oak and coast live oak trees combined, chi-square tests indicated a larger proportion of the overtopped trees had declined or died (19%) than trees that were not overtopped (8%) (table 3). Separate chisquare tests for each species indicated that this difference resulted entirely from the large proportion (29%) of overtopped coast live oak that had declined or died; no trees were classed declined or dead among overtopped valley or blue oak trees. This between-species difference probably was due simply to the dense stands of coast live oak used in this study compared to the relatively open stands of valley and blue oak.
Aspect and slope effects
The ability of a site to support oak trees is affected by soil moisture and soil depth. These factors are influenced by degree of irradiation from the sun, which is related directly to site exposure and slope. Values that quantitatively integrate orientation of terrain and slope (solar insolation values) have been developed for coastal central California by E. C. Frank and R. Lee (1966. Potential solar beam irradiation on slopes: tables for 30° to 50° latitude. Res. Paper RM-18. Fort Collins, CO: Rocky Mountain Forest and Range Experiment Station, Forest Service. U.S. Department of Agriculture. 116 pp.). The solar insolation values become larger with increasing slope and southern orientation (table 4).
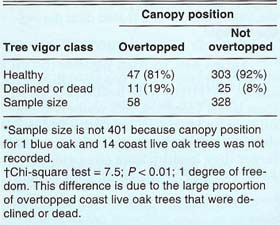
TABLE 3. Distribution of 386* oak trees by canopy position (i.e., overtopped or not overtopped) on 32 plots monitored 1988–1992 in Santa Barbara, San Luis Obispo and San Benito counties°
Using information from Frank and Lee (1966) and table 4, we assigned a solar insolation value to the trees on each plot. The average solar insolation value of declined and dead trees (259 kilogram calories/0.15 in2/year) was significantly larger by t-test than the solar insolation value for healthy trees (249 kilogram calories/0.15 in2/year). This indicates that more trees died on plots with southern orientation. Such sites usually have poorer, more shallow soils.
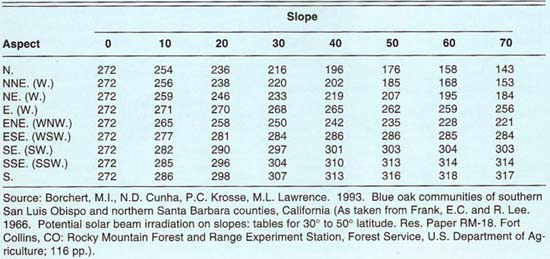
TABLE 4. Values of potential annual solar insolation (kilogram calories/0.15 in2/year) for 34° latitude
Conclusions
Little information is available on annual mortality rates of California oak trees. However, the high level of decline or death of oak trees recorded during the drought was apparently higher than the long-term average rate of oak stands in the absence of fire, insect infestation, severe drought or other catastrophic events. It is higher than the mortality recorded by the Forest Service's Pacific Northwest Research Station as part of a long-term inventory of oak trees on sample plots in California (pers. comm., Chuck Bolsinger, Research Forester, Pacific Northwest Research Station).
This rate of mortality may be problematic to the extent that the oak trees which die are not replaced. Continual thinning without replacement will lead to open stands with just a few remnants and, eventually, loss of the stand.
The 6-year period of 1986–87 to 1991–92 was the driest this century for most parts of California. The effect on the Central Coast was even more severe than on other areas of the state. It is not often, however, that there is a single causal factor in decline and mortality of oak trees. Drought stress lowers the trees' defense mechanisms, making them more susceptible to mortality factors such as decay fungi and boring beetles. Most likely, drought pushed some oak trees over the edge that would have persisted otherwise.
Several circumstances implicate the drought as an important causal factor. First, most tree mortality occurred on the more steep terrain with southern exposure. Since such sites receive more solar irradiation, they typically are drier with shallower, more infertile soils than more gentle slopes with other orientations. Second, in many areas of oak woodland during the drought, blue oaks lost their leaves in August, about three months “ahead of schedule.” Researchers attributed early leaf fall to tree stress due to depleted soil moisture. Finally, many ranchers and other landowners reported the occurrence of dying and dead trees on their lands during the drought years.
Relatively high mortality of oak trees during periodic severe drought may simply be nature's way of regulating the distribution and abundance of oaks in California. However, anthropogenic stresses placed on California native oaks over the past 100 years have resulted in poor regeneration of some species and increased removals. Today, periods of high mortality may not be compensated by regeneration. Drought stress may be one more reason that we need to be careful and wise in making decisions relating to oak woodland. We will continue to monitor plot trees for several more years to further evaluate the effects of 6 years of drought on native California oaks.
Drought takes toll on Central Coast's native oaks

