


All Issues
When measuring soil water content, field practices affect neutron moisture meter accuracy
Publication Information
California Agriculture 47(6):29-31.
Published November 01, 1993
PDF | Citation | Permissions
Abstract
Field practices for measuring soil water content with neutron moisture meters were assessed. One finding: Using meters of the same manufacturer with different components (such as different types of detector tubes) or meters of different manufacturers can greatly alter performance and affect results. Guidelines were developed for making standard counts and for making counts in the soil.
Full text
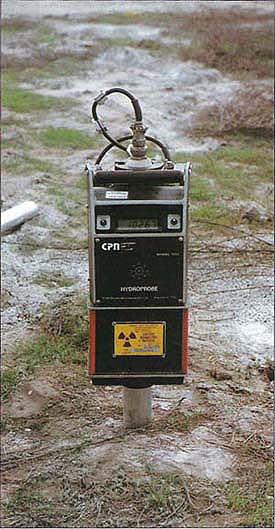
The neutron moisture meter has been a valuable and time-saving instrument for monitoring soil water content. Initially used by scientists for research, the neutron meter is now used by state and federal agencies, private consultants and growers to monitor soil water content for irrigation scheduling.
The neutron meter indirectly measures soil water content by first emitting fast neutrons from a radioactive source. As the neutrons speed through the soil, they lose energy and are slowed by collisions with hydrogen particles. This results in a “cloud” of slow neutrons in the vicinity of the detector of the neutron probe. The higher the soil water content, the denser the cloud of slow neutrons.
Operation of the neutron meter requires installing an access tube in the soil. The meter is mounted on top of the access tube, and the source tube (which contains both the radioactive source that is emitting fast neutrons and the slow-neutron detector) is lowered into the access tube. The source tube is lowered to a particular depth and a count is made. The operator makes a standard count periodically to monitor the meter's performance and to identify any problems with its operation. (A standard count is a set of counts made with the source tube installed inside the meter's shielding; each standard count should be made under similar conditions.)
The amount of hydrogen in the soil mainly depends on soil water content and soil organic matter content. Soil mineralogy may also influence the amount of slow neutrons. These factors require that a calibration curve be used to relate counts of the neutron moisture meter with soil water content. Calibration curves are developed by sampling the soil over a range of water contents and obtaining a neutron meter count for each sample.
Widespread use of the neutron meter has resulted in a diversity of practices. Some operators use aluminum access tubing; others use steel or plastic. Neutron meters are frequently interchanged without considering differences in each meter's performance. Also, standard count checks may be made under a variety of conditions, such as with the meter on the ground surface, in vehicle trunks, on top of the instrument's carrying case, and so on.
In response to questions concerning use of the neutron meter in measuring soil water content, a study was conducted to determine:
Effect of access tubing material
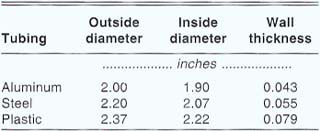
Measurements were made in fine sand, loam, stratified clay loam and clay loam soils using aluminum, steel and plastic (PVC Schedule 125) tubing. Tubing dimensions are shown in table 1. Calibration curves were developed by sampling the soil at 6-inch depth intervals with a Madera sampler. The access tube then was installed in the hole used for soil sampling. Measurements were then made with the neutron meter at 6-inch intervals to 5 feet deep. Counting time was 30 seconds. Soil water contents, obtained from the samples, were then correlated with the counts.
Figure 1 shows the counts versus depth for the three tubing materials for the clay loam (fig. 1a) and the fine sand (fig. 1b). For the clay loam soil, the highest counts occurred with aluminum access tubing and the lowest counts with plastic tubing. Counts with steel tubing were about midway. As the counts increased with depth, differences between counts of the various tubing also increased. Similar behavior also occurred for the loam and stratified clay loam sites. For the fine sand, however, little difference in counts with access tubing material occurred because of the very low counting rate in this soil.

Fig. 1. Counts per depth for aluminum, plastic and steel access tubing in (a) a clay loam soil and (b) a fine sand.
Figure 2 shows the calibration curves for the clay loam site for each access tubing material. For a given water content, a higher count occurred for aluminum tubing, an intermediate count for steel tubing and a relatively low count for plastic tubing. The slope of the calibration curve was the smallest for plastic tubing and the highest for aluminum tubing. Since the slope of the calibration curve is the change in counts with change in water content, this behavior indicates that the count sensitivity to changes in water content is the largest with aluminum tubing and the smallest with plastic tubing. This behavior was consistent at all sites except for fine sand.
The behavior in figures 1 and fig. 2 is caused by material in the tubing which absorbs neutrons. Data from the International Atomic Energy Agency (Vienna) show that chlorine can absorb many more neutrons than either iron or aluminum. Iron is a distant second and aluminum has little ability to absorb neutrons. Thus, the chlorine in plastic (PVC) tubing causes the smallest counts because of neutron absorption. Counts in steel tubing are relatively higher compared with plastic because iron absorbs far fewer neutrons than does PVC. Counts are highest in aluminum tubing because relatively little neutron absorption occurs in this material. Absorption of neutrons also changes the slope of the calibration curve (fig. 2). Using aluminum access tubing would allow a neutron meter to sense a smaller change in soil water content because neutron absorption by aluminum is very small.
Interchanging moisture meters
Counts were made in polyethylene plastic cylinders with five neutron water content meters. Wall thickness of the cylinders ranged from 0.45 to 2.95 inches. Calibration curves of counts versus wall thickness were developed for each water content meter. Four of the meters were of the same manufacturer, each with a source strength of about 50 millicuries. The fifth meter had a source strength of about 10 millicuries.
Figure 3a shows the calibration curves for the plastic cylinders. A considerable difference exists in the counts among the four meters of the same manufacturer. For a wall thickness of 1.28 inches, counts ranged from about 12,000 per 30 seconds to about 17,000 per 30 seconds. Differences in counts among the meters increased as the wall thickness of the cylinders increased. Relatively small counts occurred for the meter with the 10 millicurie sources, which would be expected. Water content meters of the same manufacture can vary in count rate, probably because of variability in the source strength and differing characteristics in the instrument's electronics.
If a count ratio (actual count in the cylinder divided by a standard count) is used, differences among meters of the same manufacturer become negligible (fig. 3b). Calibration curves for plastic cylinders were the same for practical purposes for the four meters. However, for the water content meter with the smaller neutron source, the calibration curve still differed considerably from the curves of the other instruments.

Use caution in interchanging meters if an instrument is repaired or components upgraded. This may change the calibration curve. Figure 4 shows calibration curves for two water content meters of the same manufacturer, but with considerably different 30-second standard counts, indicating different detector characteristics. The calibration curves made in a sandy loam soil show large differences in the behavior of the two instruments, even though count ratios were used.
These results indicate that if the count ratio is used, meters of the same manufacturer with similar components can be interchanged. Meters with very different characteristics should not be interchanged unless a correction factor is used to adjust the calibration curve. More research is needed, however, before a procedure can be recommended.
Standardized method for counts
Frequent standard counts should be made to monitor the performance of the meter and to calculate the count ratio. The standard count normally is made with the radiation source locked in the instrument's shielding. The height of the meter above the ground or other surface — such as the carrying case — must be sufficient to prevent any surface reflectance interference. The horizontal distance between the meter and any body of matter high in hydrogen affecting the standard count, such as the operator or the presence of another neutron meter, should also be of concern. Meter shielding is only 30 to 70% effective. Escaping neutrons may be reflected back into the meter and increase the standard count.
The heights and distances at which interference occurred were determined by first positioning the instrument at various heights aboveground and then taking 30 counts, each 30 seconds long. The instrument was then positioned at various horizontal distances from a 5-gallon container of water and from another neutron water content meter.
Results show that for heights greater than 19 inches, the ground surface had little effect on the standard count. Measurements made at heights greater than 19 inches showed statistically insignificant differences from the measurement made at 19 inches; counts made at heights less than 19 inches showed statistically significant differences from that made at the 19-inch height. The recommended minimum horizontal distance between the probe and any material that could affect the standard count is about 25 inches. No statistical differences existed for counts made at distances greater than 25 inches compared with the count at 25 inches; counts at distances less than 25 inches were statistically different. However, the minimum distance between a second meter and the meter used for the standard count should be at least 16 feet.
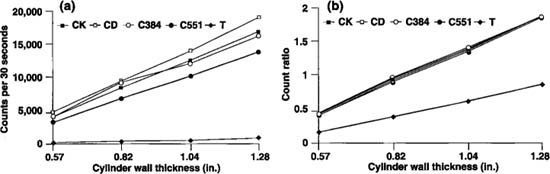
Fig. 3. Calibration curves for five neutron meters between wall thickness and (a) counts and (b) count ratio.
Counting time, counts per depth
Both the most appropriate counting time and the number of count measurements per depth were investigated by making 30 counts in each plastic cylinder. Count times of 15, 30 and 60 seconds were used. Counts were made with two neutron probes with respective 30-second standard counts of 10,382 and 29,808. Statistical sampling theory was used to calculate the number of count measurements needed for errors of 1 and 2% at a confidence level of 90%. These results then were used to calculate the potential maximum count ratio error, affected by both the actual count error and the standard count error, and the potential maximum error in water content calculations. (The count ratio is the actual count in the soil divided by the average standard count. The count ratio error is the difference between the count ratio calculated from one or two counts and the count ratio calculated from 30 counts.) Four different calibration curves of water content versus count ratio were used to determine potential errors in calculating water content.
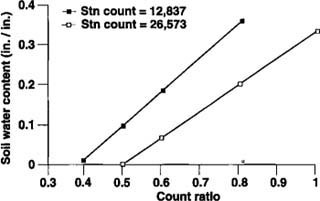
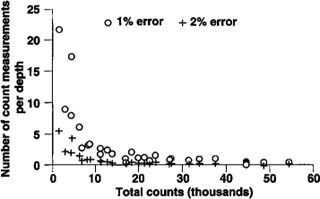
Figure 5 shows how the number of count measurements needed to obtain errors of 1 and 2% at a confidence level of 90% varies according to total count. The data sets show that as total count increases, fewer count measurements are needed. Also, fewer count measurements are needed for the larger error. For counts greater than 25,000 to 30,000, a one-count measurement per depth is adequate for a 1% error. One measurement is needed for counts of 6,000 to 7,000 with a 2% error. A one-measurement sample will result in an error of less than 2% for total counts greater than 6,000 to 7,000. The counting time per se did not affect the sample size, except as it affected the total count. Thus, 15-second counts with the meter with the high standard count gave results similar to that of the 30-second counts with the other meter.
Errors in water content calculations due to counting errors depend on errors in actual soil count and in the standard count. The potential maximum water content errors were assessed for a standard count value based on one count only, an average of five counts and an average of ten counts. If only one count was used, the average water content error (based on the four calibration curves) was 5.2%. The error was 3.3% for a standard count value based on the five-count average and was 3.1% for the ten-count average. Differences in errors were statistically significant (90% confidence level) between the one-count value and the five-count average. Differences between the five- and ten-count average were not statistically significant. This indicates that a standard count based on one count only could result in relatively large errors and that a ten-count average was no better than a five-count average. However, a five-count average did significantly reduce error and is the recommended procedure.
Summary
When measuring soil water content, field practices affect neutron moisture meter accuracy

