


All Issues
California's apple industry gets a new fresh look
Publication Information
California Agriculture 47(6):15-18.
Published November 01, 1993
PDF | Citation | Permissions
Abstract
A “new” apple industry based on fresh market sales of the Granny Smith, Fuji and Gala varieties has recently been established in California's Central Valley. Production, already significant, will continue to grow as new plantings reach maturity and additional investment in marketing infrastructure will be required.
Full text
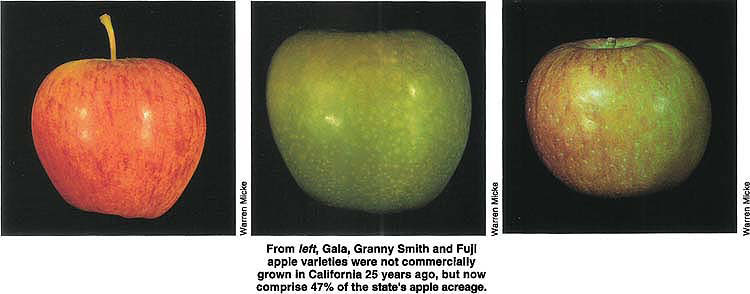
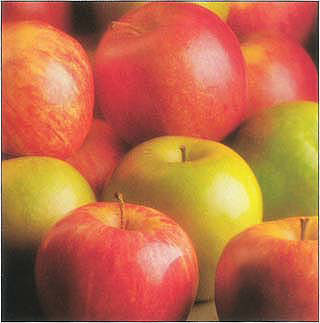
From left, Gala, Granny Smith and Fuji apple varieties were not commercially grown in California 25 years ago, but now comprise 47% of the state's apple acreage.
The California apple industry has recently undergone significant changes and now appears much different than it did 20 to 25 years ago. Apple production was formerly centered in Sonoma and Santa Cruz counties, with an emphasis on the Gravenstein and Yellow Newtown varieties which were utilized primarily for processing into canned, juice, frozen or dried products. Production is now centered in the San Joaquin Valley, with an emphasis on the Granny Smith, and more recently, Fuji and Gala varieties for sale in the fresh market. The California apple processing industry has been affected by production adjustments and has also undergone significant changes. This article outlines the nature of changes that have occurred, economic factors underlying these changes, and some of their economic implications.
California's position in the U.S.
The U.S. Department of Agriculture reports commercial apple production in 36 states. California apple production typically ranks within the top four states in the United States even though apples account for only about 1.5% of the total area devoted to tree fruits and nuts in California. Washington state, with 45 to 50% of total U.S. apple production, is the dominant apple producing state. U.S. apple production totaled 9,871 million pounds in 1991. Production levels in the leading states in 1991 were: Washington, 4,300 million pounds; New York, 1,050 million pounds; Michigan, 880 million pounds; and California, 800 million pounds. Other states with an annual crop of 100 million pounds or more each year during 1989–1991 included Pennsylvania, Virginia, North Carolina, West Virginia, Oregon, Idaho and Ohio.
Many different varieties of apples are produced in the U.S., with regional differences based on both climate and traditional market outlets. Some varieties are best suited for processing (Gravenstein), others for fresh consumption (Red Delicious), some are dual purpose (Golden Delicious, Yellow Newtown). The importance of different varieties has changed over time. Washington, which produces for the fresh market, has concentrated on highly colored and uniquely shaped Red Delicious apples. California, because of weather conditions and a well-developed processing industry, has tended to produce a higher than average proportion of yellow- and green-colored apples, with a shift in varieties over time as producers have attempted to sell more apples in the fresh market. The most popular varieties in eastern states are Red Delicious, McIntosh, Golden Delicious, Rome Beauty and York. The most popular variety in the central states is Jonathan, followed by Red Delicious and McIntosh.
Producer returns for apples sold in the fresh market are typically much higher than for those processed. These price differences, which vary by location, variety, year and processing use, range from fresh prices twice as high as processing to five times as high, or even higher. Thus, there is a clear monetary incentive to produce for the fresh market.
Washington apple producers typically sell 70 to 80% of their annual production in the fresh market; California producers have increased the proportion of fresh market sales, but statewide fresh sales are still less than 50% of total production. Adjustments associated with California's increase in fresh market sales are discussed.
Apple acreage changes
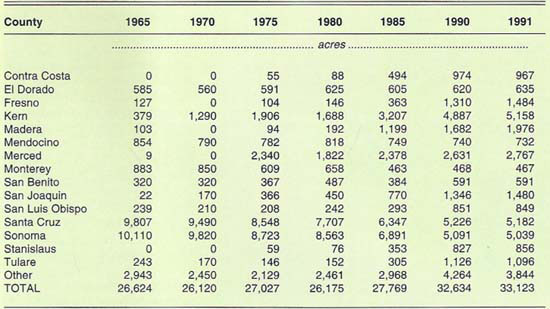
Commercial plantings of apples are reported in 48 of California's 58 counties, but only 26 counties have reported more than 100 acres of apple trees. Apple acreage is concentrated in four geographic areas. The principal producing counties in these areas are as follows: North Coast — Sonoma and Mendocino; Central Coast — Contra Costa, Santa Cruz, Monterey and San Benito; Sierra foothills — El Dorado; and San Joaquin Valley — Fresno, Kern, Madera, Merced, San Joaquin, Stanislaus, and Tulare. Production conditions are not always uniform within an area. For example, climatic conditions in the Brentwood area of Contra Costa County are more like the Central Valley than the coast and conditions in the Tehachapis in Kern County are similar to the Sierra foothills. As shown in table 1, Sonoma County (38%) and Santa Cruz County (37%) accounted for the majority of California apple acreage in 1965. Total California apple acreage increased from 26,624 acres in 1965 to 33,123 acres in 1991 (24.4%), with the majority of the increase occurring after 1985. Apple acreage in the two major traditional production areas decreased significantly; at the same time, large new plantings were being developed in the San Joaquin Valley. By 1991, major San Joaquin Valley producing counties accounted for 46.1% of total California apple acreage; the shares in Sonoma and Santa Cruz counties had decreased to 15.2% and 15.6%, respectively.
Important economic factors underlie the dramatic shifts in location of California apple production. Differences in levels of returns in major production areas are a function of differences in average yields and prices, with average prices highly related to fresh market sales in each area. Following is a brief discussion of economic factors in each major area.
Sonoma County apple production, because of the varieties that have been grown, has been largely utilized for processing. Gravenstein and Rome Beauty have a reputation for providing above-average yields of processed product per ton of raw apples and usually bring an above-average processing price. Processing sales, for example, accounted for an annual average of 86.6% of total Sonoma County apple sales during 1984–1988. The majority of orchards in Sonoma are relatively old, nonirrigated and with wide spacing between trees. In 1982, some 47% of Sonoma County apple orchards were more than 40 years old and 70% of the Gravenstein acreage were more than 50 years old. The average age of orchards has probably increased, even with significant removals. Many orchards have been neglected. On a countywide basis, average yields are relatively low and quite variable. The combination of relatively low average yields and low average prices (because of the low proportion sold fresh) provides per-acre returns that often do not cover cash costs of production.
The reduction in Sonoma County apple acreage shown in table 1 has been associated with a transition from apple to premium wine grape production. Wine grape returns have exceeded those for apples, and wine grape production has been more popular and glamorous than growing apples.
A significant portion of land formerly devoted to apples is now planted with premium wine grapes; some land has also been converted to urban uses. The North Coast apple industry also suffered a severe shock in the early 1980s when the Sebastopol Cooperative Cannery, the largest apple processor in California, encountered financial difficulties and had its assets seized by its major lender. As a result, cooperative members received only $3.50 per ton for the 1980 crop and $13.09 per ton for the 1981 crop, in addition to losing their equity in plant, equipment and revolving funds. Unable to survive this setback, many producers sold their orchards.
The age structure of orchards, low average yields and limited success in increasing the proportion of the annual crop sold fresh all point toward further apple acreage decreases in Sonoma County.
Santa Cruz County apple producers have tended to emphasize fresh market varieties more than have Sonoma County producers, but the percentage of the crop sold fresh is also low, averaging 15% annually for 1986–1990. Of their major varieties, Yellow Newtown (Pippins) is a dual-purpose variety, while Red Delicious is a fresh market apple.
Average Santa Cruz apple yields tend to be higher than Sonoma County yields and they also typically exceed the California statewide average. For example, the simple average of annual yields during 1986–1990 were 15.66 tons per acre for Santa Cruz County, 10.97 tons per acre for Sonoma County and 12.52 tons per acre for California.
Average annual prices in Santa Cruz County have been below the statewide average during the last several years as a result of the varieties grown and the proportion of the crop sold on the fresh market. The average overall price for apples during 1986–1990 was $272 per ton for California, $137 per ton for Sonoma County and $158 per ton for Santa Cruz County. Even with higher than average yields, Santa Cruz County revenue per acre lags behind many other counties because of below-average prices.
There has been a rather steady decline in Santa Cruz County apple acreage as the land has been transferred to higher value uses, such as production of strawberries and cool season vegetables. Some former apple land has also been lost to urbanization.
El Dorado County, the major Sierra foothills producer has been successful in selling an above-average proportion of its production in the fresh market as a result of roadside and on-farm sales. Producers in this area developed and have actively promoted tours and fresh sales through their Apple Hill program. Acreage has varied little over time, with a small increase from 585 acres in 1965 to 635 acres in 1991 (table 1).
The development of new apple acreage in the San Joaquin Valley has been dramatic. Several Valley counties that each had less than 400 acres of apples in 1965, including Fresno, Kern, Madera, Merced, San Joaquin, Stanislaus, and Tulare, now have total plantings ranging from 827 to 5,158 acres (table 1). A combination of relatively high average yields, an above-average proportion of total production being sold in the fresh market, and new varieties with high average prices explain the dramatic movement of apple production to the San Joaquin Valley.
Acreage in the San Joaquin Valley is concentrated in the Granny Smith, Fuji and Gala varieties. The Central Valley has a comparative advantage over other states in the production of Granny Smiths and Fujis, both long-season varieties that produce high yields of quality fruit under San Joaquin Valley climatic conditions. High prices for these varieties in both domestic and export markets have encouraged continued large-scale planting.
Development in Kern County — the San Joaquin Valley county with the most apple acreage — is a little ahead, but generally representative of other valley counties. Kern County, while ranking second among California counties in total apple acreage in 1991, has held the number one ranking for total value of apple production since 1986. Kern County average yields of 16.6 tons per acre during 1986–1990 will probably increase as relatively young orchards mature. Note that 70% of bearing apple acreage in Kern County has come into bearing since 1985.
Kern County producers sold an average of 62% of their production in the fresh market during 1986–1990. Their average fresh market prices have been above the California average ($658 versus $562 per ton from 1986 through 1990), while average prices for processing apples have lagged behind the California average ($75 versus $91 per ton from 1986 through 1990). The overall average apple price of $453 per ton for all production during 1986–1990 was significantly above the statewide average of $272 per ton. With favorable prices and above-average yields, 1986–1990 average total revenue per acre for Kern County apples exceeded average total revenues per acre for Sonoma County and Santa Cruz County by factors of 6.02 and 3.41, respectively.
Variety adjustments
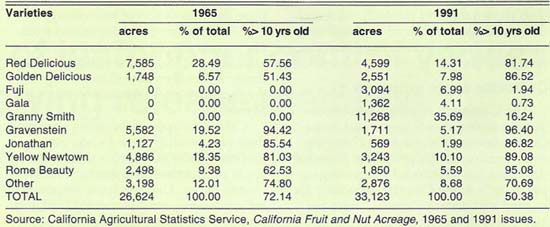
As noted, the shift in location of production has been accompanied by a change in varieties grown. More than 47% of California's 1991 total apple acreage was planted to the Granny Smith, Fuji and Gala varieties, apples for which there was no reported acreage in 1965. As shown in table 2, less than 2% of the 3,094 acres of Fuji apples and 16.2% of the 11,268 acres of Granny Smith apples are greater than 10 years old.
It is interesting to note that the 1991 acreage of Granny Smith and Fuji apples was greater than the combined total for Red Delicious, Gravenstein, Jonathan, Yellow Newtown and Rome varieties. Golden Delicious was the only one of the “old” varieties that increased its share of total California acreage. Each of the other standard varieties declined in both acreage and share of acreage. The most striking reductions were in the total acreage of Red Delicious, Gravenstein and Yellow Newtown. Further reductions in the acreage of Gravenstein, Jonathan, Yellow Newtown and Rome Beauty can be expected, given the high proportions of acreage that are more than 10 years old (last column of table 2).
The continuing search for profitable new varieties is reflected in the relatively young age distribution for the “other varieties” classification, where almost half of the total acreage is 10 years old or younger.
Industry observers indicate that significant new plantings of the Gala and Fuji varieties have occurred during the last 2 years. Their observations of nursery sales and new orchards lead to estimates of total acreage for Galas and Fujis that are two to three times greater than shown for 1991 (table 2). Although these must be considered as rough estimates, they do indicate a continuation of recent trends.
California apple processing
The California apple processing industry, centered in Sonoma and Santa Cruz counties, has also been changing over time. As noted, processor financial problems led to reduced processing capacity in Sonoma County, especially for canned and dried products. There are also fewer processing firms in Santa Cruz County. Surviving firms have faced increased costs to meet waste disposal regulations as well as increased costs for inputs. Raw apple supply areas have tended to expand as production in Sonoma and Santa Cruz counties has decreased and as processors have lengthened their processing seasons. It is important to note that there is limited apple storage in the Sonoma and Santa Cruz county production areas, and processors there are forced to acquire apples from other areas to extend the length of their processing seasons.
The California industry has faced increased competition in product markets as Washington has sharply increased its apple processing activities to better utilize its increased production. Finally, consumer preferences for processed products have been changing over time, with increased demand for juice products.
The new apple acreage and production described above is intended for the fresh market and most processing utilization is from culls that do not meet fresh market standards. While the total quantity of California apples processed varied from year to year, the 1986–1990 annual average of 189,200 tons is only slightly larger than the 1965–1969 average of 180,920 tons, despite a 28.7% increase in total production (from 252,500 to 325,000 tons). At the same time, the proportion of the total California apple crop that was processed decreased from 71.6% in 1965–1969 to 58.6% in 1986–1990.
There were also significant changes in processing utilization. During 1965–1969, California processors utilized 48.8% of processed apples for canned products (sliced apples, apple sauce), but this decreased to 16.4% in 1986–1990. The proportion of total processing use that was crushed for juice and cider increased from 26.2% in 1965–1969 to 71.9% in 1986–1990. At the same time, the proportion of processing apples that were dried decreased from 25.0% to 11.7%. Processing of apples for juice will continue to be important with three new concentrate plants located in the Central Valley (Arvin, Del Rey and Marysville).
California apple processors acquire their raw product from a wide geographic region that covers most major apple production areas in the western United States. Data on apple shipments for processing, available since 1980, indicate that California has imported apples from Washington (79.3%), Oregon (7.6%), Idaho (5.6%), Utah (4.7%) and Arizona (2.2%), together with small amounts from British Columbia, Nevada and Texas.
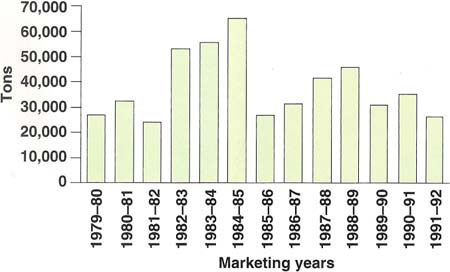
As shown in the figure, shipments of apples by truck into California for processing during the crop years 1979 through 1991 varied from a low of 23,858 tons in 1981 to a high of 64,894 tons in 1984, with an annual average of 37,551 tons. Shipments as a percentage of California processing supplies ranged from a low of 13.4% in 1985–1986 to a high of 39.2% in 1982–1983, with an annual average of 21.8% for the 13-year period. Although many factors interact to determine the quantities of apples imported for processing, there is a definite tendency for the quantity of imports to decrease with larger California crops and to increase with larger crops in Washington, the major supplier. A simple regression equation of imported processing apples as a function of California and Washington production provides the following results:
QI = 79.9240 - 0.2207 CAQ + 0.0135 WAQ

where:
The t-statistics are shown in parentheses and R2 = 0.49.
California processors import apples all year, but quantities vary seasonally. Examination of weekly data for 1980–1981 through 1988–1989 revealed the following pattern of processing apple imports into California: 17.1% arrived during September, October and November; 29.5% arrived during December, January and February; 34.6% arrived during March, April and May; and, 18.8% arrived during June, July and August. Because of limited refrigerated storage, especially in Sonoma County, California apples produced specifically for processing are typically processed from August through November.
Conclusions
The “new” California apple industry continues to evolve. It is located in the San Joaquin Valley, emphasizes production of Granny Smith, Fuji, Gala and other new varieties, uses the latest production technology and focuses on the fresh market. Returns have been favorable, orchards are young and production will expand as these new orchards reach maturity. New orchard investment has been accompanied by investment in new fresh packing facilities, together with refrigerated and controlled atmosphere storage. Continued expansion of storage facilities will be required as new acreage reaches bearing age and average yields increase.
Contraction of the “old” California apple industry in Sonoma and Santa Cruz counties will likely continue as marginal operations exit. The California apple processing industry, centered in Sonoma and Santa Cruz counties, will continue to look to other production areas for much of its raw materials, but it will also face increased competition for apples from the new concentrate plants. The availability of cull apples from refrigerated storage will expand with increased production and storage in the San Joaquin Valley.
California's apple industry gets a new fresh look

