


All Issues
Uniformity in pressurized irrigation systems depends on design, installation
Publication Information
California Agriculture 47(3):18-21.
Published May 01, 1993
PDF | Citation | Permissions
Abstract
Of 258 irrigation systems evaluated by mobile field laboratories in five Southern California resource conservation districts, average uniformity in distribution of water was relatively low. Generally, farms larger than 100 acres had systems with higher uniformity in distribution. Age of a system did not necessarily account for poor distribution. What did account for it was variation in pressures due to inadequate system design or to installation of incorrect hardware.
Full text
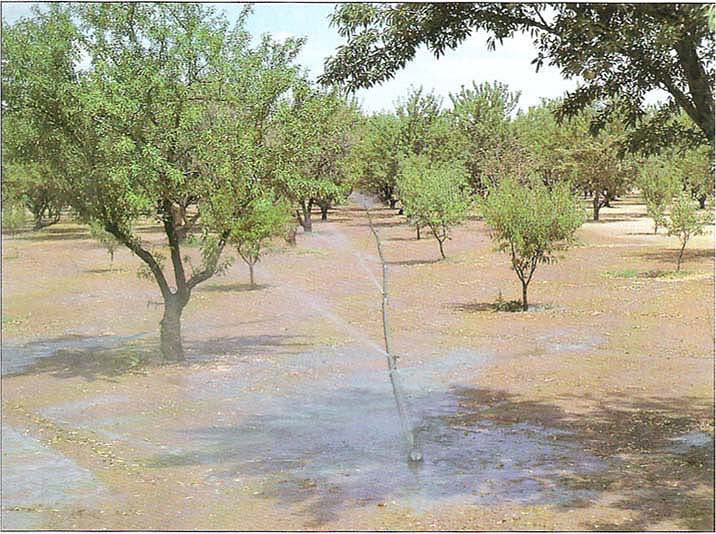
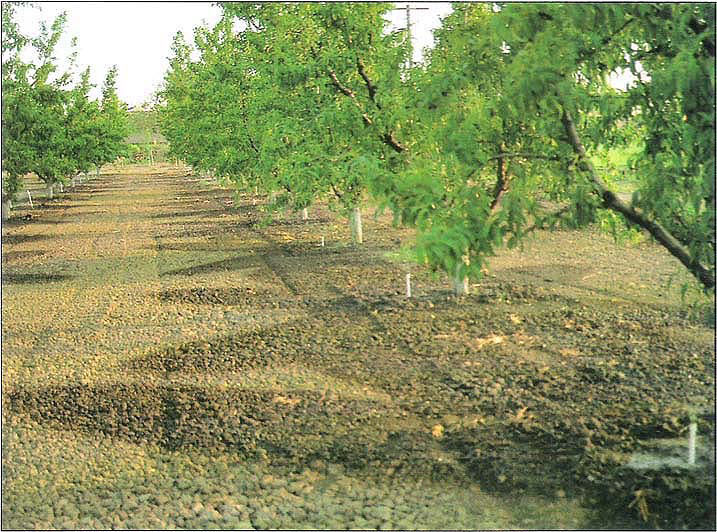
To encourage conservation of agricultural water, the Mobile Field Lab Program, sponsored by the California Department of Water Resources and local resource conservation districts (RCDs), has evaluated 1,200 farm irrigation systems since 1985. Of this total, 258 reports pertain to pressurized irrigation systems for orchards — 189 micro-spray, 56 drip and 13 sprinkler. The orchards, deciduous, citrus and avocado, are all located in Kern, Ventura, Riverside and San Diego counties. Farms vary in size from a few acres up to 400 and in age between 1 year and 30.
Field teams collected data on hardware size, type and location, and on water pressures and discharge flow rates at strategic points in the system. Information on chemical injection, filtration and lateral flushing was also obtained. Teams evaluated single irrigation events and the irrigation system's water distribution uniformity. Using these data and information gained from interviews with growers, the teams also estimated each farm's annual irrigation efficiency.
Background
Primary emphasis was on each system's distribution uniformity (DU), a measure of the uniformity of irrigation water application over an orchard. It is defined as the ratio of the minimum depth of water infiltrated to the average depth of water infiltrated throughout an orchard. Minimum depth infiltrated is taken as the average in the lowest 25% of the orchard. Normal irrigation practice attempts to deliver the minimum required amount of water to this lowest 25%. An unfavorable effect of this practice is that the rest of the orchard is overirrigated, costing more money for excess water and more energy for application.
Greater extremes occur in the maximum and minimum application depths for lower DU values. A high DU value, then, implies greater uniformity of irrigation water application and less use of excess water. The U.S. Soil Conservation Service general criteria for DU values for systems in operation one or more seasons are: 90% or greater, excellent; between 80 and 89%, good; 70 to 79%, fair; and 69% or less, poor.
Application efficiency (Ea) is the ratio of water beneficially used to the total amount of water applied. Therefore, all water applied in excess of the minimum annual irrigation requirement is not beneficially used.
The DU can be considered a measure of the installed irrigation system's efficiency. The Ea is a measure of system management efficiency as well as irrigation system efficiency. Therefore, while a high DU does not necessarily equal a high Ea, a high Ea is not possible without a high DU.
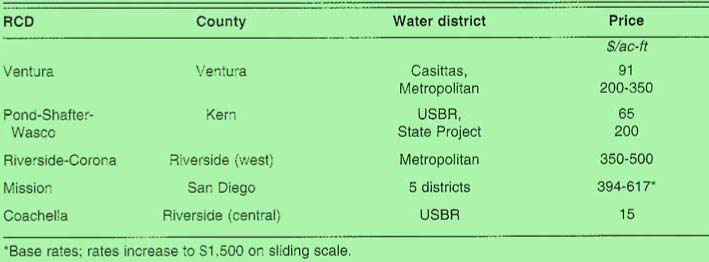
Differences in RCDs
Data from irrigation reports and discussions with mobile team leaders indicated major differences among the five RCDs in terrain, farm sizes and cost of water (table 1). The Pond-Shafter-Wasco and Coachella areas are composed primarily of flat terrain; the Ventura, Mission, and Riverside-Corona areas include hilly terrain.
Table 2 summarizes data for all five areas and for each type of irrigation system. Included are the number of systems, acreage, average DU, area-weighted DU, and overall averages and totals for the combined data. (When calculating the area-weighted DU for a region, more significance was placed on a larger farm than a smaller one.)
The 258 farms represented approximately 10,000 acres with an overall average area-weighted DU of 74%. “Poor” with the lowest average DU value (66%) is Ventura RCD. “Fair” are Mission RCD (71%), Coachella RCD (75%) and Riverside-Corona RCD (75%). “Good” is Pond-Shafter-Wasco RCD (83%). No RCD studied is “excellent” (DU values above 90%); values exceeded this level, however, on individual farms.
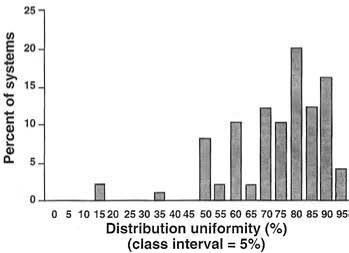
Less than 3% of the Ventura systems had a DU greater than 90% (fig. 1). About 18% were rated between 80 and 90%; nearly 54% had a DU less than 70%. In Riverside (fig. 2), 12% had DUs greater than 90%; 52% were between 80 and 90%, and only 15% were less than 70%. About 20% of the DUs in Coachella (fig. 3) were greater than 90%; about 32% were between 80 and 90%, and 26% of the values were less than 70%. Coachella's high values may be attributed to relatively flat terrain and to the fact that most systems tested were less than 5 years old.
Distribution uniformities
Comparing the three systems — micro-spray, drip and sprinkler — is difficult because their installation and operation differ greatly. An approximate comparison can be made by averaging the uniformity data. As indicated in table 2, average area-weighted DU values for drip and micro-spray systems are 75% and 72%, respectively. These values are calculated from 56 drip systems and 189 micro-spray systems, and for a variety of topographical conditions. The 13 sprinkler systems, on relatively nonundulating terrain, have an average area-weighted DU value of 82%. Because of their many differences, however, none of the systems (micro-spray, drip or sprinkler) can be meaningfully compared.
Pressure variations
Data on the micro-irrigation systems indicate that the largest single cause of low DU values is pressure variation within manifolds and laterals. Pressure variations account for 52% of nonuniformity. Accounting for the remaining 48% are manufacturing variations, clogging, emitter spacing variations and emitter discharge after system shutdown. Excessive pressure variations are caused by undulating terrain and by excessive lateral lengths. Variations in pressure can be corrected by using larger-diameter manifolds and laterals, using shorter manifolds and laterals, installing pressure regulators at appropriate locations and using pressure-compensating emitters.
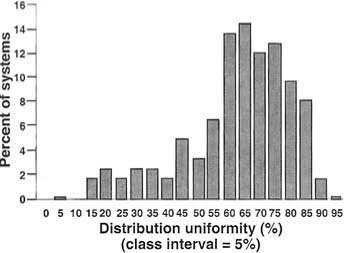
Fig. 1. Frequency distribution of distribution uniformity (DU) values for 125 drip/micro-spray systems in Ventura Resource Conservation District (RCD).
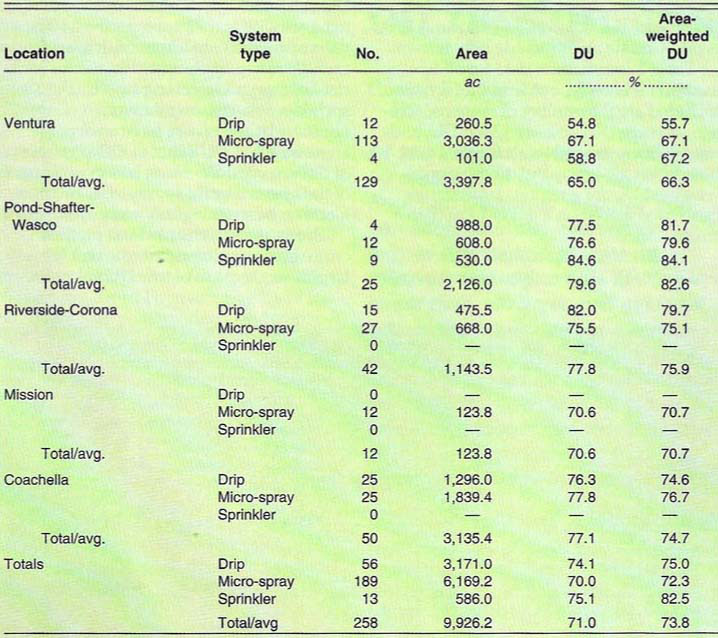
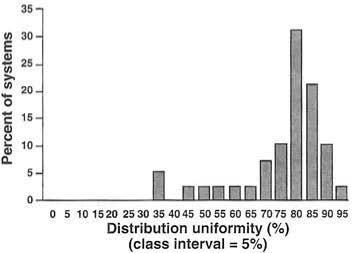
Fig. 2. Frequency distribution of DU values for 42 drip/micro-spray systems in Riverside-Corona RCD.
Filtration and lateral flushing
Preventing emitter plugging, a major contributor to low DU, requires maintaining clean emitters, including water filtration, lateral flushing, and chemical water treatment. All systems utilized filtration units according to recommendations of the emitter manufacturer. Lateral flushing, however, was not practiced for most systems. On 69% of the farms, irrigation systems were never flushed. Average DU values for systems with at least annual lateral flushing was 12% higher than for those systems with unflushed laterals. Flushing minimizes buildup of clay and silt sediments, both of which pass through typical screen filters.
Chemical injection
In all, 66% of the farms used chemical injection for fertilizer application and for chlorine water treatment. DU values for these farms were 7% higher than for the DUs of farms without chemical injection systems. Of the farms with injection systems, uniform injection was not possible for 69% of them because of inadequate hardware. Chlorine injection to control bacterial and algal growth was never applied on 70% of the farms. Average DU values for systems with at least annual chlorine injection (and including weekly or monthly applications) was 12% higher than for those systems which never injected chlorine. About 44% of the systems injected chemicals downstream from the filters. However, average DU of systems with injection downstream of the filter was about 75%; average DU of those injecting upstream of the filter was 70%.
Flow meters
How meters are necessary for good management of irrigation water. However, about 26% of the systems evaluated do not have a flow meter. This percentage varies from 7% for the Riverside systems to 44% in Coachella, which also has the lowest priced water (see table 1).
DU variations, system age
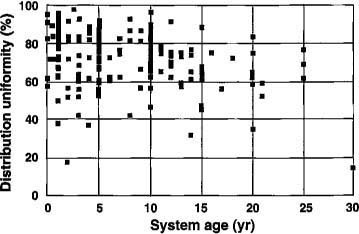
The combined DU values versus system age for all five RCD areas are plotted in figure 4. Data indicate that a large number of new and relatively new systems (5 years old or less) have very low DU values. Because these systems are young, it can be concluded that they do not suffer from operational problems (emitter clogging or use of a mixture of different emitters). Rather, low DU values primarily result from bad system design initially. This conclusion suggests the need for more adequate training, even licensing, of system designers. Visual inspection of figure 4 data indicates that there is little correlation between DU and system age.
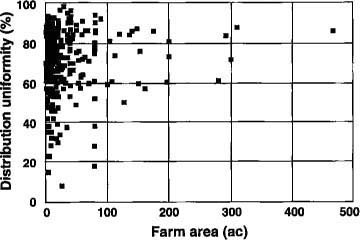
DU variations, farm size
Combined DU values versus farm size for the five RCDs are plotted in figure 5. These data indicate that as farm size increases, very poor DU values (that is, below 60%) decline; none are evident on farms larger than 200 acres. This fact may indicate that irrigation systems on larger farms are better designed, operated and maintained.
Conservation potential
Improving DU reduces the amount of water applied and therefore conserves energy. The following procedure assumes that the minimum annual irrigation requirement (Ym) is being applied to the low quarter of the farm area, as per good irrigation practice, and that it is desired to improve the system distribution uniformity from a present value of DU1 to a higher value of DU2 (that is, 90%).
The depth of overapplied water depends on the existing DU and the total annual applied water. Figure 6 presents a plot of existing DU value versus depth of overapplied water for an improvement in DU value to 90% and for a range of Ym values from 40 to 80 inches.
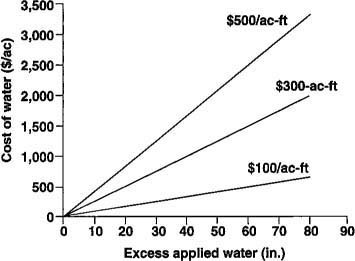
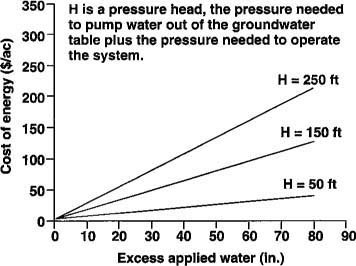
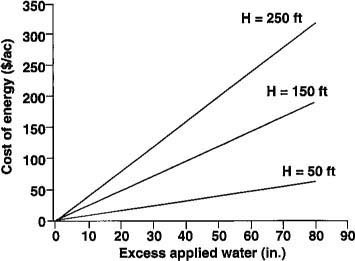
Cost of water for a range of overapplication depths is presented in figure 7 at water prices from $100 to $500 per acre-foot (ac-ft). The cost of energy for the same range of overapplication depths is presented in figures 8 and 9 for energy rates of 10 and 15 cents per kilowatt-hour (kWh), respectively. Each graph assumes a pumping efficiency of 80% and covers a range of pump heads from 50 to 250 feet.
Example
A mature San Joaquin Valley almond orchard with a sprinkler system has a DU value of 75%. Annual irrigation minimum requirement is 50 inches, water cost is $100 per ac-ft, energy cost is 10 cents per kWh, and system operating pressure is 60 pounds per square inch (psi). Water is delivered to the farm in an open canal. What would be the annual cost savings if the DU were increased to 90%?

Fig. 6. Depth of water applied in excess of minimum annual irrigation requirement, Ym, due to DU values less than 90%.
Conclusions
Improvement of DU values and management of the irrigation system so that the correct amount of water is applied can lead to substantial savings in cost and the volume of water applied. Whether these improvements are implemented by the grower depends on government regulations, costs of the improvement, costs of the water and energy, effect on crop yields, and related factors, such as agricultural sustainability and environmental health and safety.
The following conclusions can be stated:
-
Micro-irrigation has potential for highly efficient water application; however, many farm systems tested had relatively low values because of incorrect design or poor maintenance.
-
Average DU for all 258 tested systems is a “fair” 74%.
-
No correlation is observed between system age and DU values. Although management may be a factor, this lack of correlation probably indicates that many systems were inadequately designed initially.
-
Some correlation exists between farm sizes and DU values. For farm sizes below 100 acres, a broad range of DU values is evident; for larger sizes, there are no very poor DU values.
Uniformity in pressurized irrigation systems depends on design, installation

