


All Issues
Cost comparison: engines vs. electric motors for irrigation pumping
Publication Information
California Agriculture 46(5):24-26.
Published September 01, 1992
PDF | Citation | Permissions
Abstract
Farmers may save money in the long run by switching from electric to diesel, natural gas, or propane-powered irrigation pumps, but fuel cost trends are hard to predict. A new computer program can help growers compare potential costs of all four irrigation power sources.
Full text
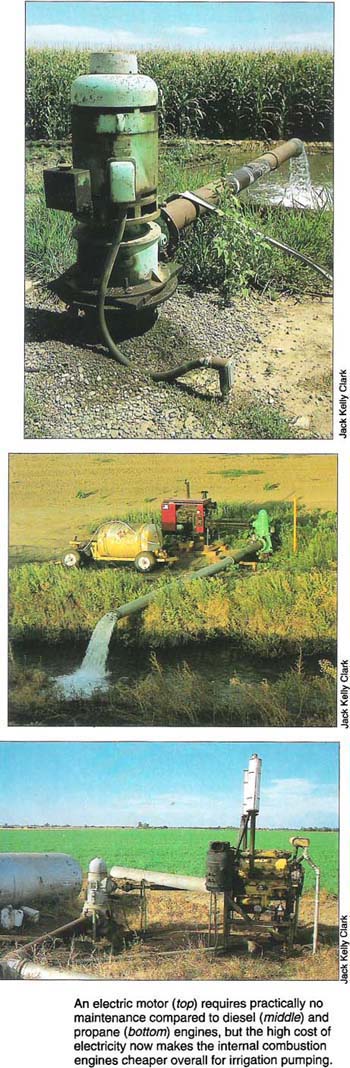
An electric motor (top) requires practically no maintenance compared to diesel (middle) and propane (bottom) engines, but the high cost of electricity now makes the internal combustion engines cheaper overall for irrigation pumping.
Electric rate increases and resulting high pumping costs have prompted some growers to consider switching from electric motors to internal combustion engines for irrigation pumping. Time-of-use electric rates offer reduced electric power costs for off-peak use, but many growers are unable to restrict their pumping to off-peak periods without also making major modifications to increase the capacity of their irrigation systems.
Cost is the primary reason for the increasing interest in engines; however, operational and convenience factors must also be considered. The electric motor provides flip-the-switch convenience along with minimal service and attention requirements. It also maintains its power output level year after year, whereas engines tend to lose power over time because of wear. An engine, on the other hand, permits the operator to vary its speed within certain limits and thereby vary the pump output. An engine also makes it possible to operate the irrigation system 24 hours a day without regard for the schedules associated with time-of-use rates.
The cost data presented here compare the electric motor with three types of engine: diesel, natural gas, and propane. Of these three engine types, diesel is the most commonly used for irrigation pumping in California.
It should be pointed out that engines used for irrigation pumping in California may be subject to additional costs resulting from exhaust emission regulations. Local air pollution districts have the authority to levy annual permit fees on off-road engines of any type. Local air pollution districts also have authority to require that engines be retrofitted to meet the latest and best emission control technology, but they cannot set emission standards for engines.
Emission standards for off-road engines are being developed by the Environmental Protection Agency (EPA) and the California Air Resources Board (CARB). CARB is working on regulations covering all off-road engines from 25 to 175 horsepower (hp); however, amendments to the Federal Clean Air Act of 1990 have preempted the state's power to regulate engines of less than 175 hp if they are used in construction or farm equipment. In 1992, CARB adopted regulations for off-road, heavy-duty diesel engines of 175 hp and up. The regulations are scheduled for implementation in 1996 (175 to 750 hp) and 2000 (over 750 hp). The EPA is also working on regulations that will cover off-road diesel engines including those used in construction and farm equipment, plus clarification of definitions for these two use categories.
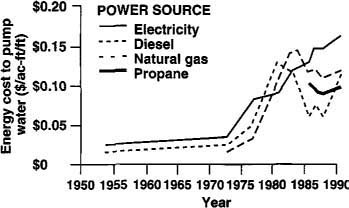
Fig. 1. Energy costs for pumping irrigation well water of crops, 1954 to the present. Data for four likely energy sources are presented as the dollar cost of pumping one acre-foot of water one foot up the well shaft.

Fig. 2. Dollar costs per kilowatt-hour (PG & E summer 1991 rates) of pumping water with electric power at four annual rates of use and two daily schedules: 18 hours per day with 12% of the pumping during “on-peak” hours, and 18 hours per day with no pumping during “on-peak” hours.
There has been discussion of requirements to retrofit existing engines; it now appears, however, that proposed regulations by CARB, EPA, or both will apply only to new engines.
Fuel and electricity costs
Figure 1 shows, in a general way, how the costs for electricity and engine fuels for irrigation pumping have increased and fluctuated over a 27-year period dating back to 1954. Energy costs, shown as dollars per acre-foot of water per foot of lift, increased rapidly after the oil embargo of 1973–1974. Engine fuel costs surged ahead of electricity costs during the early 1980s, but dropped appreciably and fell below electricity again in about 1987. The Persian Gulf crisis pushed engine fuel prices upward again, and the major effect was on diesel fuel. The cost differential that has developed between electricity and engine fuels shows clearly.
Energy prices and resulting costs to growers vary according to individual circumstances. For electricity, the price per kilowatt hour (kWh) under time-of-use rate schedules depends upon several factors, including the electric rate, hours of operation per season, and daily or weekly operating schedule. Operating schedules determine the amount of energy used during on-peak periods when energy costs are significantly higher.
Figure 2 is an example in which a 50-hp electric motor is operated 18 hours per day for 500, 1,000, 1,500, and 2,000 hours per year on the lowest-cost 1991 Pacific Gas and Electric Company summer rates. The bottom curve represents the cost per kWh when there is no on-peak use. The top curve represents the cost per kWh when the pump is operated during 4 of the 6 on-peak hours each weekday, or 12% of the total operating time on-peak. Cost per kWh shown in figure 2 includes energy, demand, and customer charges. In this example, the cost of electricity ranges from a high of 17 cents to a low of 8 cents per kWh, depending on annual usage and operating schedule.
Diesel and propane fuel prices vary according to location within California and the quantity purchased per load. For example, a fuel price survey in early 1991 showed a price range of 79 to 98 cents per gallon for diesel. The same survey indicated an estimated 1991 summer price range of 35 to 50 cents per gallon for propane. Natural gas core prices for 1991 were in the range of 50 to 57 cents per therm. Southern California Gas Company also had non-core gas available in 1991 at prices ranging from 34 to 38 cents per therm; however, the non-core rate is inter-ruptible and requires a back-up fuel supply (propane).
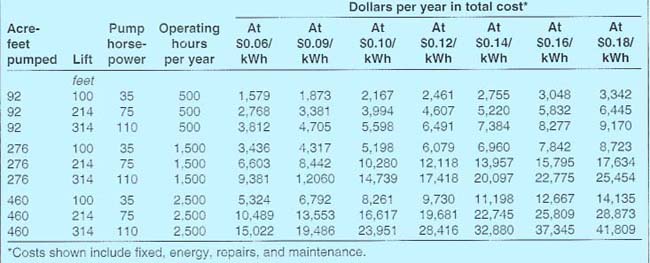
TABLE 1. Total cost of owning and operating an electric motor for irrigation pumping, at various prices per kilowatt-hour (pumping rate = 1,000 gpm)
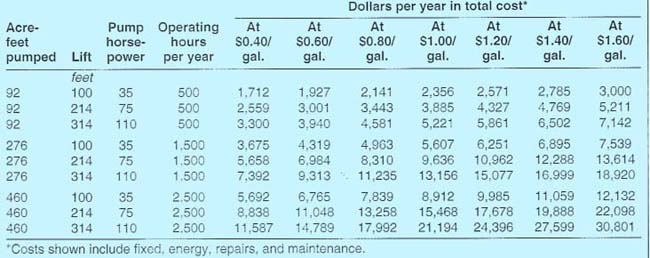
TABLE 2. Total cost of owning and operating a diesel engine for irrigation pumping, at various prices per gallon of diesel fuel (pumping rate = 1,000 gpm)

TABLE 3. Total cost of owning and operating a propane engine for irrigation pumping, at various prices per gallon of propane fuel (pumping rate = 1,000 gpm)

TABLE 4. Total cost of owning and operating a natural gas engine for irrigation pumping, at various prices per therm (pumping rate = 1,000 gpm)
A key question is: What will energy prices be in the future? It seems fairly certain that electricity prices will continue to escalate for agricultural customers. The California Public Utilities Commission has determined that revenues from the agricultural class are substantially below the level required to put them on an equal percentage of marginal costs basis with other classes. It is probable that a major portion of this difference will be made up over a 5-year period ending in 1995. Additional increases may also occur as a result of energy cost adjustments. The long-term trend in diesel and propane prices will undoubtedly be up, but we may see a period of somewhat stable prices unless there is another international oil supply crisis.
Total costs
In 1987, the authors made a study of irrigation power unit costs that included a survey of equipment dealers throughout California. These costs were updated in early 1991. The resulting cost calculations were written into a computer program (Power Plant Costs for Irrigation Pumping) for comparing total costs of electric motors and diesel, natural gas, or propane engines. These total costs include fixed costs, fuel or electricity, repairs, and maintenance and service. Income tax considerations are not included in this analysis. Costs are calculated in terms of current dollars.
Included with the cost program is another program that can be used to derate (adjust) engine horsepower and fuel consumption for differences in altitude, temperature, and engine accessories or equipment between manufacturer's test conditions and actual conditions of use. Failure to properly derate an engine when necessary can significantly affect actual horsepower output and fuel consumption.
Figure 3 compares the total cost per year to operate a 75-hp pump 1,500 hours per year with an electric motor or an engine (diesel, natural gas, or propane). Energy costs used for this comparison are electricity (10 cents per kWh), diesel (80 cents per gallon), natural gas (50 cents per therm), and propane (50 cents per gallon). It should be emphasized that the energy cost of 10 cents per kWh for the electric motor represents the average cost per kWh for the year, including demand charges, customer charges, and the like.
This example shows that, at the energy prices listed above, all three types of engine cost less to operate than the electric motor. Diesel and natural gas costs are about equal. The bar graph also breaks down the total costs for each power plant into fixed costs, repairs, energy, and maintenance and service. This breakdown shows that energy cost is about 90% of the total cost for the electric motor, versus about 75% of the total cost for the engines.
Table 1, table 2, table 3 and table 4 show total annual costs for an electric motor and for diesel, propane, and natural gas engines, when pumping a given number of acre-feet of water under specific conditions of lift in feet (total head). Each table represents three hp sizes (35, 75, and 110), three annual operating periods (500, 1,500, and 2,500 hours), and a range of fuel or energy costs.
Engine matching
If the decision is made to use an engine instead of an electric motor, the engine must be properly matched to the pump. A properly matched engine will provide the necessary horsepower to operate the pump at the desired revolutions per minute (rpm). Proper matching is also necessary to optimize fuel efficiency and engine life, and to keep repair costs low.
Engine manufacturers provide data on hp and fuel consumption based on laboratory tests. Most manufacturers provide both maximum and continuous hp test data. The continuous hp test is run at a level that the engine can sustain on a continuous basis, 24 hours per day, and is usually about 25% less than maximum hp. An engine should be matched to a pump by starting with the manufacturer's continuous hp data and derating (or adjusting) that data to reflect any differences between the manufacturer's test conditions and actual conditions of use.
Factors to be considered in derating are altitude and ambient temperature conditions; engine accessories, such as an alternator or muffler; and auxiliary equipment, such as the gear drive for operating a pump. Some of these factors, such as an alternator and gear drive, consume power and affect both hp and fuel consumption. Other factors, such as a muffler and ambient temperature conditions, are oxygen-limiting and only affect hp consumption. It is a good idea to further derate the continuous hp test data to allow for loss of power due to engine wear over time, and to provide a factor of safety against engine overload.

Fig. 3. Total annual costs to operate a 75- horsepower irrigation power plant 1,500 hours per year using an electric motor or a diesel, natural gas, or propane engine.
Manufacturers' engine data obtained in the cost survey were derated for a typical set of conditions that covered altitude, temperature, and accessories and equipment. They were further derated by 10% to provide a margin of safety against overload.
Summary
In general, engines become more cost competitive with the electric motor as size (horsepower) and annual hours of use increase. This is because fuel efficiency increases as engine hp increases, and the labor required to service and attend to an engine in the field is nearly the same for a small engine as for a large engine. Although fixed costs are higher for an engine than for an electric motor, they have less effect on total cost if they are spread over more hours of use.
It should be emphasized that the comparisons shown here are based on generalized cost data and are intended to provide approximate values. Specific costs will vary, depending on the particular situation. Anyone considering a change from an electric motor to an engine should make a careful analysis.
Computer program
The computer program developed for these comparisons is written so that the user can provide the input data or utilize default data stored in the program. Default data include typical values for fuel or electricity consumption, power unit prices, repairs, maintenance and service, and expected lifespan. The cost comparisons in figure 3 and Table 1, table 2, table 3 and table 4 were made with the computer program using default values for these inputs.
Output from the program shows total costs in dollars per year, plus a breakdown of the costs for energy, repairs, fixed costs, and maintenance and service. It also shows the break-even energy prices for the power units being compared.
Cost comparison: engines vs. electric motors for irrigation pumping

