


All Issues
By budgeting irrigated pasture growth rates, managers control forage levels and animal performance
Publication Information
California Agriculture 46(3):27-30.
Published May 01, 1992
PDF | Citation | Permissions
Abstract
Traditionally, little control is exerted over grazing on irrigated pasture. Today, however, with controlled grazing and feed budgeting, the pasture manager can use grazing stock to control forage levels, and forage levels can be used to control animal performance. Pasture budgeting can be applied to California's irrigated pastures when estimates of expected pasture growth are available, according to an ongoing study.
Full text
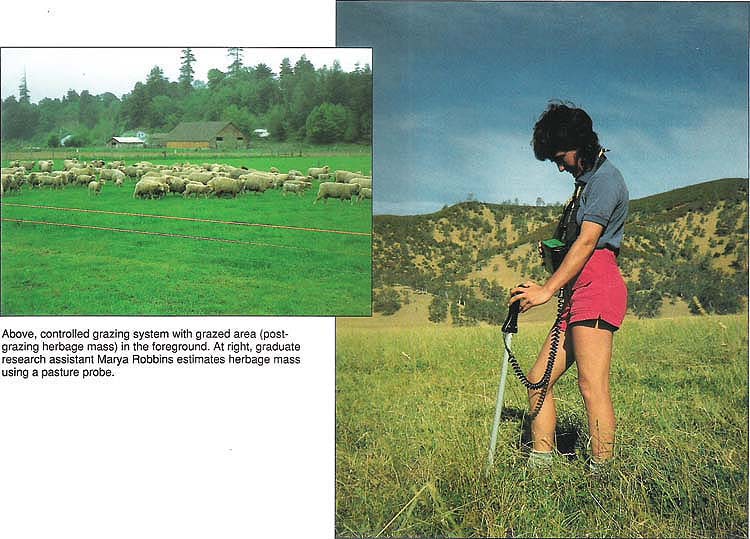
Above, controlled grazing system with grazed area (post-grazing herbage mass) in the foreground. At right, graduate research assistant Marya Robbins estimates herbage mass using a pasture probe.
Ranchers in New Zealand allocate forage in intensive grazing systems by budgeting pasture use along with rotating pasture use. The advantages are (1) grazing can be used to control forage levels and (2) forage levels can be used to control animal performance. Pasture forage budgeting requires knowing:
-
The pregrazing herbage mass (HM) present in each paddock at the beginning of a rotation,
-
The postgrazing herbage mass target,
-
Expected pasture growth rate (PGR),
-
Forage energy concentration, and
-
The quantity and quality of supplemental feeds.
Because information on pasture growth rates is not readily available for California’s irrigated pastures, we began monitoring pasture HM on five Northern California irrigated pastures where time controlled grazing was practiced. Preliminary observations on this monitoring, begun in 1988, and the use of PGR in a pasture budget are reported here. Although forage budgeting does not require pasture conditions like those in New Zealand, we will compare PGRs of New Zealand with those of California.
How much HM is available?
Herbage mass (HM) is an internationally recognized term for the amount of dry matter in a pasture at any one time. Not all HM is available for consumption by stock. Some must be left behind to protect soil and support future pasture production; some is wasted by trampling and fouling. The first step in feed budgeting is to estimate HM (lb/ac) present at the beginning of a rotation. With reasonable accuracy, determining HM can be done visually by clipping or, as was done in this study, using a pasture probe. The pasture probe measures changes in electronic capacitance to estimate the weight of above ground dry matter (DM). The pasture probe was calibrated with a large number of clipped samples.
Visual estimation of HM can be learned in a few hours by comparing estimates with clipped samples or with the pasture probe (several farm advisors have pasture probes). Estimate HM in units of 100 DM lb/ac. Pasture height can be used to roughly estimate pasture DM. Table 1 shows the general relationship between height and weight for cool-season irrigated pastures having a mixture of grass and clover. More accurate estimation of pasture DM is difficult because species composition, plant density, season and stage of growth vary. However, for feed budgeting purposes, estimates are usually adequate.
After grazing, wha's left?
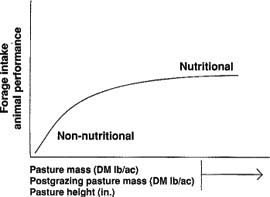
The amount of forage left after grazing depends on the level of animal performance desired. Figure 1 illustrates that to achieve high intake and high animal performance, high HM and allowance must be provided and stock must be moved before postgrazing HM declines to a low level. The practical importance of this relationship between pasture intake and pasture availability is that intake and animal performance can be controlled by rationing pasture to stock.
Figure 1 is divided into two distinct sections: non-nutritional and nutritional. The non-nutritional section, the ascending part of the curve, indicates how the animal's ability to harvest pasture limits intake and performance. These factors (intake and performance) are influenced by pasture structure and animal grazing behavior. In this part of the curve, intake and performance are very sensitive to changes in the amount of pasture allocated, so any errors in pasture allocation greatly affect animal performance.
At the plateau of the curve, such nutritional factors as digestibility and nutrient concentration appear to control intake and animal performance.
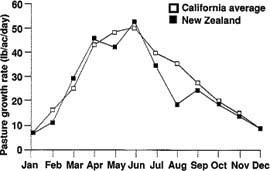
Fig. 2. Mean pasture growth rate for five Northern California irrigated pastures compared to inland and coastal pastures on New Zealand's North Island.
The amount of forage left after grazing can be used to control animal production. During the non-nutrient phase of Figure 1, animal performance improves as the amount of forage left behind increases. To achieve maximum milk or meat production on pastures containing temperate forage species, it is common to have a target postgrazing mass between 1,200 lb/ac and 1,600 lb/ac, usually the equivalent of 3 to 4 inches of forage. Our example forage budget in table 2 uses a postgrazing HM of 1,400 lb/ac. Stock that can be maintained on a lower plane of nutrition than milk cows, growing calves and lambs may have a lower postgrazing HM target. New Zealand's postgrazing DM target for dry beef cows is 600 to 700 lb/ac; postgrazing target for beef cows in late pregnancy or late lactation is about 1,000 to 1,200 lb/ac DM.
Although California researchers have not conducted studies determining the postgrazing HM at which intake or performance is near maximum, research during the 1950s showed that animal performance increased if pastures were not closely grazed. The result: Cooperative Extension Service recommended leaving 4 to 6 inches of forage at the end of a grazing period.
What is the PGR?
Pasture growth rate (PGR) is the daily rate of forage production. In winter, PGR is slow, often less than 10 lb/ac/day. During rapid spring growth, PGR can exceed 50 lb/ac/day. This is the amount of daily HM increase. Pasture growth rates were determined on five ranches in Northern California from 1988 to 1990, using an earth-plate capacitance meter (pasture probe). Pasture growth rate was determined from the change in HM between the beginning and end of a pasture rest period.
PGR (lb/ac/d) = Ending HM − beginning HM (lb/ac)/Ending date − beginning date (days)
Definitions
Continuous grazing is grazing for extended periods without rotating to another paddock (pasture). Continuous grazing for several months or all year is common in California. It is called set stocking in New Zealand.
A controlled grazing system is a mixture of continuous and time-controlled grazing that is planned to meet farm production targets. Time-controlled grazing can be used to ration forage when PGRs are low or forage is being accumulated for later use. Continuous grazing is most useful when feed supply greatly exceeds demand and accumulation for later use is unnecessary.
Herbage mass (HM) is the amount of pasture per unit area. The amount of pasture is all that is above ground level and is expressed as lb DM/ac, where DM equals dry matter. Herbage mass is also called herbage dry matter or pasture mass.
Paddock is the term used internationally for individual fields in a grazing system. In the United States, these fields are usually called pastures. Rotational grazing systems, including cell grazing, have several paddocks, often separated by permanent electricfences.
Pasture allowance is the amount of pasture allocated to livestock; it is calculated by dividing pregrazing herbage mass by the number of animals per unit area and is expressed as lb DM/head/day or lb DM /lb liveweight/day.
Pasture growth rate (PGR) is the amount of daily forage increase on a dry matter basis (lb/ac/day).
Postgrazing herbage mass is the amount of pasture per unit area left after grazing. An indication of the intensity of grazing, it is expressed as lb DM/ac. It is also called postgrazing pasture mass.
Time-controlled grazing is a grazing rotation where rest periods vary with pasture growth rate (PGR). When PGR is rapid, grazing periods are short (2 to 4 days), followed by 20-to 35-day rest periods. When PGR is slow, grazing periods are longer (7 to 10 days), followed by 60 to 90 days of rest from grazing.

Herbage mass was estimated weekly during rapid growth, biweekly during moderate growth and monthly during slow winter growth. Pasture growth rates for each month were averaged to get PGR estimates (table 3). Monthly PGR patterns and magnitude from the five irrigated pastures are similar to those of inland pastures on New Zealand's North Island (fig. 2).
How much energy is in forage?
Metabolizable energy (ME) is a measure of dietary energy available for metabolism after energy losses in the urine; combustible gasses (chiefly methane) are subtracted from digestible energy (DE). Metabolizable energy can be estimated from total digestible nutrients (TDN) or DE (2.2 lb of TDN = 4.4 Mcal of DE and ME = 0.82 x DE). Metabolizable energy is sometimes reported in metric megajoules (1 Meal = 4.18 MJ). In New Zealand, growing perennial ryegrass/white clover pasture between 800 and 3,000 lb/ac HM has an energy concentration of 1.1 to 1.25 Meal ME/lb DM. To simplify feed budgeting, growing pasture is usually assumed to have 1.2 Mcal ME/lb DM. In California, irrigated pasture ME ranged from 1.1 to 1.3 Meal ME/lb DM (table 4).
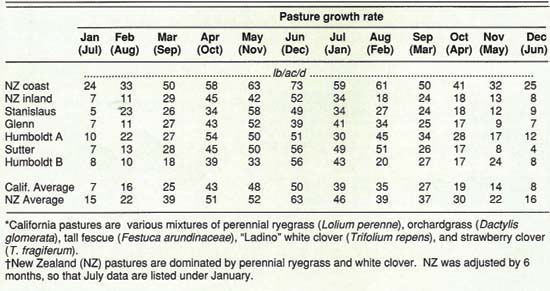
TABLE 3. Pasture growth rates for five Northern California* irrigated pastures compared to inland and coastal pastures on New Zealand’s North Island†

Including supplements
Supplements included in a feed budget can make up for pasture deficits, provided the energy concentration of pasture DM is known. Irrigated pasture energy concentration varies from 1.1 to 1.3 Meal of ME/ lb DM. Other feeds can be compared with pasture on a relative basis. For example, the ME for good quality hay is 0.87 Mcal ME/lb DM and pasture contains 1.2 Mcal ME/lb DM. Therefore, 1 lb DM of hay will provide 0.73 times the energy of 1 lb DM from pasture. In other words, 1.38 lb hay is required to provide the same amount of energy as 1 lb pasture.
Feed demand
Feed requirements for different kinds and classes of stock at different levels of production can be determined from the National Research Council's “Nutrient Requirements of Domestic Animals.” Feed budgeting is an imprecise process. If postgrazing HM for paddock 1 is lower than the target of 1,400 lb/ac, it may be desirable to reduce the grazing period or to decrease stock numbers. Feed budgets should overestimate feed requirements by 10 to 20% initially to reduce the risk of overstocking or of running out of feed prematurely. With experience, the pasture manager can fine tune the feed budget.
Feed budgeting example
Table 2, the feed budget, can be used to project answers to the following:
-
Will forage run out and supplemental feeding be required
-
Will the target live weight gain or stocking rate need to be reduced?
-
How long will the grazing period for each paddock be?
Conclusion
The PGR data presented here represent 3 years of monitoring five Northern California pastures. Monthly PGR varies annually according to changes in weather and management. However, these data can be used to illustrate the application of feed budgeting to Northern California. In the long run, knowing monthly PGR and the range of PGR variation (standard error) can improve assessments of weather-related risks associated with feed budget projections. Ranch feed budgets, however, should always include an emergency feed plan.
The premise of controlled grazing and feed budgeting is that the pasture manager can use grazing stock to control forage levels and the forage levels can be used to control animal performance. With this approach, pasture management becomes an active process of setting production targets and monitoring progress rather than a passive process resulting in low productivity. Controlled grazing requires planning and preparation. For those interested in pursuing intensive grazing management, livestock farm advisors throughout California offer short courses on ranch planning and grazing management.
By budgeting irrigated pasture growth rates, managers control forage levels and animal performance

