


All Issues
To anticipate the future, models simulate US. pistachio prices
Publication Information
California Agriculture 46(3):14-16.
Published May 01, 1992
PDF | Citation | Permissions
Abstract
Models developed on U.S. pistachio production simulate grower prices under scenarios of varying import levels and carryover stocks. Grower prices have significantly varied for 13 years, partly because of changes in import levels and domestic production. Bearing acreage has increased dramatically, and as nonbearing acreages mature, substantial growth in production is expected. In 1979, the fledgling U.S. pistachio industry produced 1,000 tons; in 1990, production was more than 58,000 tons. Anticipating future grower prices under alternative market scenarios is of interest, particularly as global political conditions change.
Full text

Until 1986, the United States was the world's leading importer of pistachios, and Iran was its major supplier until 1980, when the U.S. imposed a trade embargo in retaliation for Iran’s taking of U.S. hostages. The embargo was reversed by the Algerian Hostage Accord, which stipulated that the U.S. would not impose trade sanctions on Iranian exports. Subsequently, Iranian pistachio exports to the U.S. burgeoned and market prices declined.
Charges of unfair competition were lodged with the U.S. International Trade Commission, and in 1986, the U.S. imposed countervailing duties of 318% on in-shell nuts and 289% on shelled, processed Iranian pistachios. These duties effectively choked off Iran’s U.S. market, and imports plunged from 13,700 tons in 1985 to 950 tons in 1986. The U.S. industry, by then, had grown sufficiently to satisfy domestic demand. Iran found new markets in Europe and Asia, and Turkey became the major source of U.S. imports. Restlessness in the Middle East, however, could again alter trade relations, creating higher levels of uncertainty for U.S. producers.
Production trends
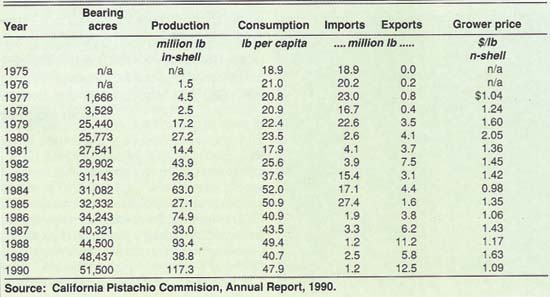
Historically, Iran has been the world's leading pistachio producer; other Middle Eastern producers include Turkey and Syria. Italy and Greece are the major European Community producers (table 1). Iran remains the world's leading pistachio producer and exporter, followed by the United States. U.S. exports have benefitted from major efforts to expand export marketing, many of them government supported, and from consumer approval of the high quality of U.S. nuts. Relative prices, however, constrain more rapid export growth. Figure 1 and table 2 show the trends and changes in U.S. production, consumption, imports, exports and grower prices.
Before 1980, the bulk of U.S. consumption was satisfied by imports — mainly from Iran. After 1980, with the exception of 1983, 1984 and 1985, imports declined, initially, because of the trade embargo and, later, because of the countervailing duties. Also, U.S. production increased from 17.2 million pounds in 1979 to 117.3 million pounds in 1990.
Pistachio production shows a distinctly alternate bearing pattern, rendering marketing strategies more problematic. Large crops are followed by short crops — an “on” /“off”-year cycle. No physiological or cultural solutions to this phenomenon appear to be effective. For our purposes, the production model must account for this on/off production cycle. Not unexpectedly, grower prices reflect changes in supply — rising in off years, declining in on years. Grower prices have ranged from about $1 per pound to slightly more than $2; for most of the 1980s they were below $1.50. The price estimates developed here can be used to anticipate a reasonable range for grower prices, given projected levels of production, demand and imports.
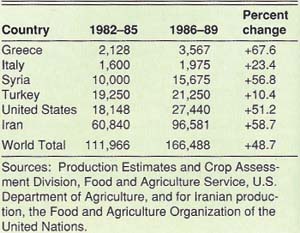
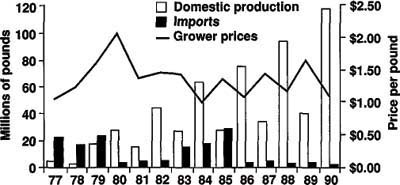
Fig. 1. U.S. production, imports and grower prices, 1977-90. Source: California Pistachio Commission, Annual Report, 1990.
Methods
The production equation takes the form of a simple, linear regression relating production to bearing acres. Pistachio trees require 7 years to achieve commercial bearing. Because of the lag between planting and production, we assume a loose relationship between prices and plantings and treat plantings as an autonomous decision. The short data history has required economizing, as well, on the model's complexity. Data for bearing acres and production are derived from California Pistachio Commission Annual Reports and from annual Fruit and Nut Statistics of the California Department of Food and Agriculture (CDFA). The regression relationship expresses production as a function of bearing acres and as a dummy variable for the on/off-year cycle.
The price estimation equation is a linear regression in which current price is explained by current net supply (domestic production plus imports minus exports), price lagged for two periods, per-capita disposable income and a dummy variable that treats the post-1980 supply-marketing regime as different from the pre-1980 regime because of distinct differences in the relationship between domestic production and imports, and in U.S. government policies towards Iranian imports. Data on prices, production, consumption, imports and exports are from California Pistachio Commission Annual Reports. Disposable income data are from the U.S. Department of Commerce.
Results
The production equation is defined as: DOMPROD = f (BEARACRES, ALTBEAR), where
DOMPROD = domestic production, BEARACRES = bearing acres and ALTBEAR is a dummy variable in which 0 = off-year production and 1 = on-year production.The estimated equation is:
DOMPROD = −11.9 + 1.09 BEARACRE + 1.68 ALTBEAR (1) (−1.85) (5.39) (9.99) t-ratio (0.093) (0.001) (0.001) p S = 7.716 R2 = 95.6 R2adj = 94.7 F = 108.11 p(F) = 0.001 D.W = 1.51The regression equation performs well, as shown by the F statistic and the adjusted R2. Both bearing acreage and the alternate bearing variables are highly significant with large t-values. (A large t value [larger than 2.0] indicates a very small probability exists that the relationship between that particular explanatory variable and the dependent variable is due purely to chance [i.e., to the particular sample of data selected].)
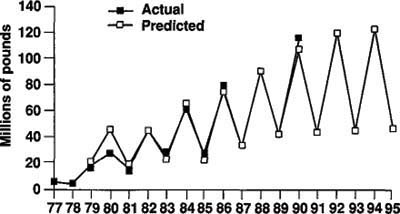
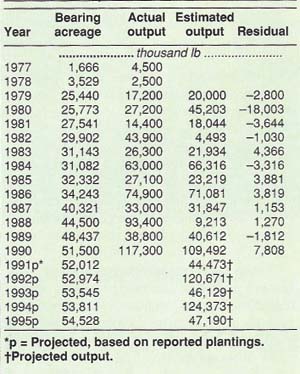
Estimates of production from this equation are presented in table 3 and compared with data for actual production. Figure 2 graphically displays the data. The estimates track actual output very closely for 1977-90. Projections for 1991-95 are based on new pistachio plantings recorded by CDFA.
In the price estimation equation, grower price is a function of supply, demand and lagged price as well as a dummy variable representing the pre- and post-1980 periods characterized by substantially different trading and production regimes. The equation was estimated in nominal as well as real prices.
Eq. 2 expresses the relationship in nominal terms, where:
Pt = f (Netsup, Pt-2, Yeardum, PCDI) in which: Pt = grower price in year t Netsup = current supply (production − exports + imports) Pt-2 = grower price lagged 2 years Yeardum = dummy variable, (0 = 1977-80, 1 = 1981-90) PCDI = per capital disposable incomeThe estimated relationship is:
Pt = 112 − 0.729 Netsup + 0.310 Pt-2 − 73.5 Yeardum + 0.00718 PCDI (2)(3.42) (−4.20) (1.86) (-4.95) (3.16) t-ratio (0.011) (0.004) (0.105) (0.001) (0.016) p S = 11.33 R2 = 90.6 R2 (adj) = 85.3 F = 16.96(p = 0.001)Given that the discussion as to whether demand relationships should be expressed in real or nominal terms is not resolved, and that the price equation expressed in nominal terms gives a much better fit and can be more easily utilized to solve the model, we use Eq. 2 in deriving our price estimates and in solving the simulation model. Table 4 gives estimates of grower prices for 1977-90.
Price simulations
The simulation model is based on projections of supply and demand. Postulating alternative levels of imports, price outcomes are then determined. As indicated earlier, bearing acreage at time t0 is estimated from data on plantings in t-7. These data were obtained from CDFA’s Fruit and Nut Statistics. Domestic demand is captured in the projections of per capita disposable income.

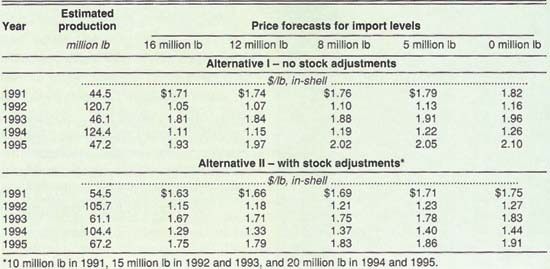
Postulated import levels are: 0, 5, 8, 12 and 16 million pounds. Eq. 2 is used to estimate alternative price outcomes under various import scenarios. Results are presented in table 5 as alternative I.
Off-year production increases from 44.5 million pounds in 1991 to 47.2 million pounds in 1995; on-year production increases from 120.7 million pounds in 1992 to 124.4 million pounds in 1994. Given our assumptions about imports and the demand relationship contained in Eq. 2, grower prices in 1991 are estimated to range from $1.71 to $1.82 per pound, the lower figure occurring at higher levels of imports. Expectedly, price estimates are significantly lower for the 1992 crop, an on year. Output is projected at 120.7 million pounds, and price outcomes range from $1.05 to $1.16. At 5 million pounds of imports, the level achieved in 1989, grower price is estimated at $1.13. Actual price outcome in 1990, with 117.3 million pounds of production and 1.2 million pounds of imports, averaged $1.09 per pound, suggesting that our price estimates are not unreasonable.
Alternative II generates price outcomes for our simulation model, assuming alternating levels of carryover from year to year. In effect, it implies a 24-month marketing period as opposed to a 12-month period. No marketing order is in effect for pistachios, and none is reportedly contemplated. Thus, supply management is a voluntary or market-determined phenomenon, as opposed to a government-sanctioned administrative decision with levels of carryover typically determined by default. Firms have historically attempted to maximize current-year sales, recognizing that grower returns should not fall below certain levels. The proportion of the crop that cannot be sold is carried over, but firms have the option of more proactively utilizing inventory to smooth out supply availability and prices. Alternative II illustrates how supply and prices would change if stock levels could be proactively manipulated as shown.
Under alternative II, prices in off years are reduced and prices in on years are enhanced, thereby increasing gross income for 24-month marketing periods. For example, for the 24 months of 1992 and 1993, when the import level is 8 million pounds, total revenues are $234.8 million under alternative II, compared with $221.0 million under alternative I, a gross increase of $13.8 million.
However, in practical terms, storage is not costless. It implies an expansion of storage facilities involving outlays for capital costs and increased carrying costs for inventory. Thus, net benefits would be less than indicated by changes in gross revenues. Nonetheless, the potential effects of stock management decisions, as indicated by our simulation model, suggest that marketing firms might invest resources in exploring the feasibility of utilizing more proactive stock management options in their repertoire of strategic marketing plans.
Conclusions and implications
Acreage and production of the U.S. pistachio industry have grown dramatically since 1979. Policy decisions have adversely affected imports to the benefit of the domestic industry. This analysis has examined trends in acreage and output and made short-term projections of output based on a projections model. To gauge the impact of increased domestic supply and alternative levels of imports, a price estimation model was developed and used to simulate the range of price outcomes at various levels of domestic production and imports. Our simulation model showed that price oscillations could be modulated by changes in the levels of carryover. Because there is no marketing order, it would, in practice, be challenging to set enforceable targets for marketings and carryovers. In any case, the industry needs to anticipate the larger crops that are being projected and to plan for increased storage capacity. If growers can withhold nuts in storage they may be able to enhance prices during an abundant year. Otherwise, limits imposed by storage capacity may dictate price outcomes, particularly in on years.
To anticipate the future, models simulate US. pistachio prices

