


All Issues
“Organizational classes” explain differences among westside farms
Publication Information
California Agriculture 46(1):35-39.
Published January 01, 1992
PDF | Citation | Permissions
Abstract
Since the advent of industrialization, social theorists have been analyzing the complex relationships of industrial systems. At the same time, attention to agricultural production systems has waned. The fact that agricultural systems resemble early industrial systems suggests that farms might be studied using the same theories as those applied to industrial organization. That is, farms can be organized according to how they function. Farms which function similarly are said to belong to “organizational classes”. Types or classes of farms perform differently in the ease with which they can adopt to new technology or apply intensive agricultural practices. We used two organizational variables — task specialization and configuration — to distinguish among farm types on the westside of the San Joaquin Valley. Five organization types were defined and found to be significantly different with regard to several production variables including number of full-time and part-time workers, acres farmed and use of computers.
Full text

Farmer mowing alfalfa near Patterson. Farms operated by a single individual comprised just 10% of farms on the westside of the San Joaquin Valley.
American agriculture encompasses diverse organizations operating in a wide range of geographic areas and climatic conditions. If researchers wish to measure farm performance – how easily farms adopt new technologies, for instance – they need a system for grouping farms that reflects the relationships among the conditions of agricultural production.
The most commonly used farm classifications are those developed by the U. S. Census and the U. S. Department of Agriculture, which distinguish farms according to size and income. Such classifications are useful in comparing farms with respect to the quantity of inputs used or outputs produced. For example, correlations between farm size and type of irrigation system used are made possible by arbitrarily establishing size classes. However, farm classifications which consider the entire production process can be used to explain the relationship between farm size and type of irrigation, in terms of crop choice, soil characteristics and irrigation method. Farm classes based on the interaction between inputs and outputs can provide farmers, county government officials and legislators a means to evaluate a farm's ability to adopt technology and reveal the necessary preconditions for adoption, or obstacles to adoption.
In a study investigating the adoption of irrigation and drainage reduction technologies conducted for the San Joaquin Valley Drainage Program, we developed a classification of farms based on the organizational characteristics of the farm. This classification was used, among other variables, to explain various degrees of adoption of irrigation and drainage reduction practices. (Statistical analysis for this project is not yet complete, and results are not available. Our purpose here is simply to report on the potential for using organizational criteria to classify farms.)
Because organizations, by theory, manage technological, environmental, and human inputs through their structure, it can be assumed that differences among farms in their production practices may be understood by reference to their organizational structure. That is, classifications of farms based on organization structure will distinguish units using technology, capital, and human labor differently.
In this paper we report on an organizational classification of farms and the applications of this system to the analysis of farm production.
Field work
The initial study of irrigation and drainage practices referred to above was conducted on the westside of the San Joaquin Valley during the 1989 crop year. The study area was divided into five subareas according to the hydrological conditions, political boundaries, and current drainage practices in each subarea. The study area included the northern subarea, including parts of Stanislaus and San Joaquin counties; the grasslands subarea, including the western half of Merced County and a portion of Fresno County; the Westlands subarea, which was roughly coincident with the Westlands Water District; the Tulare subarea, including part of Tulare County and the western portion of Kings County; and the Kern subarea, composed of the majority of Kern County.
The number of farms in each of the five subareas was estimated using county agricultural commissioner records of all operators requesting a restricted material permit in 1988. These figures were modified to account for differences between county lines and the boundaries of the study area. Of full-time farms in the study area, 6% were sampled to attain statistical significance. To account for the differences in farm size in each subarea, the sample was weighted by the relative average size of farms in each subarea.
The interview process was initiated on April 1, 1989 and the final questionnaire was completed on September 19, 1989. Survey questions pertained to the 1988 agricultural season. A total of 285 farms were surveyed. Because of insufficient data on farm organization, we excluded 10 farms from the analysis of organizational types.

Field workers in the San Joaquin Valley. Farms differed in the way labor was specialized and configured.
Farm organizations
The survey collected data on the farm's organizational structure, job titles, wage rates, terms of employment (full-time versus part-time), and number of employees. Using this data we identified five types of farm organization: The unified organization, the primary hierarchy, the simple functional hierarchy, the complex functional hierarchy, and the market hierarchy. These five farm types are distinguished by two organizational characteristics – task specialization and configuration – identified in the literature of organizational analysis as “dimensions” of organizational structure.

“Task specialization” is the degree to which the individual worker is assigned specific duties and task obligations and the degree to which these duties require the individual to emphasize specific skills or specializations.
“Configuration” is the physical arrangement of workers and management in the organization. Organizations may be configured according to the work process. In such “functional configurations,” workers and managers who perform similar or related tasks are linked. Market configurations, the second type of configuration, exist when workers and managers are linked by a single product, market or client served. A farm divided into two units, one committed to tomatoes and another to cotton, is a market organization. Likewise, a farm committed to the fresh vegetable market versus processed markets, or “organic” buyers versus “nonorganic” buyers, is organized by markets.
The “unified” organization is operated by a single individual who performs all the tasks or by more than one worker who share work responsibilities and decisionmaking equally.
“Primary hierarchical” farms possess the simplest level of horizontal task specialization – the separation between workers and management. The work on such farms may be organized according to tasks or by the products, markets or clients served by the farm.
The “simple functional hierarchy” is the product of vertical and horizontal task specialization. Workers are distinguished from management as well as from each other. Workers are thus divided into work groups which have specific duties. For example, mechanics may specialize in the types of equipment they repair.
The “complex functional hierarchy” differs from the simple functional hierarchy in the fact that managers are also organized according to tasks. Irrigation managers perform distinct tasks from those performed by the machine shop manager.
The “market hierarchy” distinguishes workers from managers, and groups both according to markets. Workers and managers form specialized units producing unique crops for either particular markets or clients.
The progression from the unified organization to the market hierarchy is determined by organizational complexity. As an organization requires greater task specialization or configures its workers according to functions or markets, it grows increasingly more complex. Market organizations are more complex because producing for specialized markets requires farms to employ a specialized work force.
Organizational complexity is related to the organization's ability to resolve problems posed by production. The more complex these problems, the more specialized the work force. Farms use task specialization and configuration to solve for production problems such as poor soil or high water costs. They may train or hire workers in more proficient methods or arrange workers into functional or market-based groups to solve these problems. Organizational types based on task specialization or configuration, then, account for the decisions farmers make to manage the varying conditions of production. The more complex farms, for example, are able to control for sandy soils by using sophisticated irrigation systems while less complex organizations may have to rely on high water application rates. The decision to establish specialized work units enables farms to adopt technologies or improved methods because labor is focused on specific elements of the task.
Distribution of farm types
Table 1 presents the distribution of farm organization types and the total acres farmed by each type in the study area. Of all farms studied, 10% were composed of individuals operating as a “unified organization.” These farms, however, accounted for little more than 1 % of the land farmed in the study area. On 46% of the farms studied, work was divided between workers and managers into a “primary hierarchy.” Workers on these farms were unspecialized and shared the work equally. “Simple functional hierarchies” accounted for 20% of the farms in the study area. These farms divided workers according to the tasks they performed. Seventeen percent (17%) of the farms were “complex functional hierarchies” which separated managers according to task. Seven percent (7%) were “market hierarchies” composed of one or more work units serving particular markets or clients or producing distinct crops.
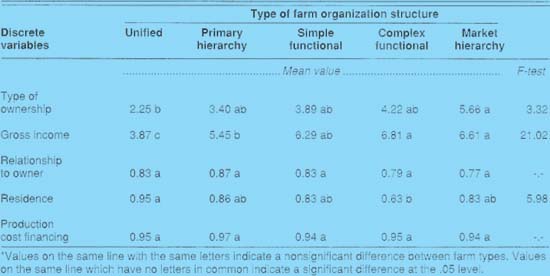
TABLE 2. Analysis of variance of mean values of the discrete variables using harmonized Duncan-Waller grouping procedure
Although complex functional hierarchies represented only 17% of all farms, they operated 41% of the land farmed. Together, the complex functional and market organizations accounted for 59% of the farmed land even though they represented only 24% of the farm organizations in the study area.
The distribution of farm organization types between the five subareas highlighted differences between regions on the westside of the San Joaquin Valley. The primary hierarchy, with an undivided work force and elementary supervisory unit, was the predominant organization type in the northern subarea (48%), the Tulare subarea (68%), and the Kern subarea (46%). The simple functional hierarchy represented 31% of all farms in the grasslands subarea, while 50% of all farms in the Westlands subarea were complex functional hierarchies.
Verifying classes – methods
The five organization types we identified were based on the farm's task specialization and configuration. The success of these two characteristics to distinguish differences in production activities was determined by reference to other measures. Farm types were assumed to represent different farm operations if variability within each type was less than that among types on a range of discrete and continuous measures. These measures included farm size, income, type of ownership and numbers of workers. Many of these measures have been used to develop other farm classifications. Figure 1 displays the distribution of organization types for each of the ownership types.

Cotton harvesting on the westside.
Table 2 presents the results of an analysis of variance (ANOVA) for the mean values of the discrete variables we tested. Numbers in the table represent means of the tested variables. The variable “type of ownership” was recorded as: individual; joint with spouse; family multiple; nonfamily corporation (10 or less members); nonfamily corporation (11 or more members); trust; federal, state, or local government; nonprofit; partnership; and family corporation. Responses were scored from 1 to 10 according to ownership category. “Gross income” was taken to be the annual income derived from agricultural production for the farm. It was recorded by the following income categories: $2,500-$10,000, $10,000-$20,000, $20,000-$40,000, $40,000-$100,000, $100,000-$250,000, $250,000-$500,000 and above $500,000. Responses were scored from 1 to 7 with respect to income category.“ Relationship of managers to the owner” of the farm included consan-guineal as well as marriage ties. It was recorded as a binary score (yes=1; no=0) for all managers. “Residence of owner” distinguished farms whose owners resided on the premises from those whose owners resided off the farm. It was recorded as a binary score-- yes (1) for on-farm residency; no (0) for off-farm. “Production cost financing” related to the type of production financing used by the farm. Respondents selected from six categories: cash only; bank; Production Credit Association/Federal Land Bank/Farmers Home Administration; private; production coops, and other. A score of 0 to 5 was assigned according to the category of financing. (The actual values reported were only 0 or 1, meaning cash only or bank.)
Table 3 provides the results of an ANOVA for continuous variables. The variable “acres farmed” was defined as all land farmed by the respondent during the 1988 crop year. “Gross income per acre” is a simple average of the range of gross income for the farm divided by the farmed acres. “Years of computer use” recorded the number of years the subject farm had used a computer for any farm-related purpose. “Years of agricultural experience” reported on the numbers of years managers had worked in agriculture in any capacity. “Full-time employees per 100 acres farmed” was the number of persons whose agricultural labor was provided on a full-time basis and to whom the farm paid salaries and wages during the agricultural season of 1988. “Part-time employees per 100 acres farmed” included all persons whose agricultural labor was provided on a part-time basis during the 1988 agricultural season. Both figures were calculated per 100 acres and did not include managers, owners or the support and technical staff of the farm. In collecting data on labor, we did not attempt to define the difference between part-time and full-time work according to days worked, but relied on the operator's understanding of each.
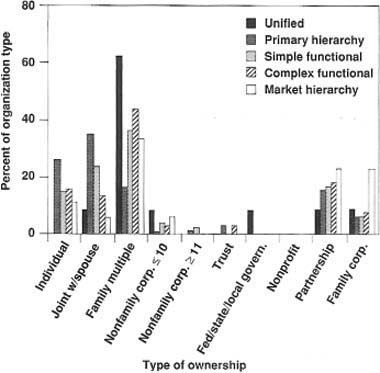

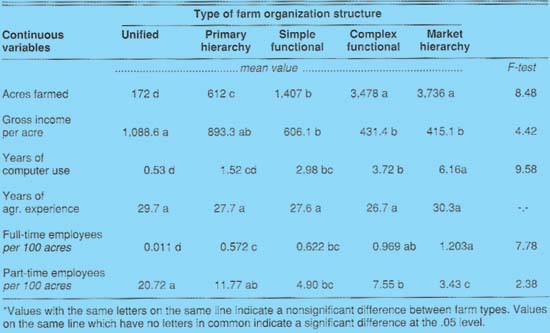
TABLE 3. Analysis of variance of mean values of the continuous variables using Harmonized Duncan-Waller grouping procedure
Verifying classes – findings
In the analysis of discrete variables only “type of ownership,” “gross income” and “residency of owner” distinguished farm types with any success. In all other cases the discrete variable could not make distinctions between farms which clearly differed in terms of organizational complexity and which managed inputs and outputs differently.
Gross income identified four classes of farms, grouping the most complex organization types – complex functional and market hierarchies – into one class. Farms appear to be driven towards the market structure for reasons other than profit, potentially those suggested by the markets themselves. That is, market hierarchies are formed by a farm's concentration on a crop, a market, or a client. The success of gross income values to distinguish farm types is evidence of the relationship between organizational complexity and income. The more complex the organization, the more money it earns.
Neither the variable “relationship of the manager to the owner” nor the “type of production financing” were able to distinguish even one farm type. Relationship of the manager to the owner is a factor associated with family farms The failure of this characteristic to distinguish farms suggests that farms whose managers are related to the owner do not differ from other farms in how they use task specialization and configuration to manage resources. Complex farms possess an equal number of managers related to owners as the (less complex) organizations typically associated with family farms.
The continuous variables provided more definitive separations between farm types. The variables “years of computer use” and “the number of full-time and part-time employees” fully discriminate the five farm types. Access to and use of computers by farms in the study area was significantly different for all five farm types. If one uses computers as a proxy for technology and sophistication, the five farm types demonstrated a consistent relationship between complexity and these two characteristics. The use of full-time and part-time labor successfully identified all farm types, indicating that the number of laborers employed by the farm was related to organizational complexity. This is consistent with our organizational model which recognizes complexity to be a function of size. As the number of workers increases, our results indicate that workers become more specialized.
The variable “acres farmed” was able to distinguish four groupings of farm types. The complex functional organization and the market hierarchy were grouped together. The size of the farm alone could not differentiate between farms which were functionally organized and those which were organized with respect to markets. Market farms organized labor through task specialization or configuration to meet market demands created by the crops they produced or the clients they served. The market configuration implied greater complexity because of these specializations.
The variables “gross income” and “years of agricultural experience” were less successful in discriminating farms which managed labor differently. Gross income established three groupings by combining the simple functional organization, the complex functional organization, and the market hierarchy. Although these farms differed in the way labor was specialized and configured, reference to income did not identify them. Both income and years of agricultural experience are often used to characterize family farms. Our results indicate that these do not adequately account for differences among farms with regard to resource use.
Conclusion
Organizational theory contends that the organization's structure reflects the organization's strategy for managing differences in production. We selected two organizational variables – task specialization and configuration – to distinguish farm types. Using data on farms on the westside of the San Joaquin Valley we grouped farms into five organization types. We then applied an ANOVA to discrete and continuous measures of farm structure including acres farmed, labor use, gross income, type of ownership, and operator residency to determine whether farm types differed with regard to these characteristics.
Our results indicated that farm types identified through task specialization and configuration differed with regard to many structural characteristics. Those characteristics for which farms did not significantly differ were in many cases criteria for other classifications systems. In particular, differences in type of ownership, relationship of manager to owner, residency of operator, type of financing, and years of agricultural experience did not correspond to differences in organization type. Full- and part-time labor and years of computer use were the strongest measures of difference among the organizational classes we identified.
Organizational classifications which reflect differences in resource use may be the most appropriate to assess the impact of different farming systems on the environment and society. These classifications provide significant measures of differences between farms which use labor differently to balance the varying conditions of production. In addition, organization types provide a means for depoliticizing the discussion of farm structure which is presently mired in abstract notions of family versus corporate management. Organizational variables represent traits inherent to all production organizations and, consequently, can be used to classify all farms regardless of differences in production system, ownership, or location.
“Organizational classes” explain differences among westside farms

