


All Issues
San Joaquin River salinity: 1991 projections compared to 1977
Publication Information
California Agriculture 45(6):24-27.
Published November 01, 1991
PDF | Citation | Permissions
Abstract
In the spring of 1991, a water quality model was used to predict flows and salinity in the San Joaquin River for the following summer. It was predicted that the flows and salinities should be more favorable than in 1977, primarily due to improved water quality in the Tuolumne River and increased flows in the Stanislaus River. Actual levels would be largely determined by the amount of diversions from the river.*
Full text

San Joaquin River near Vernalis in May of this year.
The San Joaquin River below Stevinson (number 1 in fig. 1) is an important source of agricultural water supply in the San Joaquin Valley, both directly and indirectly. Several farmers irrigate with water pumped directly from the San Joaquin River, and also contribute drainage water to the river. Also, much of the San Joaquin River is recirculated to the San Joaquin Valley via the Central Valley Project pumps at Tracy. Thus, farmers in the service area of the Central Valley Project indirectly receive primarily San Joaquin River water, especially during dry periods. Flows in the San Joaquin River as it enters the southern Sacramento-San Joaquin Delta (near Vernalis) are also important to the health of fishery resources in the Delta.
During 1986 and 1987, the State Water Resources Control Board (state board) developed the monthly San Joaquin River Input-Output (SJRIO) model to evaluate flows to the San Joaquin River as well as sources of salts, selenium, boron, and molybdenum. This model is discussed in detail in Appendix C of the San Joaquin River Technical Committee Report — August 1987. The model was revised for this study to evaluate the effect that various salt loads and flows would have on the San Joaquin River during this drought year.
The SJRIO model study area with the gaging stations and diversion points referred to in this paper are identified in figure 1. The four diversions shown in figure 1 (A, B, C and D) account for about 50 to 60% of the total diversions within the study area. (Diversion points are locations where water districts, or other users, pump water out of the river. Gaging stations are sites where the Department of Water Resources measures water flow and/or water quality, in terms of electrical conductivity.)
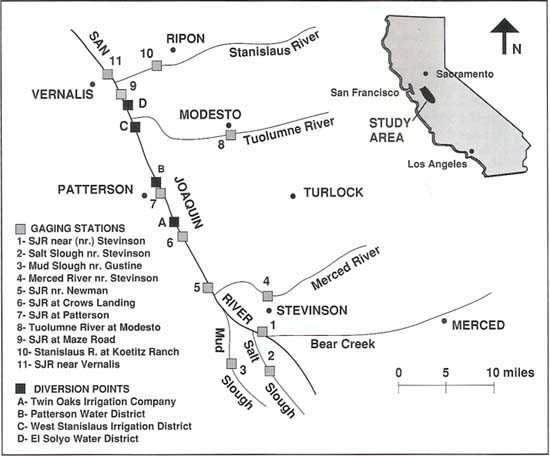
Fig. 1. San Joaquin River Input-Output (SJRIO) model study area with major gaging stations and diversion points.
The salinity near Vernalis is often estimated from projected flows based on a flow-versus-salinity curve, such as that shown in figure 2. Based on this curve, summertime flows near Vernaljs would result in salinities over 1,500 parts per million total dissolved solids (TDS) — similar to 1977. The purpose of this study was to evaluate the applicability of the curve at the extremely low flows anticipated for the summer of 1991.
We established a ‘base run’ database to estimate conditions on the San Joaquin River this summer. Several alternatives to the base run database were also evaluated. These alternatives represent changes from the base run database in terms of: (1) diversions from the San Joaquin River, (2) salt loadings from the Grasslands area, and (3) releases to the San Joaquin River from the Delta Mendota Canal. The results of the model runs are presented in terms of Vernalis salinity and flows and are compared to 1977 values.
Base run
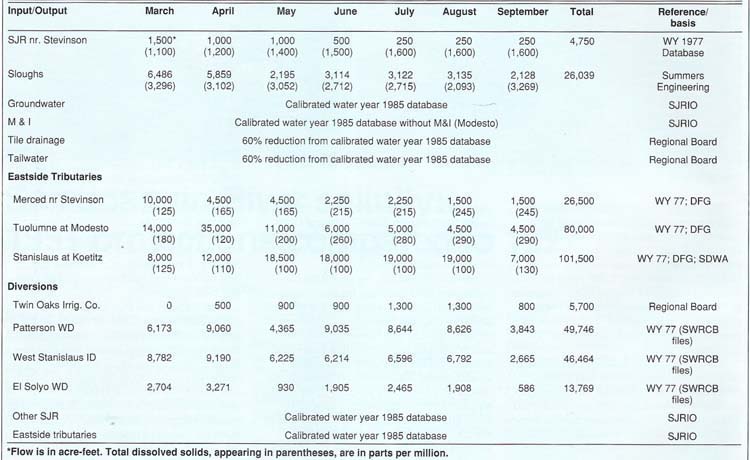
The database used for the base run of SJRIO is shown in table 1. This represents a reasonable estimate for each individual input or output. It did not necessarily represent the most likely scenario for the San Joaquin River for the summer of 1991, as will be discussed in the next section on alternatives. The base run uses a modified version of the calibrated SJRIO 1985 water year database, which was used extensively in the San Joaquin River Technical Committee work. The 1985 water year was below normal or dry, depending on the classification method used.
In this 1991 study, we modified the calibrated 1985 database for municipal and industrial discharges and the tailwater and tile drainage discharges downstream of the Mud and Salt Sloughs. Modesto municipal and industrial data was eliminated to reflect the recent conversion to land disposal. Tailwater and tile drainage discharges to the San Joaquin River downstream of the sloughs were reduced by 60%. This reduction assumed that most of the tile drainage downstream of the sloughs would be recycled in the summer except for the Newman Drainage District discharges. The tailwater reduction is based on 1977 data collected for the NPDES program of the Central Valley Regional Water Quality Control Board (regional board), and an evaluation of tailwater discharges resulting from the three major water sources (Delta Mendota Canal deliveries, San Joaquin River water, and groundwater).

Fig. 2. Flow versus salinity curve for San Joaquin River near Vernalis (based on March 1985 through September 1989 data).
Major tributary flows are based on water year 1977 data and information from the Department of Fish and Game (DFG) and the South Delta Water Agency (SDWA). These flows account for fish flow release schedules from the DFG, accretions and depletions from the dam release to the modeľs gaging station, and 70,000 acre-feet (ac-ft) of water quality releases for the SDWA on the Stanislaus River.
Total dissolved solids values for the eastside tributaries are based on flow versus salinity regressions. The regression for the Merced River near Stevinson includes data for water years 1977 to 1988. The Tuolumne River regression uses data for water years 1980 to 1988 to avoid the effect of gas wells, which were capped in the late 1970s. The Stanislaus River regression uses data for water years 1983 to 1988 so that it only includes data since the filling of New Melones Reservoir.
The data used for the sloughs in the base run was provided by Summers Engineering. It represents an ambitious reduction in flows and loads compared to average 1986-88 data.
Our data for the four major diverters on the San Joaquin River (Twin Oaks Irrigation Co., Patterson Water District, West Stanislaus Irrigation District, and El Solyo Water District - see fig. 1) are based on information provided to the regional board and the 1977 diversions reported to the state board. Patterson Water District has a pre-1914 appropriate right to divert water from the San Joaquin River. El Solyo Water District, West Stanislaus Irrigation District, and Twin Oaks Irrigation Co. have post-1914 appropriative rights.
Alternatives
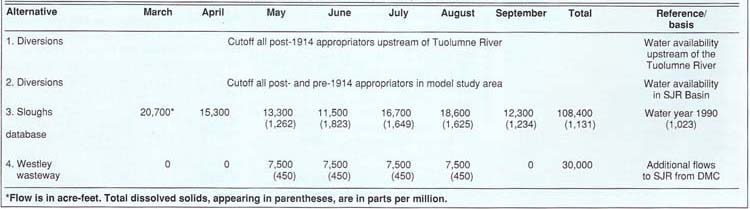
In this study, we evaluate several alternatives to the base run (table 2). These alternatives represent either areas of uncertainty in the 1991 base run assumptions (alternative 3) or possible management scenarios (alternatives 1, 2 and 4). Changes in diversions (alternatives 1 and 2) would result from water district adherence to various levels of water availability. A potential agreement between the U.S. Bureau of Reclamation and South Delta Water Agency (SDWA) for improving flow and water quality conditions in the southern Sacramento-San Joaquin Delta could result in the release of water to the San Joaquin River from the Delta Mendota Canal via the Westley Wasteway (alternative 4).
In alternative 3, we replaced the data for the sloughs provided by Summers Engineering with data from water year 1990.
Results
The results of the base run and the four alternatives are shown in figure 3 for the San Joaquin River near Vernalis. The results are presented as total monthly flow (in ac-ft) and average monthly salinity {in parts per million total dissolved solids (ppm TDS)} for March to September. The actual values from 1977 are provided for comparison.
In 1977, the salinity near Vernalis was generally higher than that upstream of the Stanislaus River confluence (at Maze Road). This was caused by saline accretions and the lack of substantial diluting flows from the Stanislaus River. For the peak irrigation months of June through August, the base run flows are about twice the 1977 flows with salinities of about 180 ppm TDS compared to about 1,000 ppm in 1977. The difference in flows is due to the availability of Stanislaus River flow storage at New Melones, which did not exist in 1977.
Base run salinities are much lower than 1977 for April through August because of improved Tuolumne River water quality and increased Stanislaus River flows. The differences for June through August are primarily due to increased Stanislaus River flows. The salinity differences are not as great in March and September when substantial portions of the upstream salt load reached Vernalis in both 1977 and the base run.
The reduction in diversions in alternatives 1 and 2 is sufficient to allow significantly more San Joaquin River flow and salt load to pass the West Stanislaus Irrigation District pumps. Thus, the cuts in diversions versions produce increasing flows and salinities near Vernalis as compared to the base run. However, when compared to salinities at Maze Road, the Vernalis salinities are greatly reduced by the Stanislaus River flows. Given the base run conditions, some reduction in diversions between alternatives 1 and 2 would be required to meet SDWA's 1991 goals of 500 cubic feet/second (30,000 ac-ft/month) flow near Vernalis with salinity less than 600 ppm TDS.
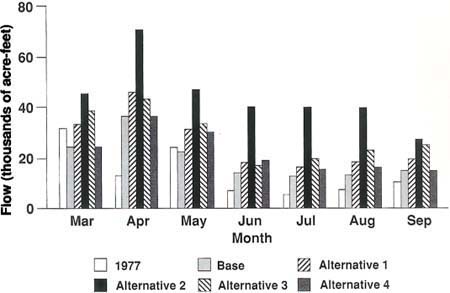
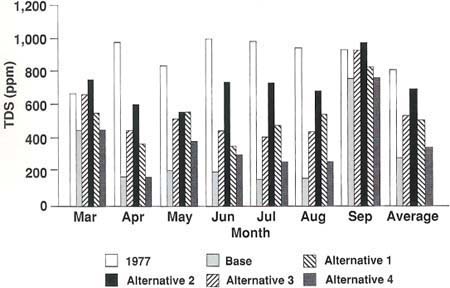
The sloughs alternative 3 produces substantially increased salinities near Vernalis as compared to the base run. The average April through August salinity in alternative 3 is about 465 ppm TDS compared to about 180 ppm in the base run. The 465 ppm average is still considerably better than in 1977. Thus, if the base run conditions had existed this summer with 1990 slough flows and loads, Vernalis water quality would have been acceptable.
The addition of 7,500 ac-ft/month at Westley Wasteway in May through August (alternative 4) results in an average increased flow near Vernalis of 4,500 ac-ft/month compared to the base run. It also results in an average increase in salinity of about 118 ppm TDS.
Summary and conclusions
This study shows that the flow-versus-salinity curve normally used to predict Vernalis water quality is not applicable at very low flows. For the base run flows of about 14,000 ac-ft/month (230 cubic feet/ second) in June to August, the flow versus salinity curve would predict a salinity of over 1,500 ppm TDS. By comparison, SJRIO predicts a salinity of 180 ppm TDS for this base run. At very low flows it becomes very important to know where the flow is coming from.

The SJRIO model results shown in figure 3 indicate that at very low flows the factor that most affects Vernalis salinity is the amount of upstream salt load (primarily from the sloughs) which travels past the diversions upstream of the Tuolumne River inflow. For the very low Merced River flows in the model runs, the greater the San Joaquin River flows are just upstream of the Tuolumne, the worse the water quality at Vernalis is. Conversely, better Vernalis water quality is projected in model runs where virtually the entire San Joaquin River is diverted upstream of the Tuolumne. In these cases the San Joaquin River near Vernalis is primarily Tuolumne and Stanislaus River waters with local accretions in these 11 miles of San Joaquin River.
The main differences between the base run and 1977 for June through August are Tuolumne River water quality (350 ppm TDS in 1991 versus 750 ppm in 1977) and Stanislaus River flows (15,000 ac-ft/month in 1991 versus 1,000 ac-ft/month in 1977). Flow and water quality in the San Joaquin River above the Tuolumne is similar in both cases. Thus, these two factors account for the differences in flows and water quality near Vernalis.
In conclusion, we estimated the flows and water quality near Vernalis in the summer of 1991 would be much better than in 1977. However, the actual levels would be largely determined by the level of diversions upstream of Vernalis, particularly the diversions upstream of the Tuolumne River confluence.
San Joaquin River salinity: 1991 projections compared to 1977

