


All Issues
California almond markets and reserve strategies analyzed
Publication Information
California Agriculture 45(4):18-21.
Published July 01, 1991
PDF | Citation | Permissions
Abstract
Marketing strategies for California almonds are analyzed based on an econometric model of almond prices. The results indicate that diverting supply from the edible market will increase industry revenue. For the bumper 1990 season, diverting 8% of supply to an allocated reserve is indicated.
Full text
California is the world's largest producer of almonds, annually producing from one-half to three-fourths of the world's total supply. Depending upon the crop size and market conditions, almonds have returned gross revenues to California farmers over the past 5 years ranging from $360 million (1985–86) to $648 million (1988–89). These revenue figures rank almonds as California's most important tree fruit or nut crop and ninth most important agricultural commodity overall.
The size of the California almond crop depends heavily upon weather conditions, particularly upon rainfall during the critical February-to-March bloom period. Despite significant year-to-year variations in the crop size, the unmistakable production trend is upward. For example, the five-year average for marketable production has risen from 244 million lb in 1975–79, to 360 million lb in 1980–84 and, finally, to 467 million lb in 1985–89. These production trends have placed pressure upon the industry to expand demand and develop new market channels. About two-thirds of the crop is now exported compared to about one-half exported during the early 1970s.
An important tool of the almond industry to promote sales and influence marketing is the federally-mandated Almond Marketing Order administered through the Almond Board of California (ABC). This order authorizes the ABC to collect and disperse funds for research and market promotion. It also authorizes the Board (with the consent of the State Secretary of Agriculture) to regulate the flow of almonds to the market through the establishment of almond reserves.
Two types of reserves may be used. A “nonallocated reserve” is used to distribute crop between marketing years or across months within a year. An “allocated reserve” distributes crop between alternative market channels, for example, domestic versus export markets or edible versus nonedible markets. In this article we formulate a demand model to predict the grower price for California almonds and then use that model to analyze alternative reserve strategies for the 1990–91 and 1991–92 crops.
Demand for California almonds
To determine the best equation to predict price, we studied a number of alternative formulas for demand, including those with different explanatory variables and functions. Our preferred model holds that the almond price obtained by California growers is dependent upon seven explanatory variables, including total quantities sold of U.S. almonds, production of competing nuts (including almonds and filberts from other countries), marketing costs, consumer income, and exchange rates. All variables are in nominal or undeflated terms. The best demand model was obtained when all variables were entered in the form of their natural logarithms. The results from estimation are summarized in table 1.
A key result is that demand for California almonds is “price inelastic.” That is, when the quantity marketed changes a given percentage, there is an opposite and larger percentage change in price. For instance, our study suggests a 1% decrease in almonds sent to market will lead to a 1.2% increase in the farm gate price. This is a very important finding for almond reserve policy because an inelastic demand means that revenue rises (or falls) as the quantity marketed falls (or rises). In addition, a reduction in sales also lowers marketing costs, further raising grower profits.
To study the effect of consumers purchasing power on U.S. almond demand, we included per capita U.S. disposable income (USDI) in the demand model. A 1% increase in USDI was associated with a 2.3% increase in U.S. grower prices. This number translates into an income elasticity of demand (the percentage sales change in response to a 1% income change) of about 1.9. The income elasticity is higher than expected, perhaps because we left out income in other consuming countries. It might also be picking up some effects of general inflation.
We used the German Deutschemark (DM) as an indicator of exchange rate movements. West Germany is by far the largest single importer of California almonds (106 million lb or about 30% of total U.S. exports in 1988–89). Therefore, the DM is likely to be the most important single currency affecting U.S. almond exports. The DM/dollar exchange rate was a successful explanatory variable in our almond pricing model. It was statistically significant and its effect was of the magnitude that theory would suggest. That is, we might expect the U.S. dollar price of almond exports to increase roughly 1% for each 1% devaluation of the dollar against the DM. Our estimate was a 1.3% increase for each 1 % devaluation, but it was not statistically different from 1.
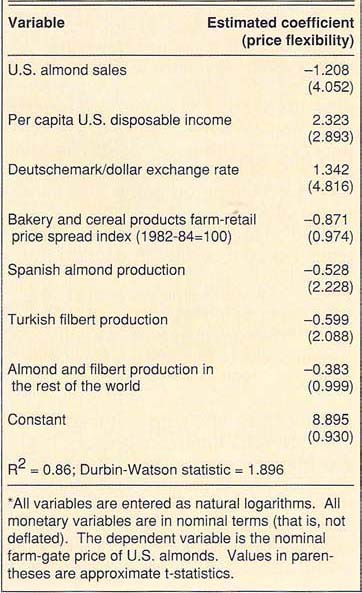
Marketing costs are the wedge between final consumer demand for California almonds and the demand faced by California growers at the farm level. As these costs increase, they have a depressing effect on grower prices, other factors remaining constant. We tried a number of alternative variables to measure the effect of marketing costs. The measure that worked consistently best was the farm-to-retail price spread index for bakery and cereal products. We found that a 1% increase in this index was associated with about a 1% decrease in grower prices. The estimate was -0.87 but not statistically different from -1.0. Once again, this result is consistent with underlying economic theory. It tells us that marketing costs are essentially passed on a dollar-for-dollar basis back to the grower. This type of outcome is likely when supply is fixed in advance and unresponsive to short-term price movements.
We restricted our analysis of competing nuts to supplies of non-U.S. almonds and filberts (hazelnuts). Other nuts, such as walnuts, pecans, brazils, and cashews, may also affect U.S. almond prices. Our demand model was greatly improved by separating out Spanish almonds and Turkish filberts from other non-U.S. almonds and filberts and treating quantities of these nuts as separate explanatory variables in the model. Spain is the world's second largest almond producer, accounting for 10% to 25% of the world supplies, while Turkey is the world's dominant filbert producer, accounting for at least 65% of its annual trade.
Although a 1% increase in California almond sales was estimated to cause the California grower price to decline by about 1.2%, a 1% increase in Spanish almond production was estimated to cause a 0.53% decline in U.S. prices. Similarly, a 1% increase in Turkish filbert production is associated with a 0.60% decrease in U.S. almond prices. Note, however, that because Turkish filbert production far exceeds the supply of Spanish almonds, a 1% change in Turkish filbert supplies involves a much greater volume of nuts than does a 1 % change in Spanish almond supply. On a pound-for-pound basis, Spanish almonds are much more important than Turkish filberts in determining California almond prices.
We also included the aggregated total of other filbert and almond production (world almond and filbert production less U.S. almond, Spanish almond, and Turkish filbert supplies) as an additional explanatory variable. A 1% increase in the supply of these nuts was estimated to cause a 0.38% decline in U.S. almond prices, but the effect was much weaker statistically than the effects of either U.S. almonds, Spanish almonds, or Turkish filberts.
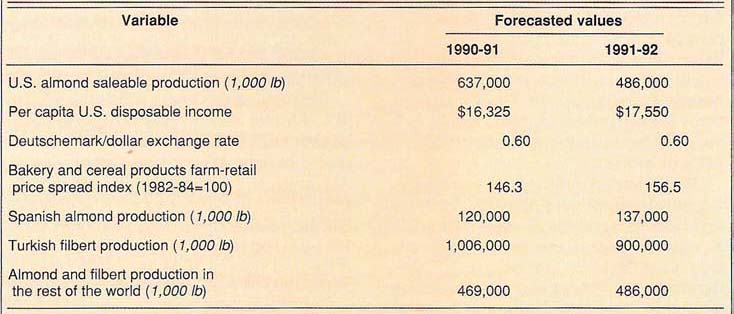
We now turn to analyze alternative marketing scenarios and reserve strategies for the 1990–91 and 1991–92 crops. To consider the various alternatives, we need to be able to forecast U.S. almond prices for the 1990–91 and 1991–92 crops. The estimated demand model in table 1 can be used for this purpose if projected values for 1990–91 and 1991–92 are available. In developing these projections we used official or unofficial government forecasts whenever they were available. In other cases we had to develop the forecasts ourselves using simple models. The forecast values for the explanatory variables used in predicting U.S. almond prices are provided in table 2.
One key point to note is that the 1990–91 California almond crop is expected to be about 637 million lb, a record or near record harvest. We forecast a significant downturn in U.S. almond production in 1991–92 due to alternative bearing effects. For this reason, the grower price for the 1991–92 crop is apt to exceed the 1990–92 price, and storage of a significant portion of the 1990–91 crop will be profitable. If the actual 1991–92 crop exceeds our forecast, grower prices will fall short of our predicted values; but our conclusions concerning reserve strategy will be essentially unaffected.
Nonallocated reserve policy
A nonallocated reserve mandates storage of a portion of the crop between years. Usually the reserve is specified as a percentage of the marketable supply, and responsibility for carrying the reserve is shared proportionally among handlers. If market conditions warrant, the ABC may authorize release of some or all of the crop to the market during the marketing year.
A point to be made at the outset of the analysis is that the private market will store a portion of any given year's almond crop to carry into the next year quite independently of any coercion from a marketing order. The larger the expected differential between the current and subsequent years prices, the greater the percentage of crop which will be stored and carried forward . Holding crop off the market in any given year will raise that year's price relative to the expected future price. A breakeven point is reached when the price difference between years just equals the cost of storage including discounting, physical storage costs, and, possibly, some risk premia. These same arguments hold for storage between months within a marketing year. The private market would be expected to respond to any price incentives to store the crop. Moreover, if storage is provided competitively, it will be done on essentially a zero profit basis so that the maximum possible returns flow back to growers.
When the amount of the 1990 crop carried forward increases, the 1990–91 price will rise and the 1991–92 price will fall, reducing the price differential between years and reducing the benefits from additional storage. The grower can readily compute the quantity to be carried forward for maximum return over the entire 2-year period, once he knows demand elasticity and storage costs.
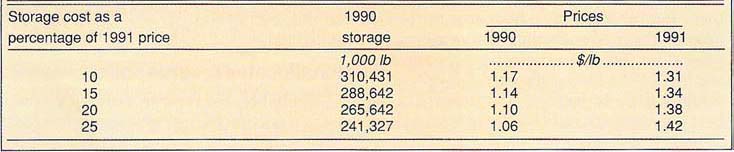
Current total annual storage costs for almonds are estimated to be about $0.24/ lb, in the range of 15 to 25% of the value of the product. We computed the optimal amount of the 1990 crop to store — to maximize revenue over the 2 years — for a range of per unit storage costs between 10 and 25% of the 1991 price. The forecast 1990 and 1991 prices and the corresponding 1990 storage volumes are presented in table 3.
Suppose the storage cost is estimated to be 20% of the 1991 price. Should any or all of the volume in table 1 (266 million lb) be committed to a nonallocated reserve? To reiterate our earlier point, the private sector has incentives to provide this storage quite independently of a marketing order. There is little reason to assume that the private sector will neglect the opportunities for profitable storage.
Allocated reserve policy
The Almond Marketing Order allows the industry to regulate the flow of product into particular market segments. One possibility is to restrict flows into the domestic market and “dump” the diverted production into export markets. Further work is needed in the form of a disaggregated demand model to establish the potential for price discrimination against the domestic market.
An alternative possibility is to take product out from the edible segment of the market and to dispose of it elsewhere—into oils, animal feeds, or the school lunch program. Because demand for California almonds is inelastic, diverting product will increase revenue from almond sales, so that, even if there is no net return to the grower from the diverted sales, it is still profitable from the growers perspective to make the diversion. When there is some residual net value to growers from sales of the diverted crop, even greater diversions are justified.
Diversions of this type involve an external benefit to the entire industry. It would not be profitable for any single handler to divert part of the crop to inedible uses even though it would be profitable for the industry as a whole if he were to do so. Unlike competitive storage, diversions to inedible uses will be underprovided by the free market from the point of view of the almond industry and, if they are to occur, they must occur by collective action — through a marketing order.
Given our forecasts of sales and price for 1990, we can provide a rough estimate of the desired amount of crop to divert if we know the value of crop to growers in the diverted uses. Since this value appears to be very low — except in the school lunch program which has limited potential — we assumed the net returns to growers from diverted sales would be zero (that is, the returns would be enough to cover marketing costs but no more than that). Our task then was simplified to finding the level of 1990 sales for edible uses that would maximize grower revenues.
We took a linear approximation to the demand function around the forecast values for price and sales, using a demand elasticity of -0.83 (1/1.21). The forecast 1990 price and sales figures we used were figures of $1.10 and 615 million lb, respectively, (that is, storage of 266 million lb — see table 3). Given these values, the level of sales that will maximize grower revenue is about 562 million lb. The implication is that the optimal diversion in 1990/ 91 would be about 53 million lb, (about 8% of the projected crop), leading to a grower price of $1.21. This policy would raise total grower revenues by about $8 million or 1.2%, not counting any profits from the diverted sales.
Two caveats to this conclusion are in order. First, our calculation assumed that 266 million lb would be held in storage in 1990-91, consistent with prices of $1.10 in 1990 and $1.38 in 1991, and storage costs of 20%. The introduction of a 53-million-lb allocated reserve disturbs this balance by raising the 1990 price. Other factors being constant, this would reduce the amount of the 1990 crop in storage because the price difference between 1990 and 1991 no longer covers costs of storage. However, if handlers anticipated that an allocated reserve of similar magnitude would be enacted in 1991, their expectations of price for the 1991 crop would also rise, restoring the incentive to carry crop into 1991.
These considerations illustrate that dynamic analysis may be important in determining optimal reserve policy. Although this is an area of work we intend to pursue, we are confident of the general accuracy and relevance of results from this study.
Secondly, any crop diversions in California will raise the world price for almonds and competing nuts in the years when California diverts supply off the market. A successful reserve program will also increase profitability for foreign producers in the years when supply is diverted. And, because foreign producers will not bear any of the costs associated with crop diversions, they will be effectively “free riders” on any such California strategy.
Any significant increase in foreign production in response to this increased profitability due to the reserve strategy will offset the effect of California's diversions on average returns and will reduce the success of the reserve strategy. A similar response will arise in California: when the policy increases profitability it will encourage greater production, eroding the benefits from the program over time.
Conclusion
We have analyzed short-term market conditions for U.S. almonds to evaluate alternative market and reserve strategies. Two factors dominated our analysis. The first is the strong signal that there is an unusual abundance of nuts in 1990-91. Along with an exceptionally large carryover from last year, this year's bumper crop in California unfortunately coincides with big crops of both almonds and filberts elsewhere. The second is the high sensitivity of U.S. almond prices to both sales of California almonds and sales of competing product (especially Spanish almonds and Turkish filberts). Demand seems to be significantly inelastic.
Putting these factors together suggests that exceptionally large volumes of California almonds should be taken off the 1990-91 market and either stored for a year or allocated to nonedible uses. We see little evidence to indicate a market failure in the private storage of almonds for edible uses, but results suggest about 8% of the crop (53 million lb) could be diverted profitably into an allocated reserve.
California almond markets and reserve strategies analyzed

