


All Issues
When water is scarce: Ground water is key to easing impact of drought
Publication Information
California Agriculture 45(3):4-9.
Published May 01, 1991
PDF | Citation | Permissions
Abstract
In contrast to projections that drought-related farm losses could climb to several billion dollars this year, a UC model predicts actual losses will be $647 million - largely due to the cushioning effect of a projected 70% increase in ground water pumping. The most significant economic impact will be felt in the South San Joaquin Valley, and along the Coast. Consumers will pay $220 million more for produce at the farm gate-an amount that may be magnified two or three times at the retail market. On page 6, the author and a colleague outline a scenario for ground water banking. They propose incentives to encourage ground water “savings” during wet and normal years — deposits to a “water bank account” which can be withdrawn in droughts
Full text

Ground water flows into irrigation canals near Winters in Yolo County.
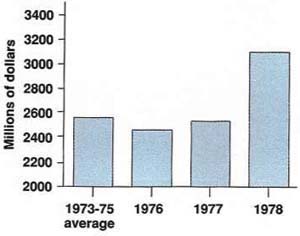
In 1977, California entered the second year of the state's worst drought since the early 1930s. Predicted agricultural losses ranged from $2.4 to $6.3 billion. Yet one year later, growers reported a 1977 net farm income that was the second highest ever recorded and very close to the pre-drought average of 1973 to 1975 (fig. 1). What happened?
First, farmers and water districts were able to offset much of the drought shortfall by greatly increasing ground water pumping (fig. 2). Second, the drought tended to drive up prices for those crops in which California specialized. However, because ground water pumping increased markedly while farm prices rose only slightly, we can conclude that ground water was the chief factor in easing the impact of drought.
In 1991, a year of continuing surface water shortages, the grower's ability to pump ground water and transfer surface water has proven essential to limiting economic loss. Such flexibility can again be expected to cushion the drough's effects on farm production, farm income and consumer prices. To provide an objective forecast of statewide agricultural losses this year, we used the California Agriculture and Resources (CAR) model developed at UC Davis. Although our assumptions concerning water supplies, distribution and cost reflect critical drought conditions prevalent before the recent spring storms, 1991 is still a relatively dry year and holdover storage in the state's surface reservoirs remains low.
The CAR model predicts farm income losses of $647 million in irrigated agriculture, with the greatest losses sustained by the South San Joaquin Valley (15.7%), the North Coast (17%), and the Central and South Coast (10.3%). It also predicts consumers will pay an additional $220 million during 1991 at the farm gate — a figure that could be magnified two or three times at the retail market.
With California drought occurring historically three years in every ten, these findings underline the need to manage ground water quality and quantity. The projected 70% increase in ground water pumping this year will result in a marked increase in ground water overdraft. Even in normal rainfall years, the Department of Water Resources estimates that Californians overdraft 2 million acre-feet of ground water annually. The scarcity of water is exacerbated by the state's population growth; 700,000 new Californians a year increase urban water demand by 100,000 acre-feet annually. California's ground water resources are finite and yearly overdrafts cannot continue indefinitely. Only by conserving ground water in normal and wet years, can the flexibility of this essential resource be maintained.

Drill rig used to ream the borehole for a new water well west of Davis.

How the CAR model works
The current version of the CAR model divides the state into 6 agronomic production regions and includes more than 40 annual and perennial crops. For each crop, prices received by California growers are related to quantities marketed here and elsewhere, demand shifts, input and resource costs, and other factors such as water availability and cost. The model shows reactions of both producers and consumers. Crop acreages, yields and prices are derived from county agricultural commissioner reports; production costs from the California Cost of Production Survey (1987 crop year); and crop water use and regional water availability from the California Department of Water Resources.
The CAR model forecast of the effects of the 1991 drought was based on four assumptions:
First assumption: Surface water supplies to agriculture would be cut by an average of 80%. (This reflects announcements made before the recent March storms of 100% cuts by the State Water Project, 75% cuts by Federal Central Valley Project and similar cuts by other water supply agencies.)
Second assumption: Ground water pumping would increase up to 70%, a figure based on past experience and current well capacity. As a result, net water use would drop somewhat, but far less than the reduction in the surface supply. The assumed net regional reductions in irrigation water use were:
-
Sacramento region (Tehama, Glenn, Butte, Colusa, Yuba, Sutter, Yolo, Sacramento, Solano Counties): 12%.
-
North San Joaquin Valley (SJV) region (San Joaquin, Stanislaus, Merced Counties): 17%.
-
Central SJV region (Madera, Fresno, Tulare, Kings Counties): 20%. South SJV region (Kern County): 30%.
-
Bay Area and Northern Coastal region: 10%.
-
Central and South Coast region: 35%.
-
Imperial and Coachella Valley region: No reduction.
For the entire Central Valley, the average 1991 reduction in water use was assumed to be just under 18%. (This is a weighted average, taking into account regional water use in a normal year.)
Third assumption: Average water costs to farmers would double. This figure used by the CAR model is, obviously, an estimate. It is based on the following reasoning: Farmers would have to pay some fixed charges for surface water even if they did not receive it. Furthermore, ground water pumping costs would be higher than normal because of higher power rates, deeper depths and use of some less efficient pumps. Part of the available surface water would come from transfers costing $130 or more per acre foot even before conveyance. Overall, doubling of water costs is an ad hoc assumption, but probably not far off.
Fourth assumption: Perennial crops, with most capital cost and crop income at risk, would bid most for the scarce supply; as a result, sufficient water would move within regions so that 95% of tree and vine crops would produce normal yields. Thus, perennial crop producers would find it worthwhile to buy water from the Water Bank for $140 plus conveyance costs. It was also assumed that annual crops would not be planted unless the grower had a reasonable expectation of enough water to bring the crop to maturity. Therefore, per-acre yields of the annual crop acreage that is planted would be close to normal.
Impacts on acreage
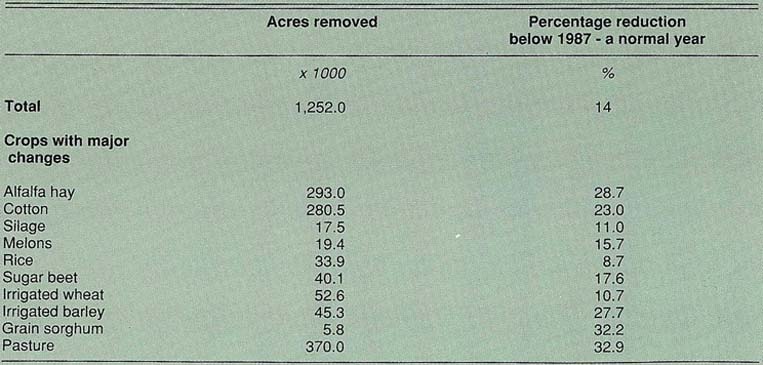
Using these assumptions, the CAR model projected statewide crop acreage changes during the 1991 drought-impacted growing season. Estimated changes for those crops most affected are shown in table 1.
Differences among the various crops in the table are largely due to the fact that greater decreases in acreage can be expected for (1) higher water-use crops and (2) lower per-acre value crops. Irrigated pasture, for example, fits both of those categories; and irrigated pasture is projected for the largest acreage reduction of all, almost one-third. Other crops with substantial projected drops in acreage are grain sorghum, alfalfa, irrigated barley and cotton.
The total reduction in Central Valley acreage of 10 leading crops (14%) is less than the projected 18% overall drop in water use. Again, this is because some high water-using crops were expected to be reduced disproportionately.
Impacts on prices and income
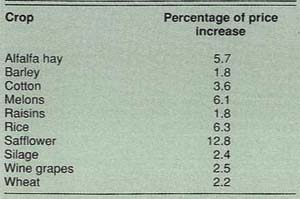
To the extent that cuts in acreage result in less production of various crops, farm income will be affected. However, the grower's financial loss will not be in direct proportion to his reduced yield, because prices can be expected to strengthen at least slightly in response to lower production. Price responses of several dozen important crops are built into the CAR model. Crops showing most flexibility (greater price responses to a given change in production) include celery, lettuce, wine grapes, avocadoes, plums, safflower, citrus and rice. Crops with least flexibility are alfalfa hay, alfalfa seed, barley, corn, cotton, grain hay, grain sorghum, silage and sugar beets.
Given the foregoing assumptions about water supply, water costs, acreage reductions and lower output in 1991, what price impacts related to drought could be expected for various crops? The CAR mode's projections for 10 representative crops are shown in table 2.
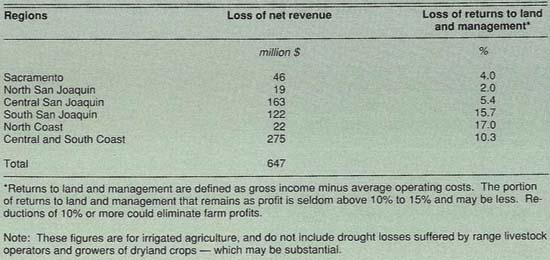
How would these acreage and price changes affect farm income? Table 3 shows the CAR mode's projections, amounting to a total loss of $647 million in net farm income. The highest dollar loss, more than $275 million, is forecast for the Central and South Coast regions, where a 35% cut in irrigation water supplies is assumed for 1991.

Farm near Winters.
A loss of more than $163 million, is forecast for the Central San Joaquin Valley region. That is 5.4 % of the region's expected returns to land and management. A somewhat lower dollar loss ($122 million) — but a much higher percentage of returns loss (15.7%) — is indicated for the South San Joaquin Valley.
Consumers also have a stake in the drough's impact on California agriculture. The CAR model projects that consumers will pay an additional $220 million during 1991 at the farm gate — a figure that could be magnified to $440 or $660 million in the retail food system. (The exact impact of increased farm prices on retail prices is unknown. However, the average proportion of farm value in retail prices is 24%. Furthermore, unpredictable seasonal factors may increase prices even more.)
Increased consumer costs will be concentrated in those crops that show large farm price changes: fruits and manufactured dairy products, the latter due to indirect feed costs. Estimates were calculated by measuring the extra amount that purchasers would have to pay for produce under drought conditions, and also the loss of consumption benefits for those who could not, or would not pay the higher prices for reduced quantities. Calculations were based on 23 years of data describing consumer behavior.
Conclusion
In addition to the need for objective analysis of probable impacts on agricultural output and prices, two other lessons can be learned from the droughts of 1977 and 1991.
First, if surface supplies of irrigation water can be readily moved from low-value to high-value uses within agriculture by a market or water bank method, the total impact on farmers, urban areas and consumers of food will be greatly reduced.
Second, ground water is California's key water resource; and die ability to use ground water conjunctively with the surface supply is its most valuable characteristic. It is vitally important to take advantage of wet years as an opportunity to reduce use of ground water and recharge the supply. It is also vitally important to protect ground water quality.
When water is scarce: Ground water is key to easing impact of drought

