


All Issues
Irrigation uniformity and cotton yields in the San Joaquin Valley
Publication Information
California Agriculture 45(1):13-15.
Published January 01, 1991
PDF | Citation | Permissions
Abstract
Cotton yield data collected from 32 fields in the Broadview Water District are negatively correlated with several measures of soil salinity, sodicity, and irrigation uniformity. Results suggest that farmers may be able to increase cotton yields by improving irrigation uniformity on surface-irrigated fields.
Full text
Since 1979, when federal and state agencies began seeking long-term solutions to agricultural drainwater problems in the San Joaquin Valley, many experts have been suggesting that improvements to irrigation management that would reduce drainwater volumes be made at the farm level. One proposal is to improve irrigation infiltration uniformity within farm fields. Non-uniform infiltration increases drainwater and may reduce crop yields. More uniform infiltration, on the other hand, may reduce drainwater volumes while increasing crop yields.
The most common irrigation method in the San Joaquin Valley's drainage problem area is siphon-tube furrow irrigation with V^-mile runs. Irrigators generally run set times of 12 or 24 hours to accommodate labor and water availability. They can improve infiltration uniformity in furrow irrigation in a number of ways: reducing the length of furrow runs; increasing water inflow rates, and so reducing set times; using surge irrigation techniques, especially during pre-irrigations; or scheduling water deliveries and irrigations accurately to keep applied water depths in balance with evapotranspiration losses and soil water holding capacity.
Variations in soil characteristics constrain the degree to which irrigators can reduce drainwater volumes through improved water management. Soil characteristics govern the infiltration rates and uniformity of a surface-irrigated field. A properly designed and maintained pressurized irrigation system transfers most of the infiltration control to the system. Sprinkler irrigation, low-energy precision application (LEPA), and subsurface drip systems may improve infiltration uniformity in a field with considerable variation in soil characteristics.
Farm-level decisions regarding irrigation system improvements must take into account the costs and returns involved in installing a new irrigation system or managing an existing system more efficiently. The annualized capital costs of siphon-tube and gated pipe systems range from $20 to $30 per acre, while those costs for pressurized sprinkler and drip irrigation systems range from $40 to $180 per acre. Reduced production costs (associated with labor, weed control, and tillage) offset some of the higher capital costs of a pressurized system, but the pressurized system's total annual costs remain the higher of the two, according to the 1988 report of the UC Committee of Consultants on Drainage Water Reduction, As-sociated Costs of Drainage Water Reduction.
Farmers need to see that there are economic advantages to pressurized irrigation if they are to switch over. The water savings from more efficient water application and the associated potential increases in yield are sources of increased net revenue. A lower drainwater volume will mean a major cost reduction for farmers who have to dispose of drainwater on their own property. The profitability of a furrow irrigation system for cotton falls below that of a subsurface drip, LEPA, or linear-move sprinkler system when the cost of drainwater disposal exceeds about $70 per acre-foot, assuming the pressurized system applies water with greater uniformity. Once farmers see field-level data that describe the potential benefits of improved irrigation uniformity, they will be more likely to implement irrigation management improvements and adopt pressurized systems where appropriate.
Methods
We collected data describing the soil characteristics, crop yields, and irrigation depths of 32 cotton fields (3,682 acres total) in the Broadview Water District during summer, 1987. Soil salinity and sodicity data came from the soil samples we collected, while irrigation and crop yield data came from district water delivery records and annual crop reports.
One soil sample was collected from the 0-to-3-foot depth interval at each of 20 sites arrayed in a rectangular grid in each field. Most fields encompassed 160 acres. Each sample was mixed thoroughly before subsampling. We prepared 8 samples for analysis of sodium adsorption ratio and the electrical conductivity of the saturated extract.
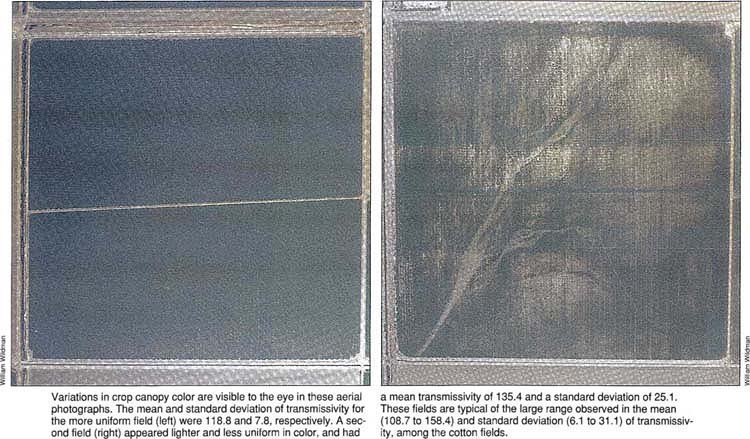
Variations in crop canopy color are visible to the eye in these aerial photographs. The mean and standard deviation of transmissivity for the more uniform field (left) were 118.8 and 7.8, respectively. A second field (right) appeared lighter and less uniform in color, and had a mean transmissivity of 135.4 and a standard deviation of 25.1. These fields are typical of the large range observed in the mean (108.7 to 158.4) and standard deviation (6.1 to 31.1) of transmissivity, among the cotton fields.
Electrical conductivity (ECe) describes the amount of salt present in a soil, indicating the likelihood that plant growth may be affected by soil salinity. Cotton is a relatively salt-tolerant crop; an ECe below 7.7 decisiemens per meter (dS/m) usually will not reduce its yield. The sodium adsorption ratio (SAR) is a measure of the number of sodium ions attached to soil particles, relative to the number of calcium and magnesium ions. A large number of sodium ions (high SAR) will degrade soil particles and reduce the number of large pore spaces in the soil. Such a soil is not very permeable, and it is difficult to leach accumulated salts from such a soil by applying excess water. Fields where soils have high ECe and high SAR may contain areas of low permeability with accumulated salts.
Five of the eight soil samples analyzed from each field were composites: four contained soil from each of five sites along a single transect, and one contained equal portions of soil from all twenty sites. The other three samples contained soil from individual sites: two were selected from sites with the highest apparent ECe as determined with a portable salinity meter, and one was from the site with the lowest apparent ECe.
Most of the cotton fields were irrigated from earthen head ditches, using siphon tubes to deliver water to furrows that were V2 mile long. We obtained field-specific irrigation data for 28 of the 32 fields, using irrigation district data from propeller meters placed in field turnout structures to record water deliveries. For each field, we determined applied water depths for pre-irrigation and seasonal irrigations by dividing the total volume of delivered water by the total planted area. Surface runoff flowed into district drainage ditches, and was not recirculated by individual farmers. We did not separately measure runoff and deep percolation, so the applied water depths reported in this study include these amounts.
Aerial photographs of all cotton fields were obtained from an elevation of 4,800 feet on July 29,1987. Each color photograph was taken when the plane was directly over the center of the appropriate field. After processing, we put each color positive on a light table where it was scanned by a video camera attached to a computer running an image processing program. The software analyzed the positive's ability to transmit light at each dot (pixel) in the video image. High trans-missivity values of individual pixels indicated light-colored soils showing through spaces in the crop canopy, while low values indicated densely covered, dark green areas.
Each pixel represented an area of 46 square feet, so 947 pixels described 1 acre of land. Software written by the Image Processing Facility in the Electrical Engineering Department at UC Davis calculated the mean and the standard deviation of transmissivity for each field. The mean transmissivity describes the average light value for the field. The standard deviation of transmissivity describes how much it varied within a field. A high standard deviation indicates that many individual pixels were lighter and darker than the mean. Low standard deviations indicate that most individual pixels were very close to the mean.
Analysis
Like the aerial photographs, our salinity and sodicity data show considerable variation among farm fields. The field average SARs in saturated soil extracts ranged from 3.95 to 15.83, with an overall mean of 7.77 and a standard deviation of 2.85. The field average ECe ranged from 1.36 to 8.16 dS/m, with an overall mean of 4.23 dS/m and a standard deviation of 1.99 dS/m.
The within-field variability range of soil salinity and sodicity is described by the range in the standard deviations of site-specific measurements. The lowest standard deviation of SAR for a single field was 0.49, and the highest was 4.75. Standard deviation of ECe ranged from a low of 0.11 dS/m to a high of 3.27 dS/m.
Table 1 lists minimum, maximum, and mean values and standard deviations for pre-irrigation depth, seasonal irrigation depth, total applied water, and cotton crop yield per field. Cotton yields correlate negatively with the mean and standard deviation of the soil salinity and sodicity measures. The negative correlations are statistically significant (table 2), and suggest that fields with low salinity and low sodium adsorption ratios also have higher cotton yields. Higher yields are also associated with fields having little variation in ECe and SAR.
Cotton yields are negatively correlated with the standard deviation of crop canopy color (measured as transmissivity). That negative correlation is not statistically significant, but it appears to suggest that fields with relatively uniform crop canopy color have higher yields.
Cotton yields correlate positively with pre-irrigation depth, while total applied water correlates positively with the mean and standard deviation of ECe and the standard deviation of SAR (table 2). These results suggest that more irrigation water is applied on fields that are more saline and on fields where the variation in ECe and SAR is high. Fields receiving larger pre-irrigations had greater cotton yields.
Several of the measures of soil salinity, sodicity, and transmissivity are correlated with each other and with crop yield. The mean of transmissivity is positively correlated with the mean and standard deviation of ECe and SAR (table 2), suggesting that fields that look lighter from the air are more saline and more sodic than darker fields. The standard deviation of crop canopy color is positively correlated with the mean ECe and the standard deviation of SAR.
Conclusions
We did not expect to find significantly negative correlations between crop yield and the means and standard deviations of ECe and SAR, given our knowledge of cotton's tolerance of salinity and sodicity. The threshold salinity for yield reductions in cotton (7.7dS/m) is slightly less than8.2dS/m, the maximum field average observed in this study. One explanation for the significant correlation between yield and sodicity is that yield correlates negatively with ECe, which in turn correlates positively with SAR in Broadview soils.
The correlation between yield and the standard deviation of ECe is statistically more significant than the correlation with the mean. This suggests that some areas in many of the cotton fields are excessively saline. However, fewer than 15 of site-specific and transect-average ECe values for the 32 cotton fields exceeded cotton's threshold ECe of 7.7 dS/m. This low percentage is particularly significant because we had selected two of the eight soil samples based on their having the highest apparent conductivity in the field.
The ECe values describing soil salinity in the first three feet of soil depth may be lower than the average salinity in the root zone for mostfields.Thenegativecorrelationbetween yield and ECe may result from salinity that exceeds the threshold value in some portions of the root zone. Salinity often increases with soil depth in irrigated fields.
A more fundamental question arises when we look at the ECe and SAR values: Why are some of the values so high? Most of the fields in Broadview have been drained artificially by 6- to 9-foot-deep tile drains since the 1960s and 1970s. Before 1983, all of the collected drainwater was recirculated and blended with irrigation deliveries. As soil salinity thus increased in the district, growers shifted to salt-tolerant crops including cotton and grains. When an outlet was opened for disposal of drainwater in 1983, irrigation water quality improved, soil salinity decreased, and growers became more interested in moderately salt-tolerant crops including tomatoes and melons (California Agriculture, January-February 1988). Since 1983, good-quality irrigation water has been used on all fields in Broadview.
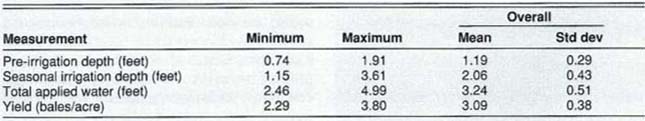
Table 1. Range and variation of Irrigation and yield data collected from 28 cotton fields in the Broadview Water District, 1987

Table 2. Correlaions between cotton yields, applied water, soil characteristics, and crop canopy color in the Broadview Water District, 1987*
The maximum observed means of ECe and SAR in soils of individual fields are respectively 20.4 and 31.7 times greater than the corresponding values for the irrigation water. ECe and SAR will be low in areas of high infiltration because of substantial leaching with good-quality irrigation water. In areas with low infiltration rates, ECe and SAR will be higher because they experience less leaching and because evapotranspiration exercises a greater concentrating effect. The effects of this “evapoconcentration” are enhanced by lateral movement of water and salt within the soil from areas of high infiltration to areas of low infiltration. In addition, high SARs in the soil can reduce the infiltration of low-salinity irrigation water. The high ratios of soil ECe and SAR to the corresponding values for irrigation water in Broadview suggest that some fields and areas within fields have low infiltration rates.
The observed negative correlations between the crop yield and the mean and standard deviation of salinity and sodicity probably result from infiltration variability, which causes variability in the amount of water available for plant growth. This conclusion is consistent with the positive correlations between yield and pre-irrigation depth and between total applied water and soil salinity. Logically, farmers would apply more water to saline fields and to fields that exhibit poor plant growth in various areas of the field.
Our results suggest that growers can increase cotton yields by improving the infiltration urdformity on surface-irrigated fields. Estimates of yield increases may give growers part of the economic incentive they need before adopting irrigation methods that improve infiltration uniformity. Reductions in irrigation water costs and drainwater disposal costs provide even more incentive.
Irrigation uniformity and cotton yields in the San Joaquin Valley

