


All Issues
Financial effect of limiting pesticide use near schools for almonds in nine counties depends on soils and weather
Publication Information
California Agriculture 74(1):23-29. https://doi.org/10.3733/ca.2020a0001
Published online March 17, 2020
PDF | Citation | Permissions
Abstract
Effective Jan. 1, 2018, the California Department of Pesticide Regulation enacted a regulation regarding the use of pesticides near public K-12 schools and licensed child day care centers, including a provision that bans specific types of applications, including air-blast and air-assist, during weekday school hours (6 a.m. to 6 p.m.) to provide an additional safety margin for pesticide exposure beyond those provided by other regulations. We considered the financial effect on almond growers in nine counties, accounting for four-fifths of total almond production in 2014, if they had been unable to complete a standard spring disease management program on any buffer zone acreage. Results indicated that total annual losses for those counties if such a regulation had been in effect would have been $8.7 million, with per-acre losses ranging from 22% to over 50% of total operating costs, depending on the county. However, using a methodology that took into account historical weather and soil hydrologic group data, we estimated average annual losses in the nine counties among almond growers would have been under $0.2 million because the regulation would have affected the number of sprays completed for relatively few acres in relatively few years.
Full text
Economic analyses can provide policymakers with a more complete picture on the potential impacts of pesticide regulations on agriculture. Employing historical pesticide use data is common in this type of analysis (Steggall et al. 2018); however, incorporating additional detail, such as weather and soil type, into the analysis can further refine how many acres would be impacted and how often. The interplay of soil type, historical weather and pesticide use data can be used to estimate field conditions and therefore whether or not the field can be accessed by spray equipment for critical pesticide applications. The example used in this study focuses on springtime disease management in almond, which can be critical in preventing yield loss.
While the California Department of Pesticide Regulation (DPR) has used restrictions on applications based on weather conditions and locations near sensitive sites for specific active ingredients for some time, most notably for fumigants, a recent regulation applied broadly to most pesticide applications based on location and day and time of application. Regulations on pesticide use that specify limits based on location and time of application can reduce the total economic impact on an industry compared to broad regulations that limit all applications. Specifically, DPR enacted a regulation regarding the use of pesticides within a quarter mile of K-12 public schools and licensed child day care centers (collectively called schoolsites), which went into effect Jan. 1, 2018 (DPR 2017a, 2017b). Prior to this regulation, DPR was charged with a number of directives to promote the safe use of pesticides near schools and child care centers through the Healthy Schools Act of 2000 and its subsequent amendments (DPR 2019). Among other provisions, the 2018 regulation prohibits specific types of pesticide applications, including air-blast and air-assist spraying, on weekdays from 6 a.m. to 6 p.m. The purpose of this prohibition was to “provide an extra margin of safety and minimum standards for applications near schools and child day care facilities (schoolsites)” (DPR 2018).
Almonds, which were California's second most valuable crop in 2014, are susceptible to early spring diseases. If growers are unable to complete a series of pesticide applications, these diseases can cause yield losses of up to 75%.
We estimated potential net revenue losses for almond growers in nine California counties due to this provision. Specifically, we assessed losses due to weather and soil conditions that would have prevented growers from treating acreage within a buffer zone with fungicides more than once outside of the banned time window. (We focused on disease management as insect and weed control tend to have more flexible timing and those applications could therefore be more easily adjusted in order to comply with the regulations.) Almonds were selected for three reasons: (1) the substantial California almond acreage and crop value (second most valuable California crop in 2014 [CDFA 2015a]); (2) the importance in almond disease management of air-blast or air-assist pesticide applications early in the year when rain events might restrict access to orchards; (3) almond production has the largest acreage within the specified buffer (7,245 acres, roughly 1% of planted acreage). In the nine counties studied, the 2017 Census of Agriculture reported 5,955 operations with almond acreage, and the average number of acres per operation was 172 (USDA NASS 2019). Both numbers were higher than in the 2012 Census of Agriculture, which reported 5,284 operations with almond acreage in these counties, with 142 acres as the average per operation (USDA NASS 2014).
The nine counties — Fresno, Kern, Kings, Madera, Merced, Sacramento, San Joaquin, Stanislaus and Yolo — represented 81% of the total California production value for almond in 2014. These counties were chosen because of the availability of information on GIS-based buffer zone acreage by soil hydrologic group. Using conservative assumptions regarding soils and buffer zone acreage, we estimated losses for eight additional counties — Butte, Colusa, Glenn, Solano, Sutter, Tehama, Tulare and Yuba — that account for virtually all of the remaining California almond production (fig. 1). Seven of these eight counties in the secondary analysis are located in the northern Sacramento Valley, which tends to receive higher rainfall than the other almond-growing regions.
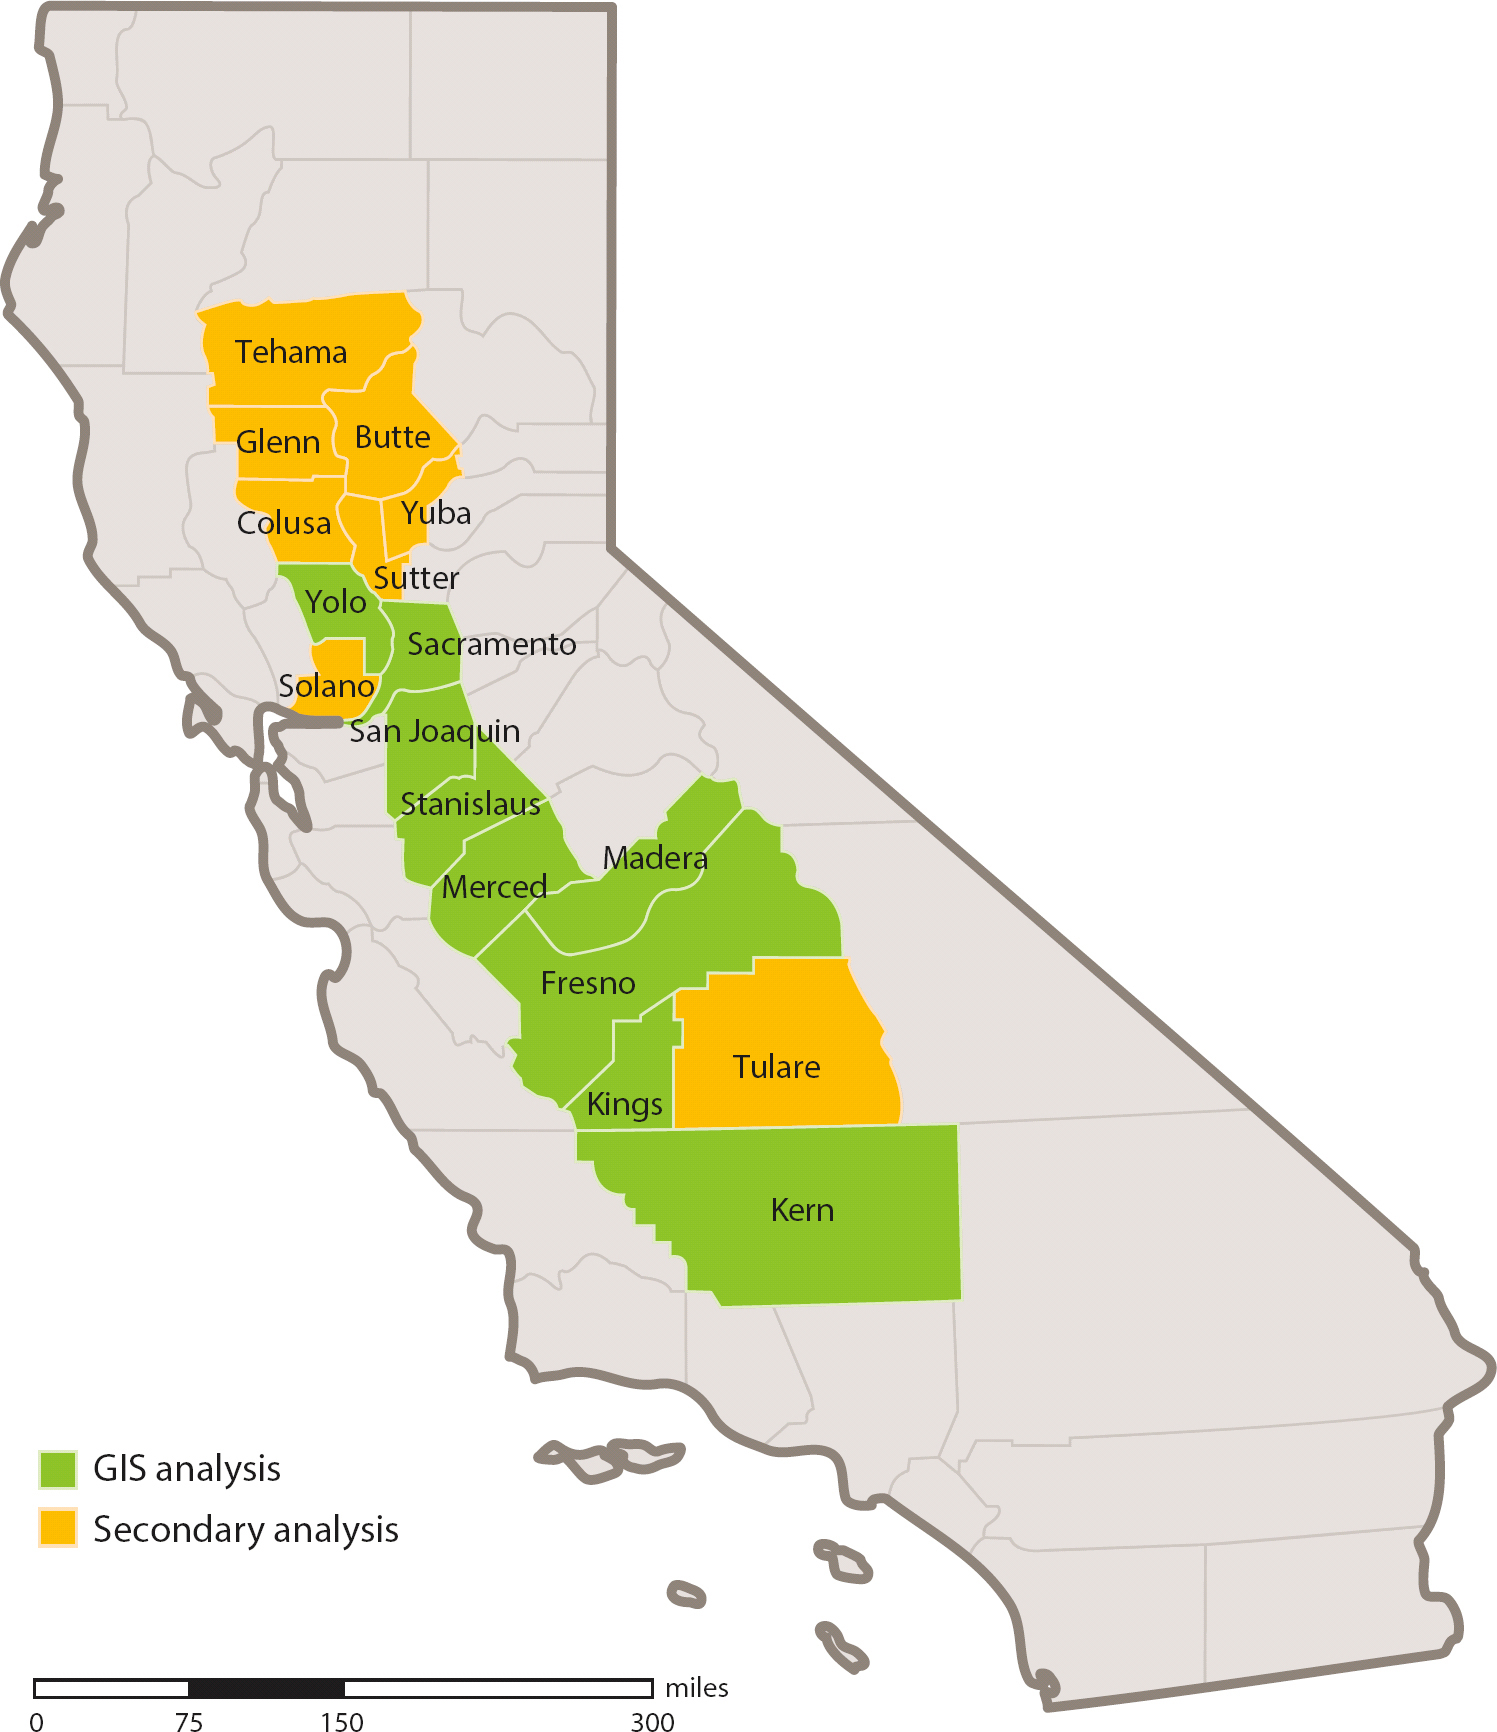
FIG. 1. Losses due to the regulation were studied in nine almond-producing counties, representing 80% of production, where information was available on GIS-based buffer zone acreage by soil hydrologic group. In a secondary analysis, using conservative assumptions regarding soils and buffer zone acreage, losses due to the regulation were estimated for eight additional counties, accounting for almost all the remaining California almond production.
We followed the general methodology presented in Steggall et al. (2018), integrating data on pesticide use with GIS data and weather and soil data to provide a precise picture of potential regulatory impacts. Pesticide use data allowed identification of fields using restricted application methods; GIS data identified orchards near schoolsites; weather and soil type data determined when applications could be made.
Our analysis was limited in scope. We estimated the cost only of a specific regulatory provision for a specific crop in specific counties for a specific disease management program, not statewide costs to all agriculture, or even to the entire almond industry. We did not assess any market or nonmarket benefits that may be realized from the regulation, such as improved child health outcomes, and thus did not evaluate the overall efficiency or net social welfare impact of the regulation.
Control of almond spring diseases
Almonds are the earliest blooming of all deciduous fruit, nut and vine crops in California. The first bloom for the Nonpareil cultivar starts about the second week of February with 100% petal fall by late February or early March. The pink bud stage precedes bloom by about one week. The precise start of bloom depends on temperatures in January and early February. Geographically, the bloom starts in the southern San Joaquin Valley and northern Sacramento Valley before proceeding to the Sacramento Delta region. Total bloom period for each region occurs within about two weeks.
Almonds are susceptible to a number of early spring diseases. If uncontrolled, diseases can cause yield losses of up to 75%, according to our communications with UC Cooperative Extension (UCCE) and U.S. Department of Agriculture (USDA) personnel, growers and pest control advisers. The extent of yield loss depends on disease inoculum present, amount of rain and number of rain events, and temperature, which affects disease development. Precipitation also impacts whether a treatment can be made and treatment efficacy. Growers typically apply a fungicide at pink bud followed by a second application within 7 to 10 days at full bloom. These two applications are for brown rot and, to a lesser extent, green fruit rot and anthracnose control. A third treatment is applied at petal fall, 7 to 10 days after the second application, principally for shot hole and anthracnose control. Thus, three critical fungicide applications are often made within 14 to 20 days.
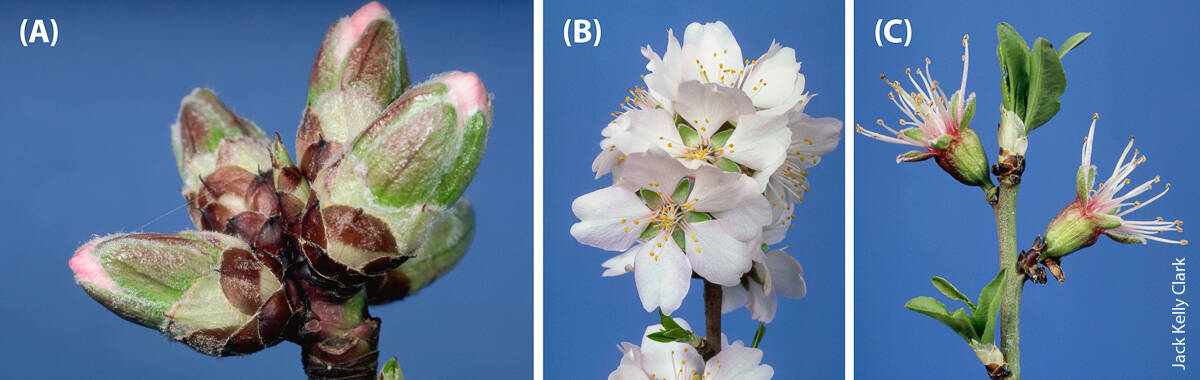
Growers typically apply a fungicide at pink bud (A) followed by a second application within 7 to 10 days at full bloom (B). These two applications are for brown rot and, to a lesser extent, green fruit rot and anthracnose control. A third treatment is applied at petal fall (C), 7 to 10 days after the second application, principally for shot hole and anthracnose control.
Estimated yield losses from reduced fungicide applications vary by region. If only one of the three applications can be completed, yield losses will be 0% to 15% in the southern San Joaquin Valley, 15% in the northern San Joaquin Valley and 25% in the Sacramento Valley, according to UCCE and USDA personnel, growers and pest control advisers. If two applications can be completed, yield losses generally will be minimal, assuming that inoculum levels are low owing to an ongoing disease management program.
The majority of fungicides are ground applied, usually in daytime. When the ground is too wet to operate ground equipment, fungicides are applied aerially. However, aerial applications have two disadvantages: (1) they are slightly less efficacious than ground applications and (2) the fixed surcharge for aerial applications is often not cost effective for growers with small acreages. Accordingly, under heavy rain pressure ground applications may be advanced or delayed a few days from their optimal timing rather than replaced with aerial applications. UC plant pathologists suggest that a 3- or 4-day window around the optimal time provides acceptable control. The fungicide application rate may be increased to partially compensate for less than optimal timing.
Our analysis did not address the effect of weather itself. Instead, it addresses the differences in the effect of weather with and without the regulation. Regardless of the number of sprays a grower could apply, the regulation would only have an effect on yield, revenue and production costs if the number of sprays would have been different with the regulation than without it — that is, if a grower could not spray on a weekend or on a weekday between 6 p.m. and 6 a.m. when the regulation was not in effect, then there was no incremental loss due to the regulation.
Study approach
To capture the spatial and temporal dimensions of the regulation, the day and time of fungicide applications to almond between July 1, 2013, and June 30, 2014, in orchards that intersect a schoolsite buffer were extracted from DPR's Pesticide Use Reporting (PUR) database.
The composition hydrologic group of an orchard's soil has a strong influence on the delay between a rain event and when mechanized sprayers can be used. Soils with high sand content (group A) drain faster and can support ground equipment sooner than soils with a high clay content (groups B, C and D). To quantify the impact of the differences in soil drainage on yield losses, we calculated buffer acreage within each soil hydrologic group using the Natural Resources Conservation Service Soil Survey Geographic Database (SSURGO) soil spatial layer.
The authors’ analysis of historical weather and soil data suggests that average annual losses among almond growers in the study area would have been less than $0.2 million, as the pesticide regulation would have affected relatively few acres in relatively few years.
Using potential yield loss information and the UC IPM Pest Management Guidelines (Haviland et al. 2017), we developed a typical disease management spray program, which was then simulated using soil hydrologic group data for buffer zone acreage and 10 years of weather data, including information on temperature, precipitation and wind, to determine the number of sprays that would be affected. The time period for the weather analysis, 1996 to 2005, was selected to match available data regarding almond bloom stages.
There are a number of limitations of our analysis that may lead to over- or underestimation of losses in the nine counties. First, the analysis assumed schools and day care centers were open on all weekdays. Thus, losses may be smaller than estimated because growers could make applications on weekdays when schools were not occupied (e.g., holidays). Second, the data did not differentiate between bearing and nonbearing acres, which could overestimate losses because nonbearing acreage would not be impacted. This consideration was more than offset by the substantial recent increase in almond acreage, the source of a third limitation: The analysis was based on almond acreage and pesticide use data from July 1, 2013, to June 30, 2014, so it does not include acreage that came into production in more recent years.
A final important limitation is that the time intervals we considered did not account for recommended limitations on fungicide applications designed to protect bees pollinating almond orchards, so losses may be underestimated. The California Almond Board (n.d.) recommends that fungicide applications be made in the late afternoon and evening so that the product is dry before bees begin foraging in the morning once pollen shed begins. With early morning applications not recommended, applications are limited to only a portion of the 6 p.m. to 6 a.m. interval permitted in the formal regulation.
Typical spray program
A typical spray program includes sprays in each of three bloom stages: (1) pink bud, which is the first day of bloom, (2) full bloom, the midpoint between first and last day of bloom and (3) petal fall, the last day of bloom. Ground applications are possible if the soil is not too wet, which is a function of the amount and duration of precipitation and soil hydrologic group. The following rules were used to determine the 12-hour time blocks (6 a.m. to 6 p.m. and 6 p.m. to 6 a.m.) in which an application could be completed successfully:
-
If a spray could have been made within 3 days of its optimal time, then there was no yield loss.
-
Nighttime ground applications were possible if rain history and soil type permitted.
-
A successful spray required no rain events during the 12-hour block when the application was made and in the 12-hour blocks proceeding and following that block.
-
Weekend sprays were permitted during the day or night.
-
Applications could have been made if wind speed was < 10 mph for at least 6 hours in a block of 12 hours.
These rules were applied to each 12-hour time block to determine whether a weekday nighttime ground spray or a weekend spray was possible. Spray possibilities in the absence of the regulation also included weekday daytime sprays. The numbers of sprays possible with and without the regulation within the optimal time windows were compared for each bloom period.
Spraying cost reduction per acre
When fewer sprays are applied, treatment costs decline. In our study, reductions in treatment costs decreased the net revenue losses per acre due to the regulation. According to UC Cost and Return Studies (Duncan et al. 2016; Pope et al. 2016), missing one or two sprays reduces spraying costs by $40 and $81 per acre, respectively. As is always the case, growers’ costs can vary. If a grower's costs differ from these values, the net revenue per acre losses will differ as well.
Net revenue losses per acre
The most drastic impact of weather on a typical spray program would be to prevent any bloom sprays from occurring. However, weather data indicate that this outcome is extremely unlikely. Based on weather patterns during the study period, we estimated net revenue losses per acre when only one spray could be completed for 17 major almond-growing counties, organized by region (table 1). Losses per acre for southern San Joaquin Valley counties are reported for 15% yield losses, the upper bound of the estimated 0% to 15% range.
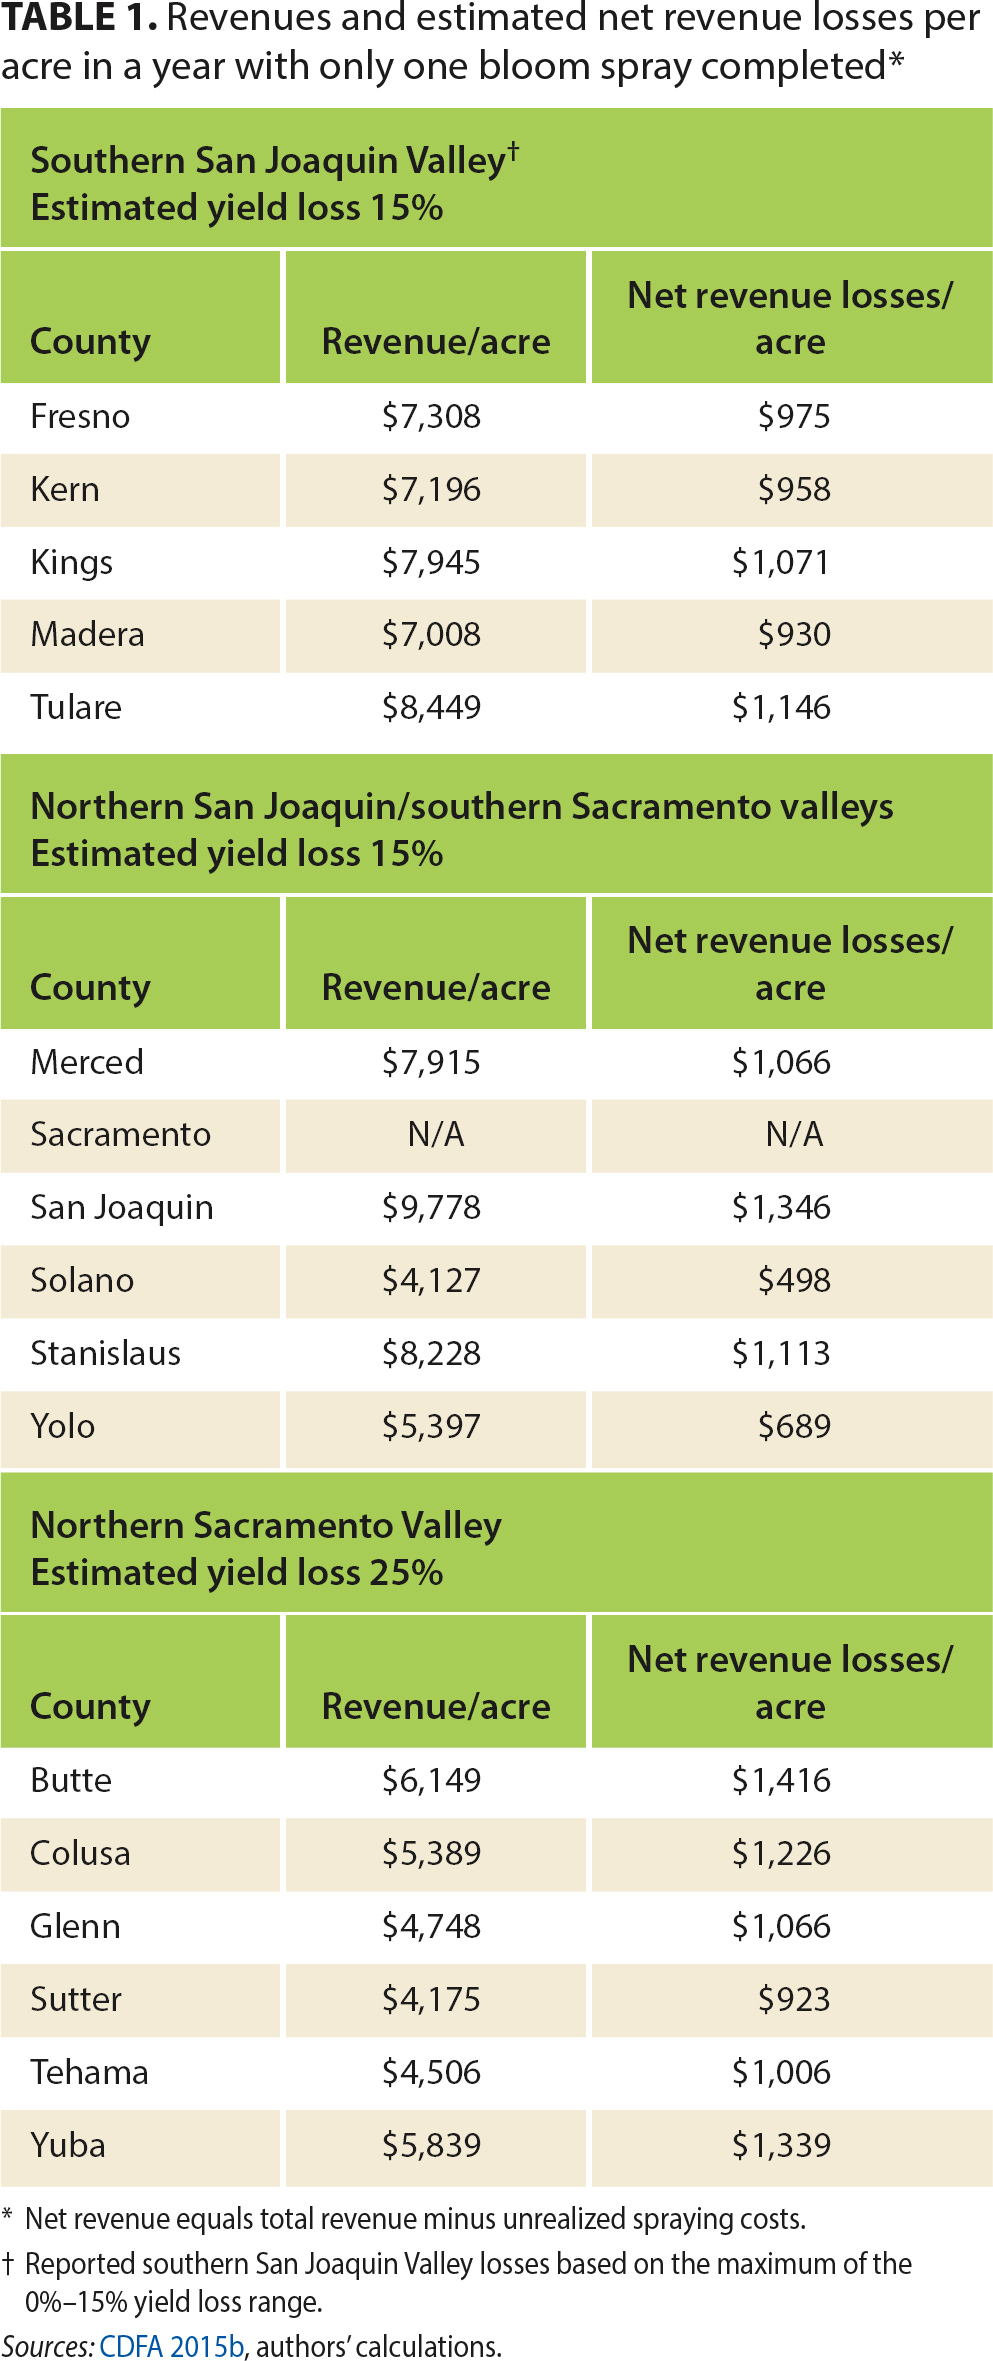
TABLE 1. Revenues and estimated net revenue losses per acre in a year with only one bloom spray completed∗
Butte County in the northern Sacramento Valley has the largest estimated net revenue loss per acre: $1,416. Although the northern Sacramento Valley had the largest percentage yield loss (25%), yields are higher in other production regions. San Joaquin County in the northern San Joaquin Valley had the second-largest estimated net revenue loss ($1,346 per acre). Comparing the revenue losses in table 2 to operating costs, 2016 UC cost studies for conventional almond production report total operating costs per acre of $3,332 for the southern San Joaquin Valley, $2,251 for the northern San Joaquin Valley and $2,267 for the Sacramento Valley (Duncan et al. 2016; Pope et al. 2016; Yaghmour et al. 2016). If only one spray was completed, per-acre losses would have ranged from 22% to over 50% of total operating costs, depending on the county. (CDFA does not report almond revenues per acre for Sacramento County.)

Buffer zone acreage
Table 2 reports the number of acres within a buffer zone for each county by soil type and in total. Acreage impacts differed across counties. Stanislaus County had almost twice as much buffer zone acreage as Merced County, which had the second-highest buffer zone acreage. Sacramento County had no acreage within a buffer zone. On a percentage basis, for the other acounties buffer zone acreage ranged from 0.45% (Kern County) to 1.89% (San Joaquin County) of total harvested acreage reported by CDFA (CDFA 2015b). Overall, buffer zone acreage was 0.97% of harvested acreage.
Losses from incomplete spray program
Before calculating annual losses averaged over a multiyear period, we calculated losses in a year when the spray program was not completed on any buffer zone acreage. Net revenue losses in a year when only one spray could be completed (table 3) were calculated by multiplying net revenue losses per acre (table 1) by total buffer zone acreage (table 2). If, in the same year, only a single spray was applied to all almond acreage in buffer zones in all nine counties, total losses in that year would be approximately $8.7 million.

Share of years when spray program incomplete
Incorporating weather data, soils data and the time delay for entering fields after a rain event revealed that in the 10 years we analyzed, the regulation would have led to losses in zero to three of those years, depending on the combination of county and soil hydrologic group. Intuitively, that number seems small. However, our objective was to identify years in which there would have been losses due to the regulation compared to no regulation, given the weather. In other words, if weather alone would have prevented a grower from entering an orchard with a specific soil hydrologic group, the resulting loss was not due to the regulation but to the weather.
That said, the more rain events there were, the more likely that the regulation would have had an effect. The El Niño year 1998 accounted for most of the instances when the regulation would have reduced the number of possible sprays. Storms were heavy and persistent. The National Agricultural Statistics Service reported a 34% reduction in yield for 1998 compared to 1997 and 1999 (USDA NASS 2004).
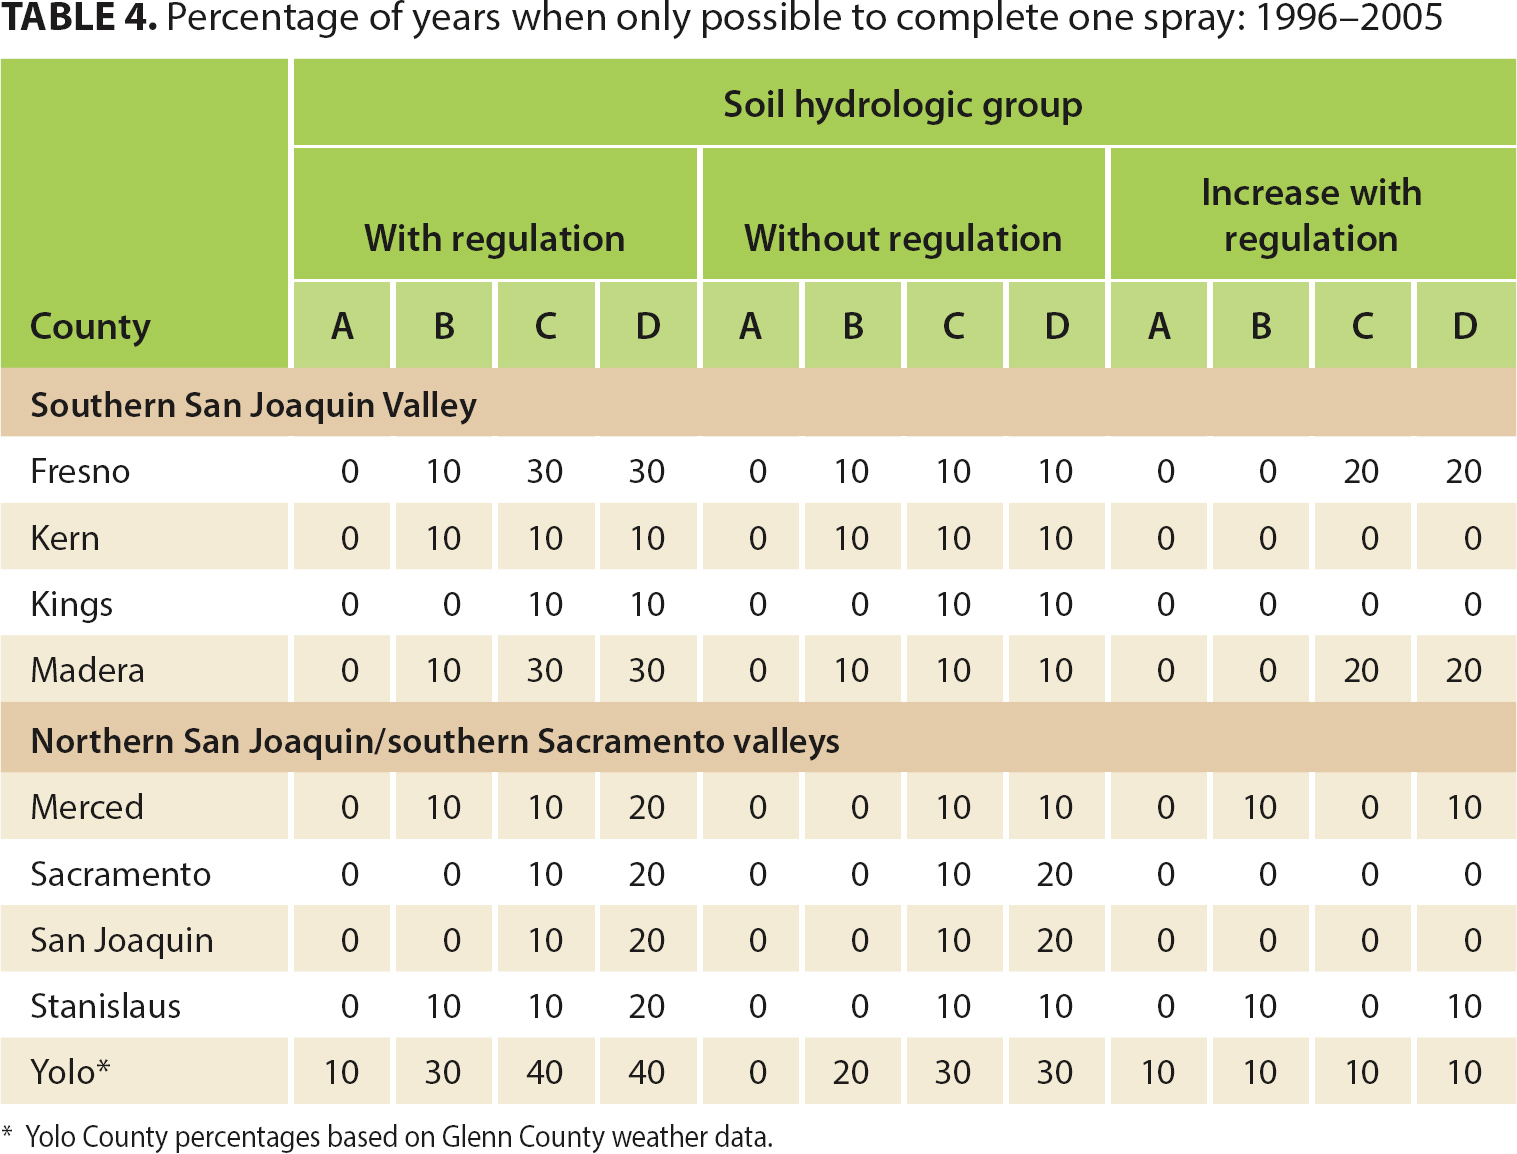
Table 4 summarizes the share of years from 1996 to 2005 when only one fungicide application could be completed for each county–soil hydrologic group combination with and without the regulation. The first set of columns reports the number of years in which only one application could be completed under the regulation for each soil type, the second set of columns reports the number of years in which only one application could be completed without the regulation being in effect, and the third reports the impact of the regulation. It only has an impact when the number of years in which only one application completed is larger under the regulation. For example, only one spray could be completed 10% of the time on soil hydrologic group B in Fresno County regardless of whether or not the regulation was in effect, so the impact of the regulation was zero. For soil hydrologic group C in Fresno County, in contrast, only one application could be completed 30% of the time if the regulation was in effect, but only one application could be completed 10% of the time without the regulation, so the impact of the regulation was an increase of 20%.
Losses averaged across years
Net revenue losses averaged over the 10-year period of this study were calculated by multiplying the total net revenue losses in a year in which only one spray could be completed (table 3) by the share of years in which only one spray could be completed (table 4). The results were the “expected” annual revenue losses (table 5). These losses did not represent the net revenue loss in any one year. Rather, the results adjusted the loss estimate to reflect how often growers were able to apply only one spray during bloom.

Total losses in the nine counties where buffer zone acreage data were available averaged across 10 years were less than $0.2 million annually. This was relatively small for a crop with total 2014 market value of $6.4 billion across eight of the nine counties (excluding Sacramento, which does not report almond revenues separately). However, it is important to keep in mind that even though industry-level losses may be small, growers with affected acreage will incur larger percentage losses, up to 30% depending on county and soil hydrologic group. Further, losses are not sustained evenly across years.
Other counties
In the other eight counties, we assumed that 2% of acreage was within the buffer zone and all of this acreage was in soil hydrologic group D. This share of acreage within the buffer zone was larger than the maximum county share for the nine counties and twice as large as the overall share of acreage for the nine counties analyzed. Assuming that all affected acreage was in soil hydrologic group D provided an upper bound for the effect of soil group on estimated losses.
Under these assumptions, estimated net revenue losses in a year in which only one spray could be applied were $4.36 million to $4.72 million, depending on how harvest costs were affected by yield. Losses averaged over 10 years were $0.54 million to $0.58 million. The conservative assumptions regarding buffer zone acreage and soil type contributed to this relatively large estimate, albeit to an unknown extent.
Methodology fine-tunes losses
Overall, projected losses from this policy were anticipated to be small relative to gross revenues for the nine almond-producing counties based on 2014 acreage data. Orchard location, soil hydrologic group and weather data were the key determinants of the losses. If only location data were available, losses would have been $8.7 million. Incorporating soil type and weather data resulted in average losses of $0.2 million annually.
There are a few caveats to keep in mind. All else being equal, the significant growth in almond acreage since 2014 would increase losses above those estimated here. Additionally, these losses were not statewide losses; almonds are produced in other counties too. Finally, these were total losses and did not look at the distribution of losses, which were borne by relatively few growers.
These findings illustrate that evaluating the economic impacts of pesticide use policies with explicit spatial and/or temporal limitations requires incorporating these dimensions into the economic analysis. In this specific case, we found that the regulation, limited by spatial and temporal criteria, was projected to have a relatively small economic effect. Importantly, GIS data on orchard location identified roughly 1% of planted acreage that was in a buffer, and weather data plus soil hydrologic group data each reduced losses by an order of magnitude. Apart from the conclusion regarding appropriate methodology, the implication of this result for policymakers is that economic losses can be reduced if regulations are designed to restrict pesticide use in the specific locations and time periods identified as having undesirable effects rather than applying to a broader set of locations and time periods.
Financial effect of limiting pesticide use near schools for almonds in nine counties depends on soils and weather

