


All Issues
Retail cannabis prices in California through legalization, regulation and taxation
Publication Information
California Agriculture 73(3):136-145. https://doi.org/10.3733/ca.2019a0025
Published online September 12, 2019
PDF | Citation | Permissions
NALT Keywords
Abstract
Traditional sources of retail price information, such as scanner data and government price surveys, are not available for cannabis. To help fill this gap, between October 2016 and July 2018 the UC Agricultural Issues Center collected online retail price ranges for dried cannabis flower and cannabis-oil cartridges at retailers around California. During this 21-month time period, the legal landscape of the California cannabis market underwent three broad regulatory changes: adult-use decriminalization, licensing and regulation and mandatory testing. This article provides unique primary data on legal cannabis prices in California before and after each of these three changes. Our data are imperfect but do provide a glimpse of the patterns of California cannabis prices at different times. For dried cannabis flower, we observe relatively stable retail prices over the 21-month period at both the top and bottom ends of the price range. For cannabis-oil cartridges, we observe relatively stable prices at the bottom end but increasing prices at the top end between November 2017 and July 2018.
Full text
Observing patterns in retail prices is fundamental for understanding the economics of any agricultural consumer product. The study of cannabis retail prices, like the study of other economic aspects of the cannabis industry, is fraught with difficulty, in part because cannabis remains a Schedule I narcotic under U.S. federal law. Consumer price indexes, tax records, commercial retail scanner data, industry association reports and other sources of data typically available for agricultural products such as wine, almonds and cut flowers are unavailable for cannabis. Cannabis retailers have limited access to banking services; most cannabis retail transactions are conducted in cash; and cannabis businesses are understandably reluctant to share their financial data. There is a need for better information about all aspects of the cannabis industry, including prices and price patterns.
In this article, we aim to contribute to the scant literature on cannabis retail prices by describing the basic patterns of price ranges at retailers in California over a 21-month time span during which the industry underwent a series of significant regulatory changes. Several times between October 2016 and July 2018, researchers at the UC Agricultural Issues Center (AIC) gathered cannabis retail prices published on Weedmaps, a leading online cannabis retail platform. We report average maximum and minimum prices for three common types of cannabis packages: one-eighth ounce of dried cannabis flower, 1 ounce of dried cannabis flower and 500-milligram cannabis-oil cartridges.
In our first 11 months of data collection (October 2016 to August 2017), we collected prices from retailers in seven representative counties around California. Next, in November 2017, we collected prices from all retailers in California that listed prices on Weedmaps, while continuing to track prices in the representative counties. After mandatory licensing began in January 2018, we collected three more rounds of prices from all retailers that listed prices on Weedmaps and that had received temporary licenses to operate legally from the Bureau of Cannabis Control, a state regulatory agency.
Despite differences in coverage among our rounds of data collection, the data seem to represent a wide swath of cannabis retail prices for retailers that posted prices openly and were part of the legal medicinal or adult-use cannabis segments during a period of unusual change for the cannabis industry.
Regulatory background
Under California law, medicinal cannabis patients have been able to legally purchase a variety of cannabis products since the Compassionate Use Act of 1996. However, state regulation of the industry was minimal for the two decades following the passage of the Act. The legislative process (starting in 2015) that finally introduced regulation and taxation to the California cannabis market is summarized in Goldstein and Sumner (2019) and covered in greater depth in Sumner et al. (2018) and UC Agricultural Issues Center (2018). Here we will review only the major regulatory changes that occurred between 2016 and 2018, when we were collecting price data.
Change 1: The Adult Use of Marijuana Act
Proposition 64, a voter initiative, decriminalized adult-use cannabis in November 2016, the month following our first round of price data collection. The proposition — the Adult Use of Marijuana Act (AUMA) — eliminated criminal penalties for possession, by adults 21 and over, of up to 1 ounce of cannabis flower and/or six cannabis plants. Changes to criminal penalties took effect almost immediately, but state regulatory agencies were given until January 1, 2018 to write regulations for licensing, safety and taxation for all legal (adult-use and medicinal) cannabis.
This left a period of about 13 months, from November 2016 to December 2017, during which California's 20-year-old medicinal cannabis industry was able to continue operating largely as it had before AUMA: permitted but unregulated on the state level, partially and inconsistently regulated at the county and/or municipal levels and mostly untaxed on any level. During this 13-month period, medicinal retailers continued selling cannabis to state residents with up-to-date recommendations from physicians. However, some medicinal cannabis businesses faced unusual local challenges in 2017 as some cities and counties that were opposed to the establishment of an adult-use cannabis industry restricted or banned all cannabis operations from their jurisdictions (UC Agricultural Issues Center 2018).
Change 2: Mandatory licensing, taxation, packaging, labeling and security regulations
On January 1, 2018, all cannabis businesses that had not applied for temporary licenses from state agencies became illegal from the point of view of the state. The Bureau of Cannabis Control, the California Department of Food and Agriculture, the California Department of Public Health and other state agencies propagated regulations that implemented most parts of a regulatory structure that merged AUMA with previous medicinal cannabis legislation (jointly codified as the Medicinal and Adult-Use Cannabis Regulation and Safety Act, or MAUCRSA [2017]).
As of January 1, 2018, licensed distributors were required to pay a 15% state excise tax on all medicinal and adult-use cannabis sold at retail, and licensed growers were expected to pay a cultivation tax of $9.25 per ounce ($148 per pound) for any cannabis that entered legal market channels in 2018. In some counties and cities, additional local taxes were imposed. All licensees were also required to follow costly new regulations governing security, age verification, handling, labeling, child-proof packaging, inventory storage and “seed-to-sale” tracking — but not yet mandatory testing, one of the costliest elements of the new regulations (Valdes-Donoso et al. 2019).
Change 3: Mandatory testing
On July 1, 2018, the Bureau of Cannabis Control began enforcing regulations for pesticide and contaminant testing. After this date, cannabis could not be sold legally in California unless it had passed a stringent battery of laboratory tests, which added about 5% to the cost of supplying cannabis to the legal retail market (Valdes-Donoso et al. 2019). Because not all retailers update their prices immediately with every change in wholesale costs, we expect that testing effects were not fully reflected in our July 2018 data. In addition, some testing requirements were not implemented until January 1, 2019 (Valdes-Donoso et al. 2019).
Medicinal vs. adult-use cannabis
A final regulatory point worth noting is that since the launch of adult-use sales in January 2018, the California cannabis retail environment has drawn little distinction between medicinal and adult-use cannabis, and we do not distinguish between the two in our reporting of retail prices. There are some differences between the medicinal and adult-use systems: Retailers need separate medicinal cannabis permits to sell medicinal cannabis; the minimum age for purchasing medicinal cannabis is 18 instead of 21; the maximum quantity that may be purchased is 8 ounces instead of 1 ounce; and purchases are exempt from sales tax if the customer has a medicinal recommendation and a county-issued medicinal ID card. However, the cannabis supply for adult-use and medicinal sales is interchangeable. Medicinal and adult-use cannabis are subject to the same testing, labeling and packaging standards. Cultivators and manufacturers have no reason to distinguish between the two product types. In general, the only substantial cost faced by a medicinal cannabis retailer who enters the adult-use market is an additional license fee.
Meanwhile, the potential market for medicinal retailers is severely limited because consumers of medicinal cannabis, if they wish their purchases to be exempt from sales tax, must obtain county identification cards for medicinal cannabis in addition to medical recommendations — at a combined cost of up to $100 per year. With adult-use cannabis now widely available, many consumers (other than 18-to-20-year-olds) who participated in the medicinal market in 2017 chose not to renew their medicinal recommendations in 2018. From an economic perspective, the 2018 California cannabis market is thus more usefully viewed as a single market than as separate adult-use and medicinal markets.
Data collection
The leading source of publicly available data on U.S. cannabis retail prices is Weedmaps, an internet platform that enables retailers in California and other states to publish and update their price lists, locations and other practical information on a standardized consumer-facing website and app. Weedmaps has operated since 2008. Researchers have used it to study the California cannabis industry since well before the autumn of 2016, when AIC researchers first gathered information from the site. For instance, Freisthler and Gruenewald (2014) used Weedmaps listings to study the industrial organization of cannabis retailers in California.
Weedmaps listings do not collectively represent the full California retail landscape. We found no reliable estimates of the percentage of California retailers listed on Weedmaps. But because retailers may add or remove listings from Weedmaps for business or marketing reasons other than opening or closing, Weedmaps provides incomplete and constantly changing coverage of California's retail cannabis market. Bierut et al. (2017), another study that uses Weedmaps data, finds that Weedmaps includes about 60% of retailers in Colorado and 40% of retailers in Washington, but does not analyze California retailers on Weedmaps. This uncertainty should be kept in mind when interpreting our data.
We began gathering price data from Weedmaps in October 2016. We recorded prices by product type and also collected information on retail sales locations and whether retailers were storefront or delivery-only operations. We collected only the minimum and maximum listed price (i.e., the price range) for three of the most common cannabis products. Many retailers listed a price schedule with just two levels for each product type: entry-level and “top-shelf” prices. Some retailers maintained three to four price levels, but during the first year of data collection, we rarely encountered more than five levels (see UC Agricultural Issues Center 2018, section 4.3). With or without intermediate prices, we had no access to information about quantities sold and could not construct quantity-weighted average prices. Moreover, cannabis strains and forms of packaging were often specific to individual retailers, and measures of specific brand or product characteristics were not consistently available on Weedmaps.
Considering that not all retailers list prices on Weedmaps, and that some retailers who at some point listed prices on Weedmaps might have removed their listings while continuing to conduct business, we supplemented our data set with prices from Leafly, a competing cannabis portal whose functionality and business model are similar to those of Weedmaps. In particular, we turned to Leafly when Weedmaps price information was not available for retailers whose prices we were already tracking — or, in later rounds of data collection, from retailers that had obtained licenses from the Bureau of Cannabis Control to operate in the regulated 2018 environment. Coverage provided by Weedmaps and Leafly is partly overlapping: Some retailers list prices on both portals whereas others list prices only with one service or the other (or neither). To test for bias that might result from the inclusion of Leafly prices as part of our data set, we compared Weedmaps and Leafly average minimum and average maximum prices in a subsample of non-overlapping retailers, controlling for package size, and we found no statistically significant differences between Weedmaps and Leafly average minimum and average maximum prices.
Product types
We collected up to six prices from each retailer, representing minimum and maximum prices for the following three product types:
-
One-eighth ounce of dried cannabis flower (the most common of all product types, known informally as “an eighth”), typically packaged in a plastic bag or glass jar
-
One ounce of dried cannabis flower, typically packaged in a plastic bag
-
500 milligrams of cannabis oil, packaged either as a disposable cartridge to be used with a reusable portable electric cannabis vaporizer (“vape pen”) or as a self-contained disposable vape pen
All retailers listed prices for one-eighth ounce of packaged flower. (The number of “retailers” is equivalent to the sample size for the average minimum and maximum prices we report for one-eighth ounce of packaged flower.) Not all retailers listed prices for 1 ounce of packaged flower or 500-milligram oil cartridges. In later rounds of data collection, the share of retailers listing prices for 1 ounce of flower was smaller and the share of retailers listing prices for 500 milligrams of oil was larger. For instance, in October 2016, 90% of the 542 retailers listed prices for 1 ounce of flower and 57% listed prices for 500 milligrams of oil. In August 2017, 91% of retailers still listed prices for 1 ounce of flower and 82% listed prices for 500 milligrams of oil. By July 2018, only 49% listed prices for 1 ounce of flower and 89% listed prices for 500 milligrams of oil.
The decrease in prevalence of 1-ounce packages might be associated with the introduction of regulations in January 2018 requiring that all cannabis be pre-packaged and pre-labeled, such that after January 2018, retailers might incur extra inventory risk by prepackaging cannabis in 1-ounce packages. The increase in prevalence of 500-milligram oil packages, on the other hand, might be best explained by the opening and expansion of the adult-use market. Vape pens, which are comparatively easy to use and do not require additional paraphernalia or prior experience with cannabis (for example, rolling a joint or packing cannabis into a pipe), may have greater appeal to “cannabis novices” than dried flower. In the interest of space, we do not list individual sample sizes for each price average in each round of data collection.
Data collection: October 2016 to August 2017
During the first two weeks of October 2016, we collected prices, retailer locations and other information from each of 542 cannabis retailers on Weedmaps in seven counties around California. We chose these counties to serve collectively as a reasonable approximation of the statewide market. We call this initial group of 542 retailers the “seven-county sample.” The seven counties cover a wide range of geographic and economic conditions in California. According to the U.S. Census Bureau (USCB 2019), their basic demographics as of 2016 were in the aggregate similar to the demographics of California as a whole. The seven counties are shown in table 1.
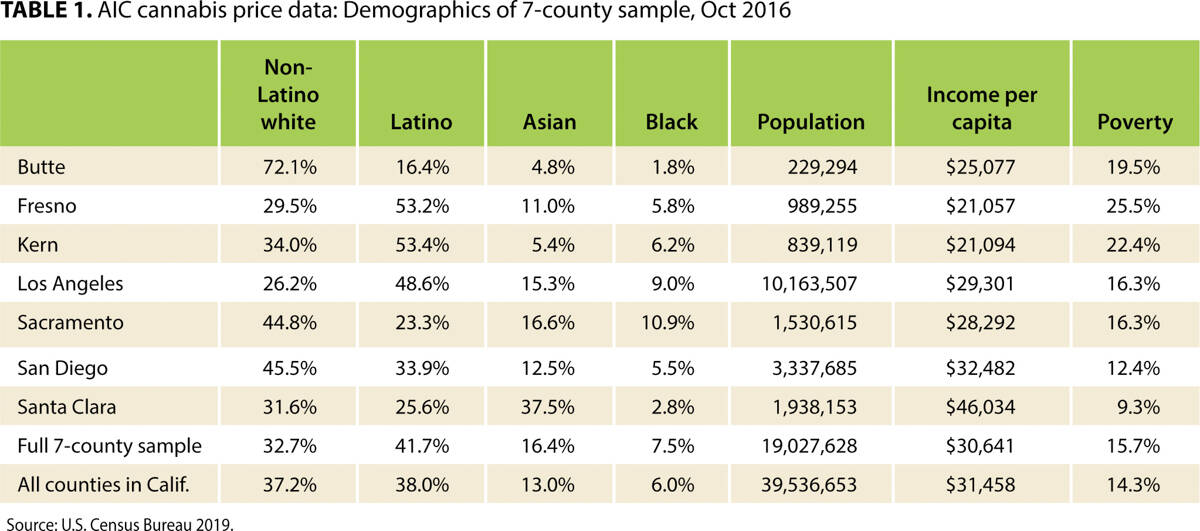
Summary statistics provided in table 1 support the notion that the demographic and economic characteristics of the sample are similar to those of California as a whole. Within the sample, the collective population is 42% Latino, 33% non-Latino white, 16% Asian and 8% black (compared to 38%, 37%, 13% and 6% for all of California) and the per capita income is about $30,600 (compared to $31,500 for all of California). Collectively, as of 2016, the seven counties included approximately half of the state's population.
In January 2017, March 2017 and August 2017, we collected three new rounds of prices from the seven-county sample. In each of these three rounds, we collected prices from all of the retailers in the original October 2016 group that still listed price data on Weedmaps or Leafly. In order to continue tracking as many of the original 542 retailers as possible, we attempted to follow businesses that moved to new locations or that temporarily closed and then re-opened. We coded retailers by county, city and phone number. When a retailer's listing disappeared, we searched for other listings under the same name or phone number. When we found the same retailer or a branch of the same retail chain elsewhere in the same county, we kept the retailer in the data set. If a retailer disappeared and then reappeared (within the county) in a later round of data collection, we kept it in the data set. If a retailer removed its online price list, or moved its only location(s) outside the original seven counties, we removed it from the data set for that data collection round (but kept it in the data set for any rounds during which the retailer was active).
Between January 2017 and August 2017, we observed significant attrition from the initial group of 542 retailers in the October 2016 seven-county sample. By August 2017, 389 (72%) of the original 542 retailers remained in the data set. As shown in tables 2 and 3, average prices for these retailers changed little during this 11-month period. We call this “attrition” because the data collection method was consistent over this time period. In our 2018 rounds of data collection, we impose the additional condition that retailers must be licensed, thus changing the data collection method (see table 2). Thus, for 2018 data collection rounds, the percentage of retailers dropping out of the data set from the original October 2016 sample of 542 retailers should not be thought of as “attrition.”

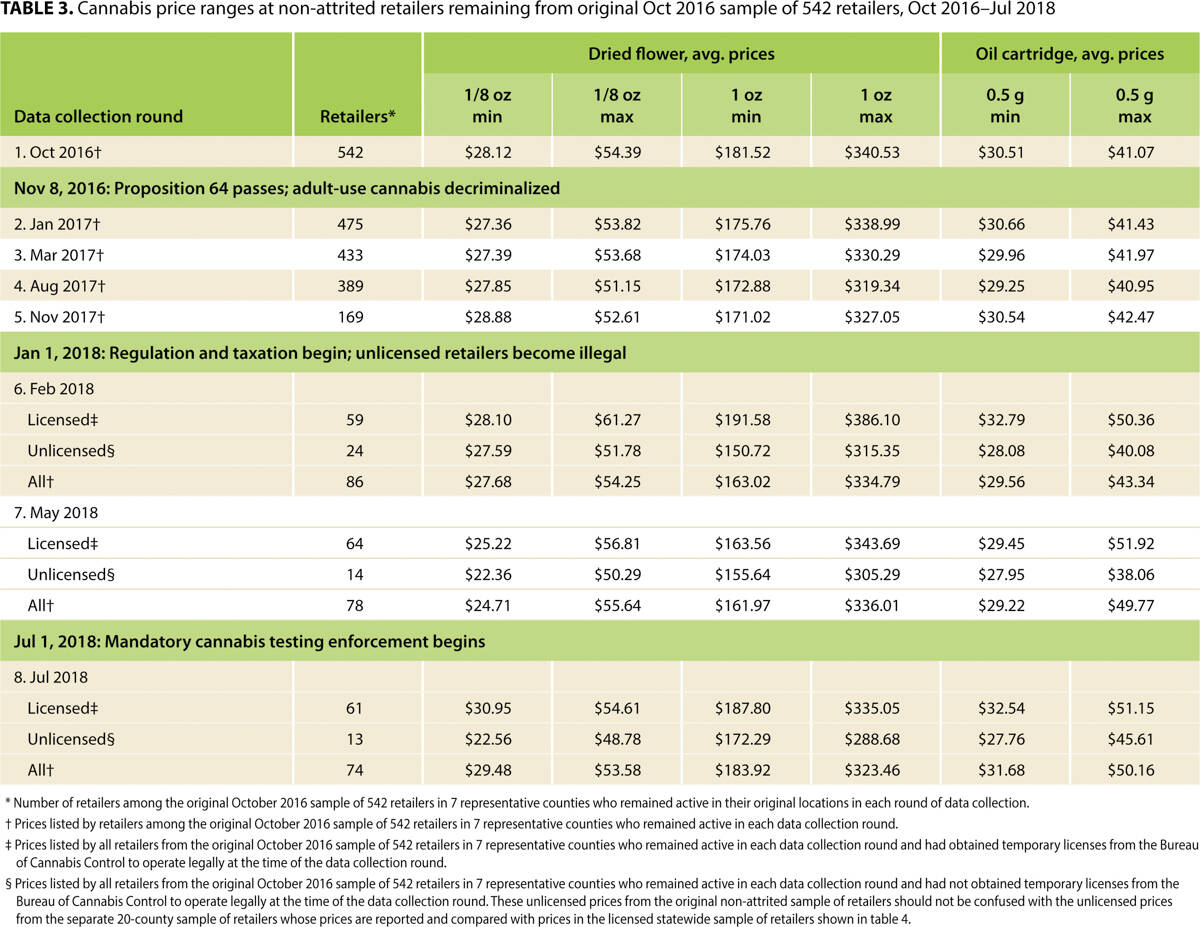
TABLE 3. Cannabis price ranges at non-attrited retailers remaining from original Oct 2016 sample of 542 retailers, Oct 2016–Jul 2018
Some retailers may have removed their online price lists from both Weedmaps and Leafly but continued to operate. Attrition from the initial 542 retailers thus should not be interpreted solely as a measure of how many cannabis retailers left the legal cannabis segment.
Data collection: November 2017
In November 2017, while continuing to track the original group of retailers that had been listing prices on Weedmaps since October 2016, we also collected data from all other retailers listing prices on Weedmaps in all counties of California. These included the 169 retailers that by that time remained from the original panel; 700 additional retailers that had newly listed retail prices in the seven original counties after October 2016 (for a total of 869 retailers in the seven original counties); and 1,652 retailers in other counties, for a total of 2,521 retailers across California.
Data collection: February to July 2018
In January 2018, mandatory licensing laws went into effect, thus rendering illegal under state law any cannabis retailer without a temporary license from the Bureau of Cannabis Control. (We call cannabis sold at licensed retailers “legally marketed” cannabis.) We verified licensing status by cross-referencing all Weedmaps and Leafly listings in California with the publicly available lists of temporary licenses granted by the Bureau of Cannabis Control. If both a Weedmaps and a Leafly listing were found, we used the Weedmaps data and dropped the Leafly data.
In computing averages for our last three data collection rounds (February, May and July of 2018), we calculated “legally marketed” minimum and maximum price averages at California cannabis retailers that listed prices on Weedmaps and that had obtained temporary licenses to sell cannabis in compliance with state regulations at the time of each data collection round. For comparative purposes, we also collected a sample of about 90 unlicensed retailers in 20 counties from Weedmaps or Leafly, distributed similarly to the licensed retailers. We chose these retailers from within a set of 20 representative counties, approximately in proportion to the relative populations of those counties. We selected retailers for this “20-county unlicensed sample” arbitrarily (and blindly with respect to their prices) from the first page of search results on Weedmaps for retailers in each of the 20 counties, but we did not use mathematical randomization to select the counties or the listings we chose within counties.
Limitations of price data
These data may not be fully representative of legal cannabis price ranges for several reasons. First, as discussed above, not all legal retailers use Weedmaps or Leafly, and prices may not be representative of all prices.
The price data we collected also may not fully represent the range of products in the market, which may have varied in different rounds of data collection. As is suggested by the changing prevalence of 1-ounce flower packages and 500-milligram oil cartridge packages, product assortments may have changed within each of these categories. This problem plagues price data in many different industries, but changes in product assortments and price listings may have been especially rapid in the emerging cannabis market.
The differences in price ranges we report here should not be interpreted as measures of price dispersion, because we are not observing maximum and minimum prices for exactly the same products at different retailers and thus are not comparing “apples to apples,” as is traditionally required to measure price dispersion. However, concrete differences in product attributes — such as potency (as commonly measured by tetrahydrocannabinol, or THC, content) or grow type (indoor, outdoor or greenhouse) for minimum-priced or maximum-priced cannabis — may also vary between retailers, and may correlate with price differences (Orens et al. 2015; Sifaneck et al. 2007), even if price differences between agricultural products do not necessarily correlate with sensory characteristics (Goldstein et al. 2008). For instance, the minimum price for one-eighth ounce of flower at a particular retailer might represent a price for outdoor-grown cannabis with a THC concentration of 15%, whereas the minimum price for one-eighth ounce of flower at another retailer might represent a price for indoor-grown cannabis with a THC concentration of 20%.
By analogy, if one were to collect minimum and maximum prices for all wine at retailers around California, the minimum-maximum range could not be used to measure price dispersion in a traditional sense; in order to measure dispersion, one would have to compare, for instance, the price of the same Kendall-Jackson Chardonnay at different stores. For our research, comparing prices for identical products across retailers would not have been feasible, given the Weedmaps format and our data collection methods. Our approach here, in reporting cannabis price ranges, is to make no assumptions about quality and assume that minimum and maximum prices are simply prices for different types of products.
It would be interesting, in future work, to explore dispersion by collecting and comparing data on standard product types across retailers. Beyond requiring product standardization, an analysis of cannabis price dispersion with respect to geographic areas would also likely require a larger data set than ours. Hollenbeck and Uetake (2018) comment that regulatory barriers to entry can facilitate the exercise of monopolistic behavior by retailers. Dispersion measures, as proxies for competition, might help illuminate regulatory impacts. As more tax and sales data are released by government agencies, it might soon become possible for researchers to collect data sets of sufficient size and precision for dispersion to be measured.
Results
Table 2 shows average minimum and maximum prices over the course of the 21-month data collection period for the three product types that we studied, along with the number of observations in each period.
In the last four rounds of data collection (November 2017 to July 2018), we generally observe only relatively slight differences in both average prices and upward or downward movements among the three retailer groups (retailers from the original sample, all retailers in the seven counties and all retailers in California). Both statewide and within the seven-county sample, average minimum and maximum prices for one-eighth ounce of flower and for 1 ounce of flower differed by 2.5% or less, but averages differed by up to 8.8% for 500-milligram cartridges.
In table 3, we report prices over the 21-month period for the non-attrited sample of the original retail store locations whose prices we collected in October 2016. These retailers may not be representative of overall state averages, particularly after the substantial attrition from the original group of retailers that we observed beginning in November 2017. However, this set of observations avoids potentially confounding factors introduced by the changing sample composition over time.
Table 3 shows substantial attrition from the original seven-county sample of 542 retailers that listed prices on Weedmaps in October 2016. By July 2018, 21 months after the first round of price collection, only 74 non-attrited retailers (14%) from the original sample remained active on Weedmaps or Leafly. Local police crackdowns and municipal bans in some counties surely contributed to this 86% attrition rate, which should not be interpreted as representative of statewide attrition from Weedmaps or evidence of the general rate of business closures. What is more interesting, perhaps, is the basic observation that only 270 licensed cannabis retailers were listed on Weedmaps in all of California in July 2018, whereas in November 2017, near the end of the unregulated market, about 2,500 California cannabis businesses operated without the need for a license. This observation suggests, at least, that many medicinal cannabis retailers that had been operating legally in 2017 had not yet obtained licenses and entered the new legal market as of mid-2018.
Figures 1, 2 and 3 show average minimum and maximum prices for one-eighth ounce of flower, 1 ounce of flower and 500-milligram oil cartridges for each round of data collection, both for legally marketed cannabis and (in 2018) for the 20-county unlicensed sample.
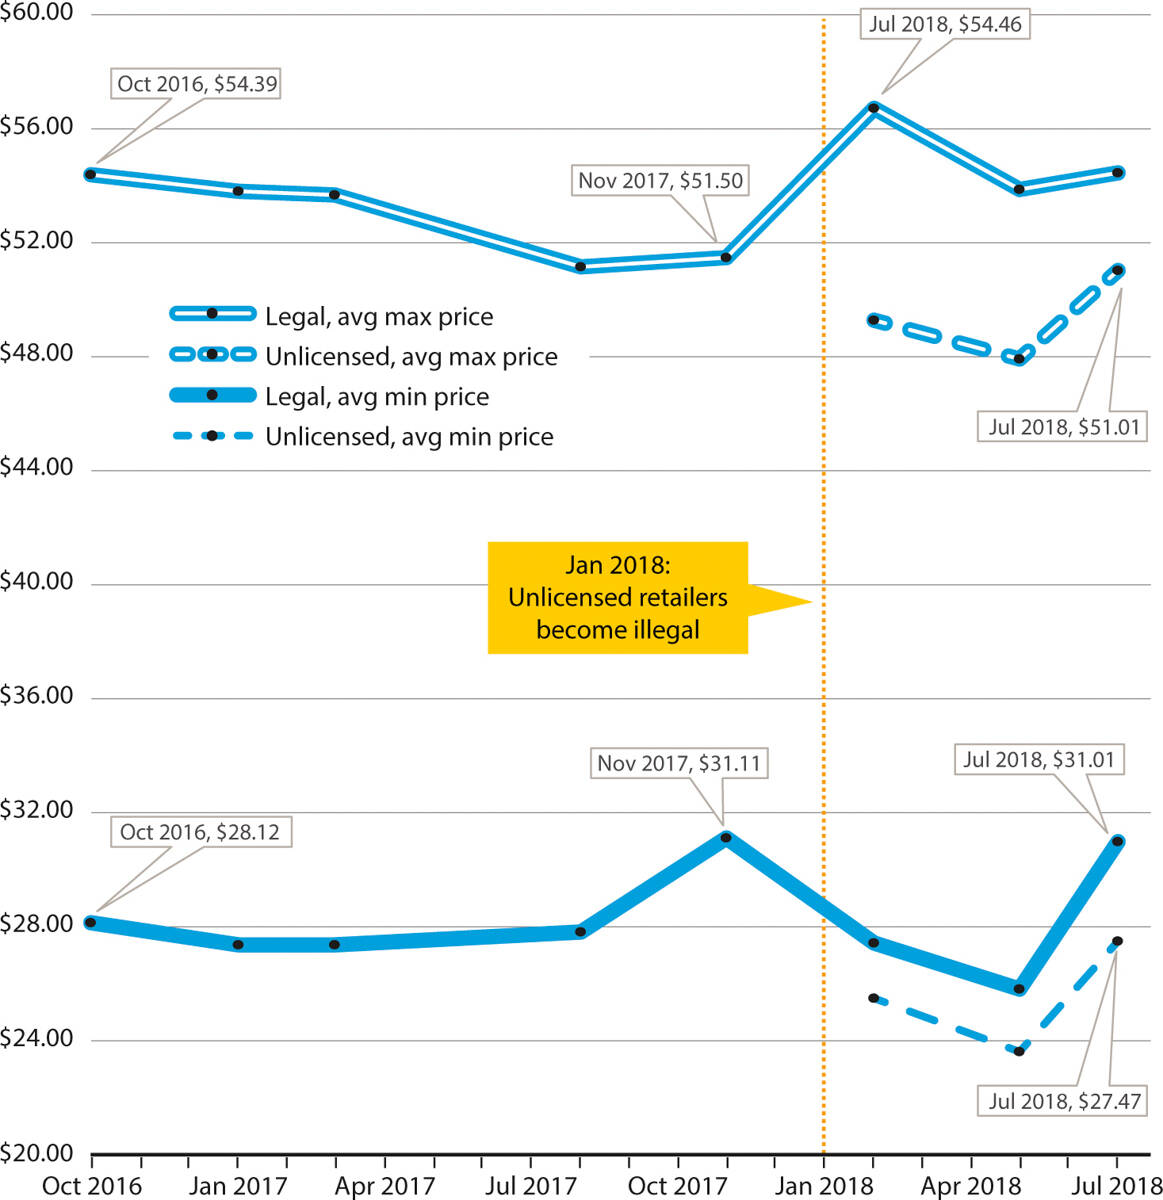
FIG. 1. Retail price ranges for 1/8 oz cannabis flower: Average minimum and maximum retail prices listed on WeedMaps for California, Oct 2016–Jul 2018. October 2016 to August 2017 averages are for retailers remaining from the original October 2016 sample of 542 retailers in seven counties (Butte, Fresno, Kern, Los Angeles, Sacramento, San Diego and Santa Clara), with 28% attrition by August 2017. November 2017 averages are for all counties in California. January through July 2018 “legally marketed” averages are for all counties in California, but include only retailers that obtained temporary licenses to operate legally from the Bureau of Cannabis Control. January through July 2018 “unlicensed” averages are for a representative sample of unlicensed retailers in 20 counties around California (Alameda, Contra Costa, Los Angeles, Marin, Mendocino, Orange, Riverside, Sacramento, Santa Clara, San Bernardino, San Diego, San Francisco, San Luis Obispo, Santa Cruz, Shasta, Solano, Sonoma, Stanislaus, Tulare and Yolo). The 20-county unlicensed sample was collected by arbitrarily selecting several retailers that came up in the first page of Weedmaps search results from each of these counties, in approximate proportion to their relative populations.
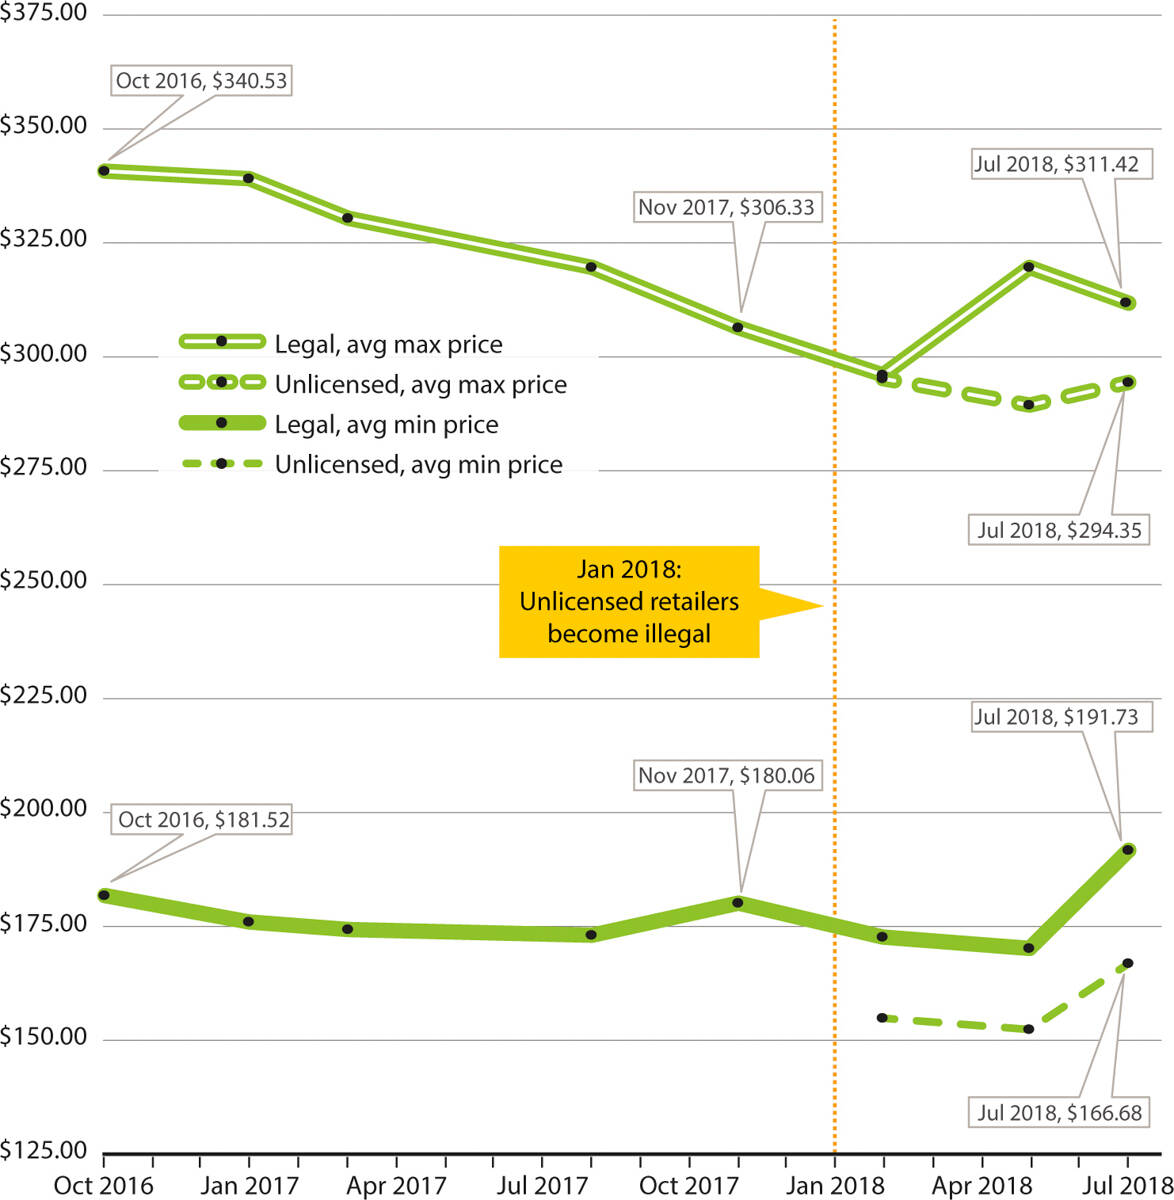
FIG. 2. Retail price ranges for 1 oz cannabis flower: Average minimum and maximum retail prices listed on WeedMaps for California, Oct 2016–Jul 2018. October 2016 to August 2017 averages are for retailers remaining from the original October 2016 sample of 542 retailers in seven counties (Butte, Fresno, Kern, Los Angeles, Sacramento, San Diego and Santa Clara), with 28% attrition by August 2017. November 2017 averages are for all counties in California. January through July 2018 “legally marketed” averages are for all counties in California, but include only retailers that obtained temporary licenses to operate legally from the Bureau of Cannabis Control. January through July 2018 “unlicensed” averages are for a representative sample of unlicensed retailers in 20 counties around California (Alameda, Contra Costa, Los Angeles, Marin, Mendocino, Orange, Riverside, Sacramento, Santa Clara, San Bernardino, San Diego, San Francisco, San Luis Obispo, Santa Cruz, Shasta, Solano, Sonoma, Stanislaus, Tulare and Yolo). The 20-county unlicensed sample was collected by arbitrarily selecting several retailers that came up in the first page of Weedmaps search results from each of these counties, in approximate proportion to their relative populations.

FIG. 3. Retail price ranges for 500-mg cannabis oil cartridge: Average minimum and maximum retail prices listed on WeedMaps for California, October 2016–July 2018. October 2016 to August 2017 averages are for retailers remaining from the original October 2016 sample of 542 retailers in seven counties (Butte, Fresno, Kern, Los Angeles, Sacramento, San Diego and Santa Clara), with 28% attrition by August 2017. November 2017 averages are for all counties in California. January through July 2018 “legally marketed” averages are for all counties in California, but include only retailers that obtained temporary licenses to operate legally from the Bureau of Cannabis Control. January through July 2018 “unlicensed” averages are for a representative sample of unlicensed retailers in 20 counties around California (Alameda, Contra Costa, Los Angeles, Marin, Mendocino, Orange, Riverside, Sacramento, Santa Clara, San Bernardino, San Diego, San Francisco, San Luis Obispo, Santa Cruz, Shasta, Solano, Sonoma, Stanislaus, Tulare and Yolo). The 20-county unlicensed sample was collected by arbitrarily selecting several retailers that came up in the first page of Weedmaps search results from each of these counties, in approximate proportion to their relative populations.
In the 2016 and 2017 price data, before mandatory licensing, regulation and taxation, we observe relative stability in California cannabis price ranges for all three product types. In 2018, after licensing, regulation and taxation, we observe three patterns. First, we observe falling prices for all products between February and May 2018, which may be related to retailers' need to liquidate untested inventory that would become illegal as of July 2018. Second, we observe generally rising prices between May and July 2018, which may be related to the introduction of mandatory testing rules. However, because of the limitations and uncertain representativeness of the Weedmaps sample, as well as changes to our sampling methods in different rounds, we do not have a basis for inferring a causal relationship between testing rules or other regulatory events and our minimum and maximum price averages.
Third, we observe rising maximum prices for 500-milligram oil cartridges over our last four data collection rounds. At all retailers statewide that listed prices on Weedmaps or Leafly, we observed a 33% increase in maximum prices from November 2017 to July 2018. Table 2 shows that the latter pattern (rising maximum prices for cartridges) can be observed, with some variation, in prices both in the original seven counties and in all of California.
We do not know to what extent the maximum price increases for cartridges might be attributed to the introduction of new, higher-end products with differentiated sensory or functional attributes as the market has evolved; to differentiated packaging attributes; to price increases generated by increased high-end demand; to supply-side factors; or to other market effects.
In general, the price patterns we observe demonstrate little evidence of seasonality, even though wholesale cannabis prices are known to vary seasonally because of the annual outdoor harvest and consequent increase in outdoor cannabis supply in the fall and winter months (UC Agricultural Issues Center 2018).
This relative lack of seasonal price variation could be the result of good inventory control by retailers, or of the fact that a significant portion of legal cannabis is indoor-grown or greenhouse-grown and is thus less subject to seasonal price variation than illegal cannabis. Wholesale cannabis prices are beyond the scope of this article; see UC Agricultural Issues Center (2018) for a discussion of wholesale price patterns over this time period.
Prices at licensed and unlicensed retailers
In table 4, we report results from a comparison between licensed retailers and unlicensed retailers from the three data collection rounds during the post-regulation phase in 2018.
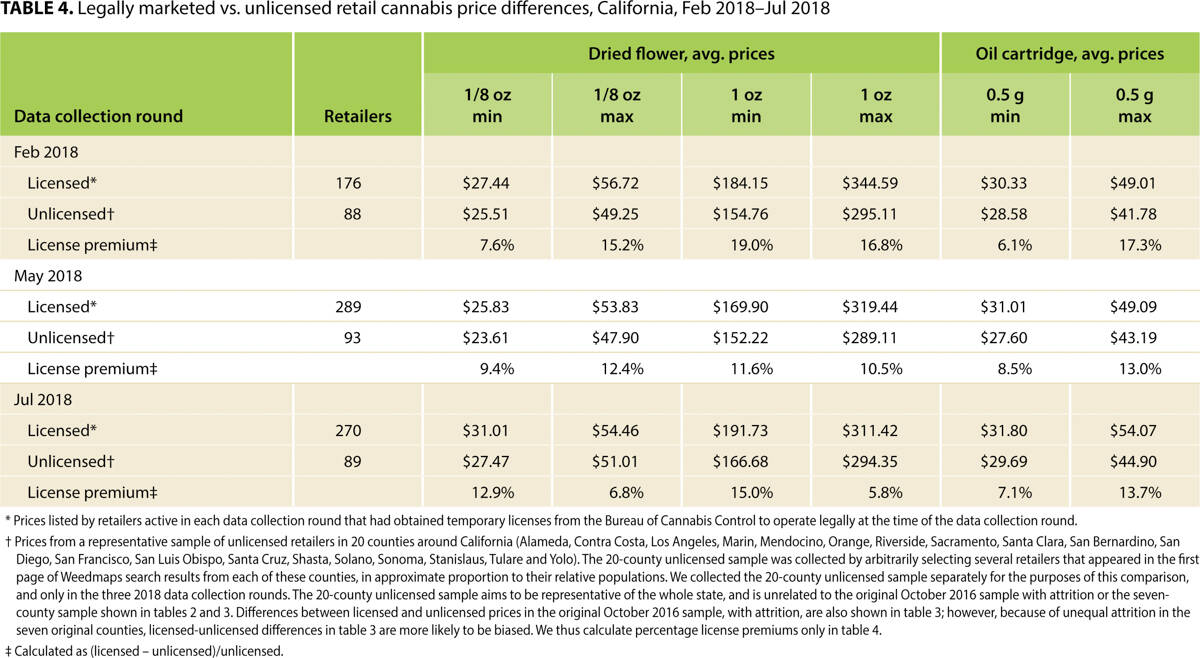
TABLE 4. Legally marketed vs. unlicensed retail cannabis price differences, California, Feb 2018–Jul 2018
We were not surprised to find that prices at unlicensed retailers, which presumably do not bear all the costs of regulation and perhaps taxation, are generally lower than prices at licensed retailers.
Storefront prices and delivery-only prices
In table 5, for data collection rounds 1 to 4, we report the percentage difference in delivery-only prices compared with storefront prices.
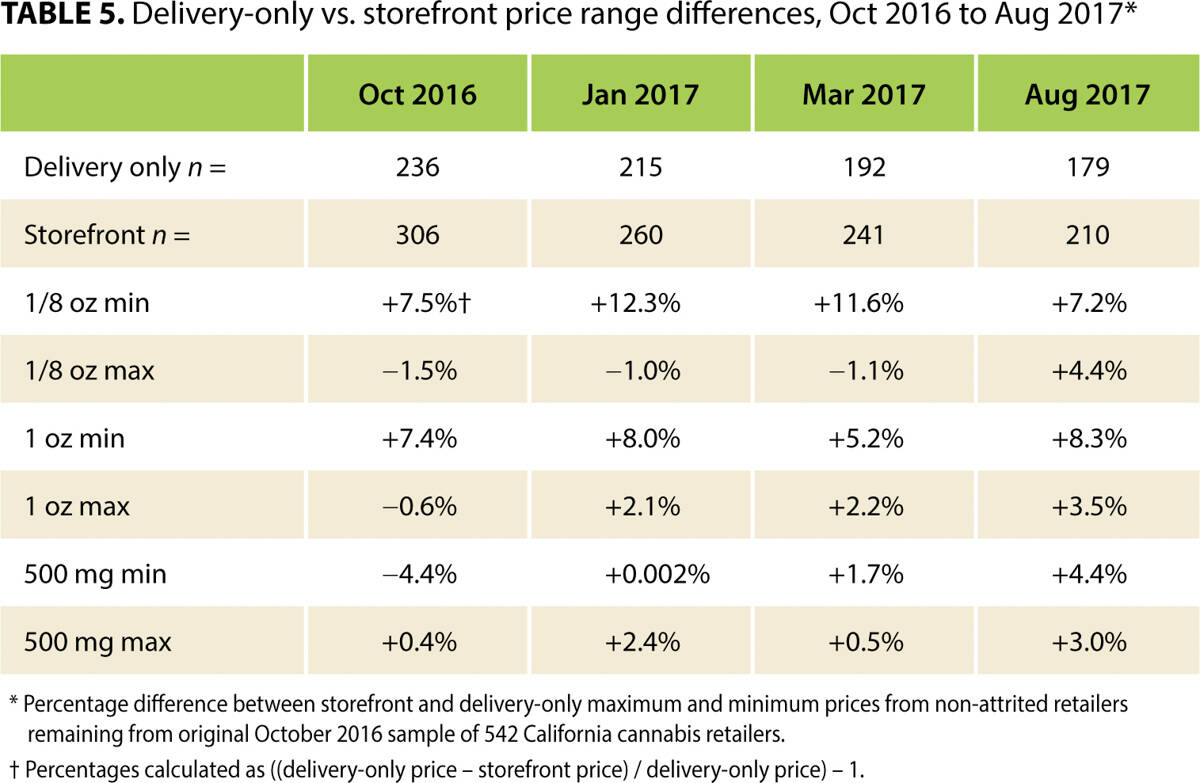
From the results reported in table 5, we observe that delivery-only services, compared with storefronts, charge higher prices for cannabis. Price differences are most pronounced for low-end products, perhaps reflecting the higher operating costs per transaction of delivery-only services. We do not carry this analysis through to the regulated 2018 market because not enough delivery-only services had been licensed to make meaningful observations of average prices.
Discussion
We collected eight rounds of price data from the legal California retail cannabis market during a 21-month period of regulatory transition, as cannabis was being decriminalized, legalized and regulated in stages. Given the differences between the data sets we collected and the unknowns about Weedmaps that we have discussed above, readers should be especially cautious in interpreting the movements we observe as “trends.” We instead describe them as “patterns.” In general, one surprising result from our price data sets over time may be the relative lack of overall price movements in California cannabis prices, with the exception of rising maximum prices for cannabis oil cartridges in 2018.
The data we report in this paper provides one source of unique information on the retail prices of cannabis flower and oil during the state's period of transition to a regulated market environment. We hope that our data may useful to economists and other researchers who need to make basic assumptions about characteristics of the cannabis market. We did not collect price data for numerous products now available on the legal cannabis market in California, including edibles, waxes and topicals. The market has also changed in important ways since mid-2018. Many other basic reports on price data beyond ours are still needed to understand the economics of California's rapidly changing cannabis market.
Retail cannabis prices in California through legalization, regulation and taxation

