


All Issues
Watering the Emerald Triangle: Irrigation sources used by cannabis cultivators in Northern California
Publication Information
California Agriculture 73(3):146-153. https://doi.org/10.3733/ca.2019a0011
Published online September 12, 2019
PDF | Citation | Permissions
NALT Keywords
Abstract
Water use by cannabis cultivators represents an emerging threat to surface flows in Northern California's sensitive watersheds. To date, however, no data has been available to formally assess where cannabis sites source their water. This study analyzed data from annual reports, covering the year 2017, submitted by 901 cannabis cultivators enrolled in the Cannabis Waste Discharge Regulatory Program administered by the North Coast Regional Water Quality Control Board. The analysis identified cannabis cultivators' most common sources for water extraction, monthly patterns for each water source and differences between sites compliant and not compliant with the cannabis program. The most commonly reported source of water was wells (58% of sites), with most extraction from wells occurring during the growing season (April through October). Surface water diversions (22% of sites) and spring diversions (16% of sites) were the most common sources after wells, with extractions from these sources distributed much more evenly across the year. Although nearly one-third of noncompliant sites (33%) used wells, this source was more than twice as frequently reported among compliant sites (68%), indicating that wells may become increasingly common as more sites become part of the regulated cannabis industry.
Full text
Assessing the environmental impacts of the cannabis industry in Northern California has been notoriously difficult (Carah et al. 2015; Short Gianotti et al. 2017). The federally illegal status of cannabis has prevented researchers from obtaining funding and authorization to study cultivation practices (Arnold 2013; Kilmer et al. 2010). Fear of federal enforcement has also driven the industry into one of the most sparsely populated and rugged regions of the state (Bauer et al. 2015; Butsic and Brenner 2016; Corva 2014; Leeper 1990; Thompson et al. 2014), further limiting opportunities for research. The result has been a shortage of data on cultivation practices and their environmental risks (Short Gianotti et al. 2017).

At this cannabis farm in Trinity County, photographed during the early growing season, infrastructure for mixed-light cultivation is visible in the background. Full-sun outdoor cultivation, with associated drip irrigation, is visible in the foreground.
An improved understanding of cannabis cultivators' water use practices is a particularly pressing need. Given the propensity of cannabis growers to establish farms in small, upper watersheds, where streams that support salmonids and other sensitive species are vulnerable to dewatering (Bauer et al. 2015), significant concerns have been raised over the potential impacts of diverting surface water for cannabis cultivation. The environmental impacts of stream diversions are likely to be greatest during the dry summer months (Deitch et al. 2008, 2016), which coincide with the peak of the growing season for cannabis. Further, because cannabis cultivation operations often exhibit spatial clustering (Butsic et al. 2017), some areas with higher densities of cultivation sites may contain multiple, small diversions that collectively exert significant effects on streams (Grantham et al. 2010; Merenlender et al. 2008).
An important assumption underlying these concerns, however, is that cultivators rely primarily on surface water diversions for irrigation during the growing season. Assessments of water use impacts on the environment may be inaccurate if cultivators in fact use water from other sources. For instance, withdrawals from wells may affect surface flows immediately, after a lag or not at all, depending on the well's location and its degree of hydrologic connectivity with surface water sources (Konikow and Leake 2014). Documenting the degree to which cannabis cultivators extract their water from aboveground and belowground sources is therefore a high priority.

Wellhead at a permitted cannabis cultivation site.
In 2015, the North Coast Regional Water Quality Control Board (hereafter, “water quality control board”), one of nine regional boards of the State Water Resources Control Board, developed a Cannabis Waste Discharge Regulatory Program (hereafter, “cannabis program”) to address cannabis cultivation's impacts on water, including streamflow depletion and water quality degradation. A key feature of the cannabis program is an annual reporting system that requires enrollees to report the water source(s) they use and the amount of water they use each month of the year. Enrollees are further required to document their compliance status with several standard conditions of operation established by the cannabis program. These include a Water Storage and Use Condition, which requires cultivators to develop off-stream storage facilities (if necessary) to minimize surface water diversions during low flow periods, among other water conservation measures. Reports that demonstrate noncompliance with the Water Storage and Use Standard Condition indicate that enrollees have not yet implemented operational changes necessary for achieving regulatory compliance. In this research, we analyzed data gathered from annual reports covering 2017 to gain a greater understanding of how water is extracted from the environment for cannabis cultivation. We addressed three main questions:
-
From what sources do cannabis cultivators most commonly report extracting water for cannabis cultivation in the North Coast region — and do patterns of extraction differ across the region?
-
How does reliance on each water source differ from one month to another?
-
Do sites that report compliance with the Water Storage and Use Standard Condition, and sites that report noncompliance, rely on different water sources?
The data used to answer these questions was self-reported. Individuals providing data were not required to use standardized, controlled collection procedures or calibrated instrumentation. Authors of this research took steps to increase the dataset's integrity, but the data should be used and interpreted with a recognition that uncertainty and various potential biases are involved.
Data collection
The data used in this study was collected from cannabis sites enrolled for regulatory coverage under the cannabis program. The program was adopted in August 2015, with the majority of enrollees entering the program in late 2016 and early 2017. The data presented in this article was collected from annual reports submitted in 2018 (n = 1,702), which reflected site conditions during the 2017 cultivation year. The data therefore represents, for the majority of enrollees in the cannabis program, the first full season of cultivation regulated by the water quality control board. Because the data was self-reported, we screened reports for quality and restricted the dataset to reports prepared by professional consultants. Most such reports were prepared by approved third-party programs that partnered with the board to provide efficient administration of, and verification of conformity with, the cannabis program. Additional criteria for excluding reports included claims of applying water from storage without any corresponding input to storage, substantial water input from rain during dry summer months and failure to list a proper water source. Reports containing outliers of monthly water extraction amounts were also identified and excluded due to the likelihood of erroneous reporting or the difficulty of estimating water use at very large operations. Extreme outliers were defined as those values outside 1.5 times the bounds of the interquartile range (25th percentile through 75th percentile range of all values). Farms were not required to use water meters, and those without meters often estimated usage based on how frequently they filled and emptied small, temporary storage tanks (250 to 2,500 gallons) otherwise used for gravity feed systems or nutrient mixing. The final dataset included 901 reports.
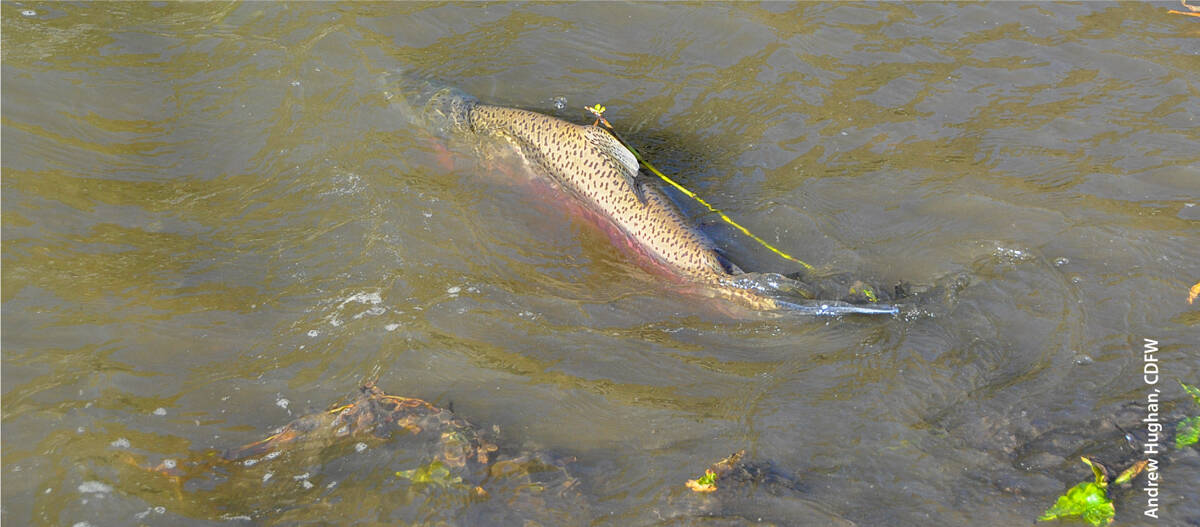
Cannabis growers often establish farms in small, upper watersheds, where streams that support sensitive species such as coho, pictured, are vulnerable to dewatering.
Parcels of land where cannabis was cultivated — including multiple contiguous parcels under single ownership — constituted a site, and this is the scale on which reporting was conducted. The spatial extent of the cannabis program included all of California's North Coast region (fig. 1); however, only a subset of the counties in this region allow cannabis cultivation and therefore reports were only received from the following counties: Humboldt (n = 465), Trinity (n = 269), Mendocino (n = 156) and Sonoma (n = 11). Because Sonoma County contributed relatively little data, we combined Sonoma County's enrollments with those from Mendocino County when making county-level comparisons.
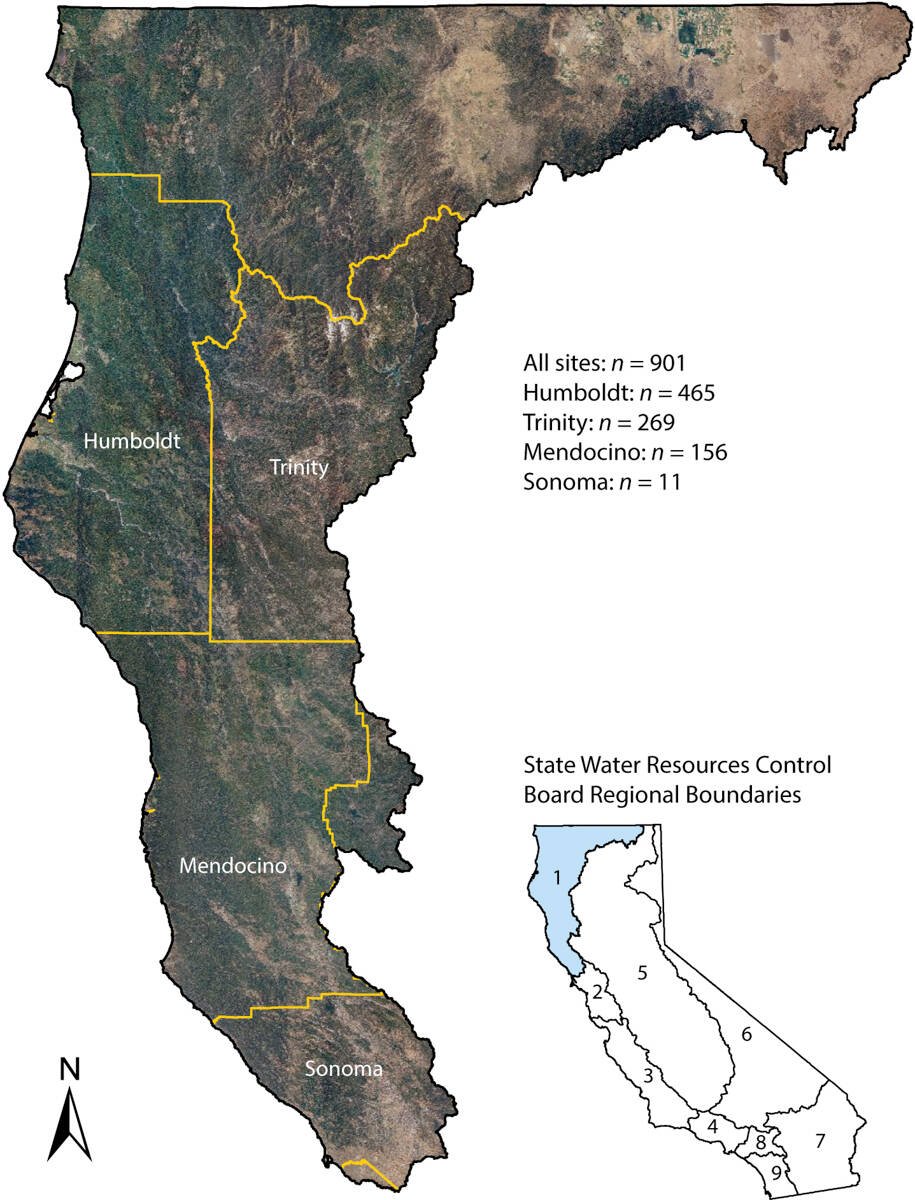
FIG. 1. Map of study area. Humboldt, Trinity and Mendocino counties together comprise the “Emerald Triangle,” entirely contained within the North Coast region of California. Additional reports were collected from sites in Sonoma County but, due to the small size of that sample, the reports were combined with Mendocino County's for analysis.
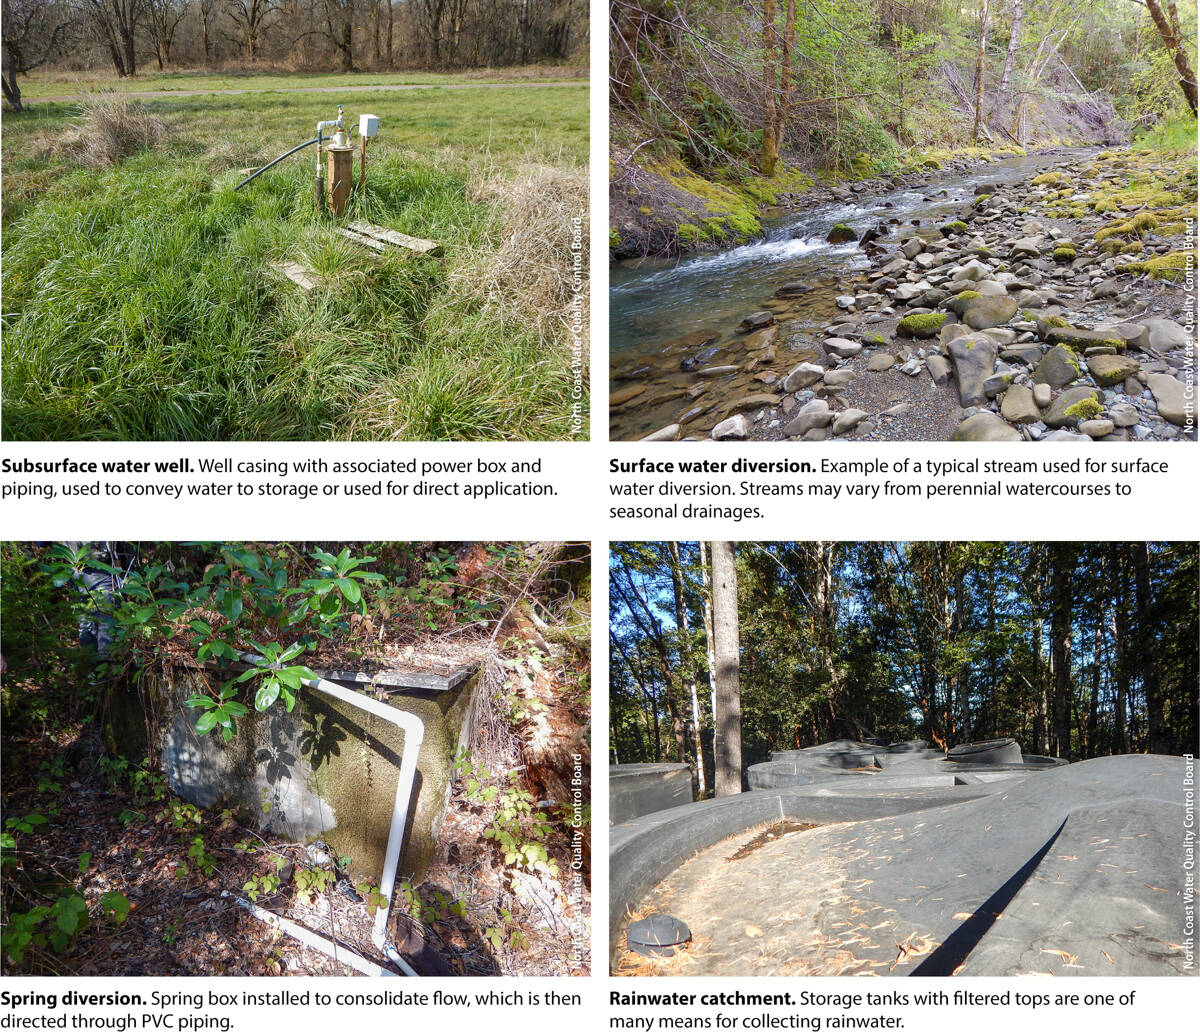
The data used for this analysis included the source and amount of water that cultivators added to storage each month as well as the source and amount of water applied to plants each month. We did not analyze absolute water extraction rates. Rather, we used the amount of water extracted each month — whether water was added to storage or applied to plants directly from the source — to analyze seasonal variation in each water source's share of total water extraction. Water sources included: surface (surface water diversion), spring (spring diversion), rain (rainwater catchment), well (subsurface water), delivery (water truck) and municipal (municipal tap) (fig. 2). The two external sources — delivery and municipal — were consolidated into a single category (off-site). Because staff from the water quality control board were not able to corroborate the accuracy of reported data, enrollees may have classified water sources erroneously. A well placed in proximity to a stream, for example, might properly qualify as a diversion of surface water; so might rainwater catchment ponds or spring diversions that are hydrologically connected to a watercourse. We attempted to minimize these potential errors by restricting the dataset to reports prepared by professional consultants.
As mentioned, enrollees were required to assess several standard conditions in their site reports, including water storage and use requirements. To encourage cultivators to join the regulated industry, and because many cultivation sites existed prior to adoption of the cannabis program, existing sites were not required to comply with standard conditions as a prerequisite for enrollment. Rather, cultivators unable to comply with the standards when they enrolled were required to indicate their lack of compliance and develop a plan for achieving compliance. Such sites were not held in violation of regulations, thus removing a potential motivation to falsely report site conditions. More than one-quarter (28%, n = 249) of enrollees in the dataset (n = 901) reported noncompliance with the Water Storage and Use Standard Condition.
Analysis of water sources
To address question 1 — from which sources cannabis cultivators most frequently extract water across the North Coast region, and if extraction patterns differ across the region — we calculated the percentage of sites that reported use of each water source (surface, spring, well, rain, off-site). We also calculated, for sites using each source, the percentage of sites that also used at least one other source category. Directly applying water to plants and also placing water in storage did not constitute use of multiple extraction sources if the water was drawn from the same source category. Additionally, sites that used multiple inputs from the same category — for example, multiple wells — were not considered users of multiple sources, as this classification was reserved for extraction from multiple categories of sources. We performed all elements of our analysis for the entire dataset and for each county individually.
To address question 2 — how reliance on each water source differed from one month to another — we divided each site's monthly water extraction total by its annual extraction total to calculate the relative percentage of water extracted in each month, and performed similar calculations for each source category. The median amount of water extracted and interquartile range were calculated for each month — both for overall extractions and for each source category individually.
To address question 3 — whether sites reporting compliance with the Water Storage and Use Standard Condition relied on different water sources than those reporting noncompliance — we compared water source extraction patterns for sites of both types. Specifically, we calculated for each compliance status the percentage of sites that extracted water from each source category and made comparisons accordingly; and did likewise for monthly extraction patterns, following procedures similar to those described in regard to question 2. The purpose of this comparison was strictly qualitative, and no inferential statistics were performed to determine statistically significant differences. Instead, this element of our analysis was performed for exploratory purposes, with the intention of identifying broad trends that warrant future attention.
Water sources varied across counties
The most commonly reported water source was wells (fig. 3). Over half the sites (58.2%) reported at least some reliance on wells for their irrigation water. Surface water (21.6%) and springs (16.2%) were the next–most common sources. Rainwater catchment and off-site water were the least commonly used water sources (12.0% and 5.4%, respectively). Sites using wells and off-site sources were the least likely to use additional sources (10.7% and 22.4%, respectively). In contrast, sites using rain catchment systems most frequently reported using an additional source category (55.6%), followed by sites reporting use of spring diversions (33.6%) and surface diversions (31.3%). To determine if the observed high frequency of well use was due to bias associated with examining only reports prepared by consultants, we reincorporated sites without consultants and reran the analysis on this dataset (n = 1,342). Reported well use was slightly more common among sites not using consultants (60.0%) than among sites using consultants (58.2%).
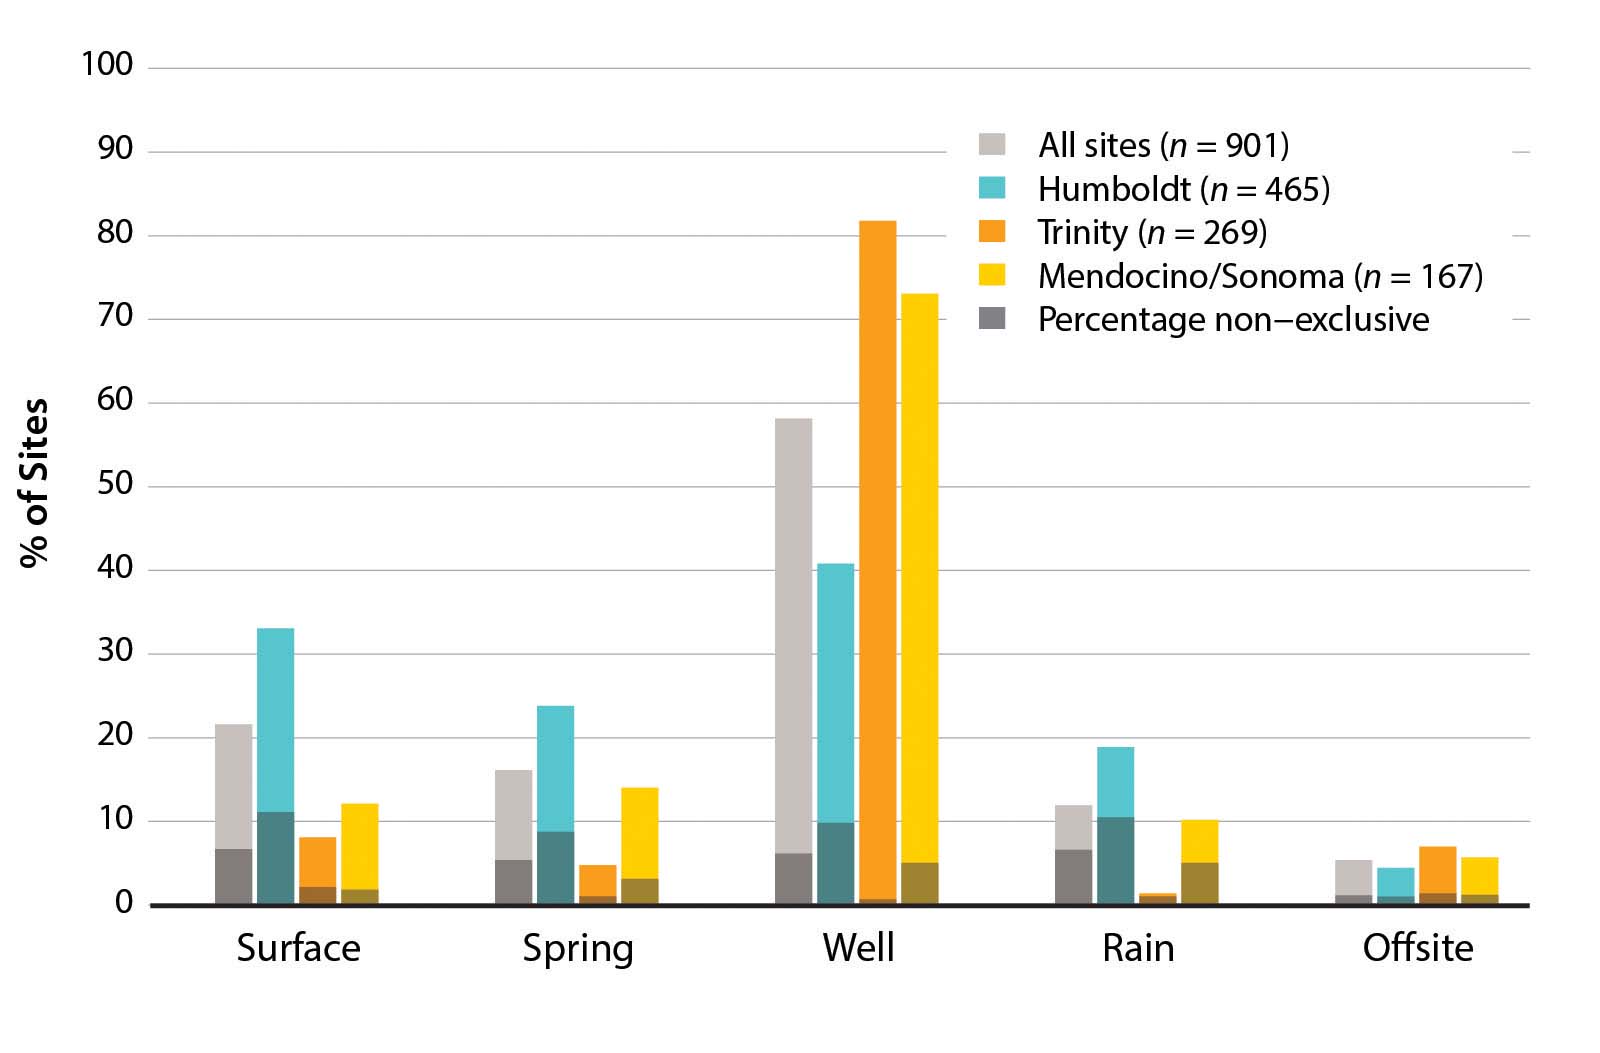
FIG. 3. Percentage of sites extracting water from each source, overall and in each county analyzed. Shaded portions of bars depict the percentage of sites using each respective source that also used additional sources (i.e., the percentage exhibiting nonexclusive use). The shaded portion depicting percentage corresponds to the length of each bar individually, rather than the x-axis.
Counties displayed notable variation in the frequency with which cannabis cultivators used particular water sources (fig. 3). Compared to all sites in the dataset, sites in Humboldt County relied more on surface water (33.1%) and spring diversions (23.9%), with fewer relying on wells (40.9%). The pattern was reversed in Trinity County, with a high percentage of sites there reporting well use (81.7%) and relatively few using surface (8.2%) and spring (4.8%) diversions. A large number of sites (n = 154) in Trinity County were located in a single watershed known for a high concentration of similar cultivation practices, so we recalculated the percentages with these sites excluded. The resulting totals for Trinity County were closer to the overall results: wells (59.4%), surface (20%), spring (11.2%), rain (2.6%) and off-site (14.7%). Mendocino and Sonoma counties (together) reported a similar pattern of extraction sources per site: wells (73.1%), surface (12.1%), spring (14.1%), rain (10.3%) and off-site (5.8%). Patterns of using multiple sources varied among counties. Sites in Humboldt County using well water extraction much more commonly used additional sources of water (24.2%) than did similar sites in Trinity (1.0%) and Mendocino/Sonoma (7.1%) counties. Use of additional sources was also more common among Humboldt County sites extracting surface water (33.8%) and spring water (36.9%) than among sites using surface and spring water in Trinity County (27.3% and 23.1%, respectively) and Mendocino/Sonoma counties (15.8% and 22.7%, respectively).
Wells were a prominent water source for cannabis cultivators during the summer months (fig. 4). Extraction from wells generally peaked in August and declined in off-season months. The pattern was reversed for rainwater use, with most extraction occurring in off-season months. Spring water use was generally even across the year, with slightly higher use during the growing season. Surface diversions occurred throughout the year, but declined late in the growing season, likely reflecting declining availability of surface water. The pattern exhibited in off-site water use closely matched that of well water; the former, however, was a less substantial source of water in general.
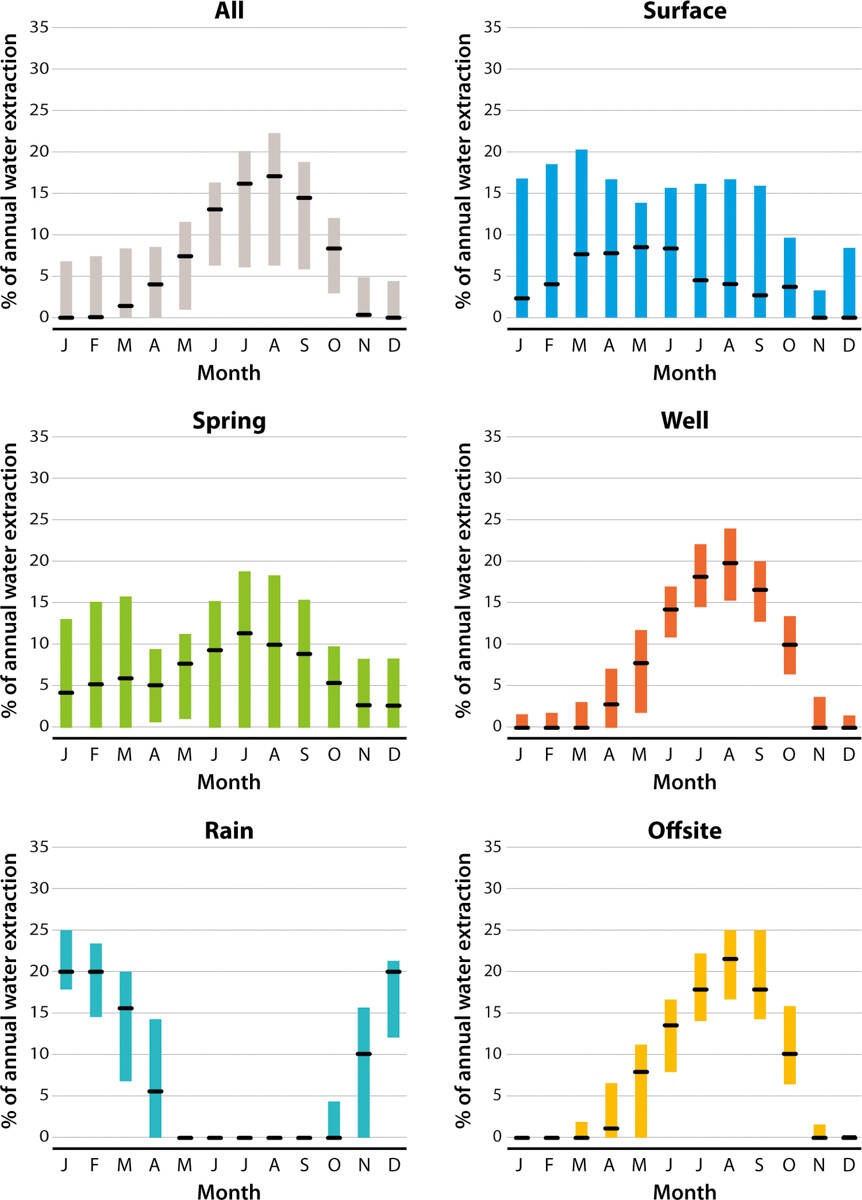
FIG. 4. Relative monthly water extraction. Boxes depict the interquartile range, with black lines at median values for each month. Monthly values reflect the sum of water placed in storage and directly applied to plants.
There appeared to be differences in the extraction sources reported by compliant and noncompliant sites (fig. 5). Although nearly one-third of noncompliant sites (32.5%) used well extraction, this source was more than twice as frequently reported among compliant sites (67.9%). In contrast, noncompliant sites reported surface diversion (39.4%) and spring diversion (36.1%) more commonly than did compliant sites (14.9% and 8.6%, respectively). Rain and off-site sources were the least commonly used for both compliant sites (12.1% and 6.3%, respectively) and noncompliant sites (11.6% and 3.2%, respectively). Use of additional alternative sources was lower for compliant sites with wells (7.0%) than for noncompliant sites with wells (32.5%). The seasonal extraction patterns of compliant and noncompliant sites were generally similar (fig. 6), following the overall pattern discussed above.
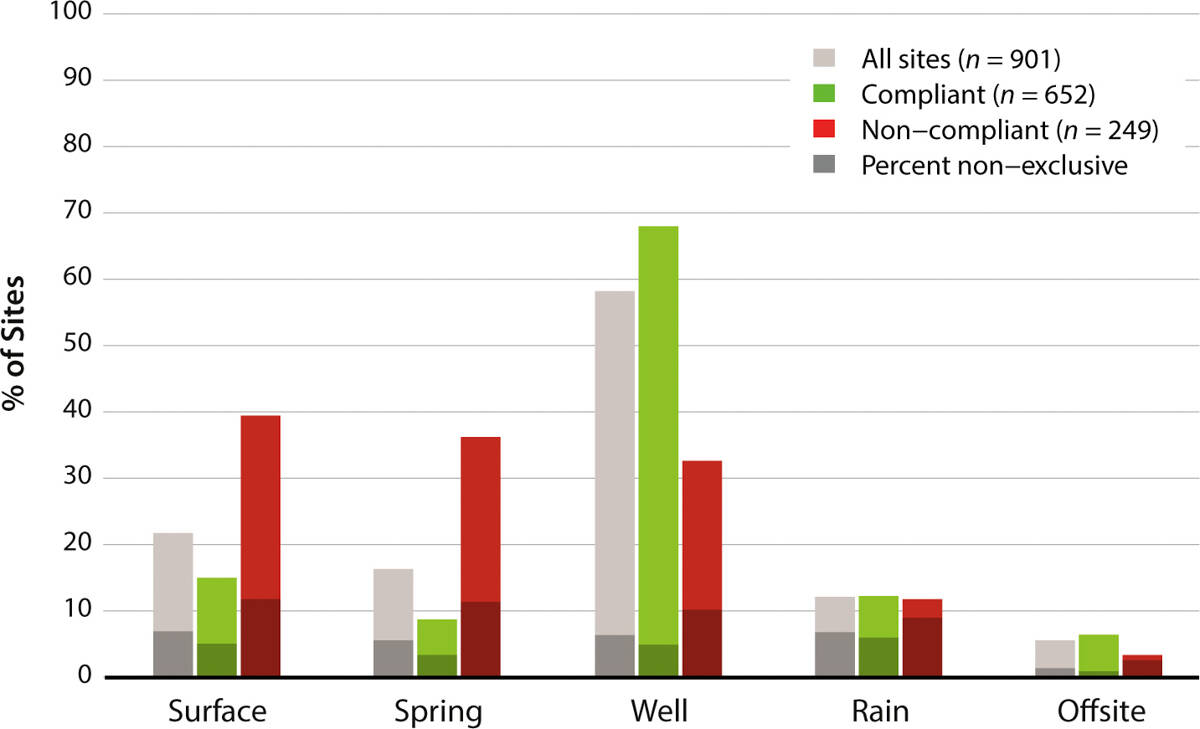
FIG. 5. Percentage of sites extracting water from each source, organized according to reported compliance status. Shaded portions of bars depict the percentage of sites using each respective source that also used additional sources (i.e., the percentage exhibiting nonexclusive use). The shaded portion depicting percentage corresponds to the length of each bar individually, rather than the x-axis.

FIG. 6. Comparison of relative monthly water extraction for compliant and noncompliant sites. Boxes depict the interquartile range, with black lines at median values for each month. Monthly values reflect the sum of water placed in storage and directly applied to plants.
Effects on streamflow
We found that well water is the most commonly reported source of extracted water for cannabis cultivation in the North Coast region of California. Furthermore, among the source categories, wells are least frequently supplemented with alternative sources. Spring and surface water diversions together are also important water sources, with seasonal patterns of use that are distinct from well water extraction. Reported timing of well water extraction closely tracks the water demand patterns of plants, indicating that cultivators are applying well water directly to plants, rather than storing it. In contrast, the timing of extractions of spring water and surface water remains relatively consistent throughout the year, suggesting that water from these sources may be diverted to storage in the winter, reducing the need for extraction in the summer months. These seasonal extraction patterns and the relative predominance of each source may inform assessments of cannabis cultivation's impacts on water availability.
The use of well water for cannabis cultivation, in comparison to other water sources, presents both potential threats and benefits for instream flow. In upper reaches of small watersheds, streams are dependent throughout the summer months on subsurface water flows from the landscape into the stream. Well water extraction may reduce cold water inputs — limiting streamflow or, in extreme conditions, dewatering stream channels (Barlow and Leake 2012). The extent to which use of subsurface water affects streamflow and water temperature depends on the degree to which well water sources are hydrologically connected to streams. When wells are shallower and closer to streams, and when soil conductivity is greater, subsurface water pumping is more likely to directly capture streamflow. However, if wells are less hydrologically connected to streams, the effects of extraction will be attenuated, resulting in smaller-magnitude and temporally lagged streamflow depletions. With sufficient groundwater recharge in wet months, well water extractions may affect streamflow less than surface water diversions, which were previously assumed to be cannabis cultivators' predominant means of obtaining water in the region (Bauer et al. 2015). Further analysis is necessary to understand the potential impacts of well use on streamflow depletion. Such an analysis would incorporate information on well locations and depths and would consider the underlying geology and soil properties at cultivation sites (Konikow and Leake 2014). Meanwhile, the prevalence and distribution of wells relative to other water sources are influenced by broader geospatial characteristics such as topography and precipitation patterns. Understanding these issues will also be important for assessing the threats and benefits associated with subsurface water extraction.
Variation between counties in well extraction patterns demonstrates that, although subsurface water may be the most common source of water in North Coast cannabis cultivation, the availability of alternative (that is, seasonal) sources may play an important role. Humboldt County watersheds included in this study consistently receive more average annual precipitation (mean = 73.7 inches) than do those in Trinity (53.2 inches), Mendocino (55.1 inches) and Sonoma (46.5 inches) counties (PRISM Climate Group 2018). This difference translates into more available surface and spring water in Humboldt County over the course of the growing season. The observation that fewer sites in Humboldt County report well use, compared to other counties in the study, suggests that if surface or spring water is available, cultivators are likely to use it. Conversely, the potential necessity of groundwater use in counties that receive less rainfall holds particular importance in consideration of emerging areas of industry growth throughout California. Further analysis is needed to understand how likely cultivators are to rely on wells if other sources of water are available to them. The winter preceding the 2017 growing season was the wettest on record. It is important to understand how cultivators may source their water during years in which summer water availability is not as abundant.
These findings suggest that cultivators may utilize wells both as insurance against surface water scarcity in the summer drought months and as a means of achieving regulatory compliance. The observation that nearly one-third of noncompliant sites reported well extraction indicates that use of subsurface water may be a common means to avoid water scarcity in the late growing season. While Northern California receives considerable seasonal rainfall, there is also significant spatial variability in rainfall totals and in corresponding summer flow persistence of small streams (Zimmerman et al. 2017). Considering the ephemeral nature of surface water in many areas (Arismendi et al. 2013; Deitch and Dolman 2017), the increasing frequency of drought due to climate change (Diffenbaugh et al. 2015) and cannabis cultivation's consistent demand for irrigation water as crops near harvest (Cervantes 2006), cultivators are strongly motivated to secure reliable water sources for the entirety of the growing season. Therefore, it is likely that water extraction from wells is a common practice for cultivators, beyond those seeking participation in the regulated industry (Wilson et al. 2019). Although cannabis regulations place no explicit restrictions on where water is sourced, those currently within or seeking to join the regulated cannabis industry will be subject to a restriction on diversions of spring and surface water during the growing season (April through October). This requirement (formally referred to as a “forbearance period”) is already in place for permits issued by the California Department of Fish and Wildlife and will also be enforced by the State Water Resources Control Board beginning in 2019. The data provided in this study indicates that, in order to meet the forbearance period requirement, cultivators may be more inclined to drill a well to achieve compliance than to develop water storage for spring and surface water. Determining cultivators' capability to store the water they need for the growing season may shed further light on the likelihood that growers will seek subsurface water. If compliance necessitates drilling a well, it will be important to account for the impacts of this potential shift in cultivation practices.
Successful protection of freshwater resources in Northern California will require a more complete accounting of where cannabis cultivators source their water and the amount and timing of water extracted (Megdal et al. 2015). Study of cannabis as an agricultural crop has been notoriously inadequate, but data provided by the water quality control board's cannabis program offers critical new insights into the water use practices of cultivators entering the regulated industry. In this initial analysis, we found that subsurface water may be much more commonly used in cannabis cultivation than previously supposed. Further analyses of cannabis cultivation's water extraction demand, as well as of geospatial variation in water demand, may help elaborate the ramifications of this finding. Ultimately, a better understanding of cannabis cultivation's water demand will be useful for placing the cannabis industry in the greater context of all water allocation needs in the North Coast and throughout California.
Watering the Emerald Triangle: Irrigation sources used by cannabis cultivators in Northern California

