


All Issues
The California Tree Mortality Data Collection Network — Enhanced communication and collaboration among scientists and stakeholders
Authors
Beverly Bulaon,
Danny Cluck,
Stella Cousins,
Lauren Cox,
Becky Estes,
Chris Fettig,
Andrea Hefty,
Stacy Hishinuma,
Sharon Hood,
Susie Kocher,
Devin McMahon,
Leif Mortenson,
Alexander Koltunov,
Elliot Kuskulis,
Adrian Poloni,
Carlos Ramirez,
Christina Restaino,
Hugh Safford,
Michèle Slaton,
Sheri Smith,
Carmen Tubbesing,
Rebecca Wayman,
Derek Young,
Publication Information
California Agriculture 73(2):55-62. https://doi.org/10.3733/ca.2019a0001
Published online March 11, 2019
PDF | Citation | Permissions
NALT Keywords
Summary
Critical research and dialogue are underway to understand the consequences of the massive wave of tree mortality in the Sierra Nevada.
Full text
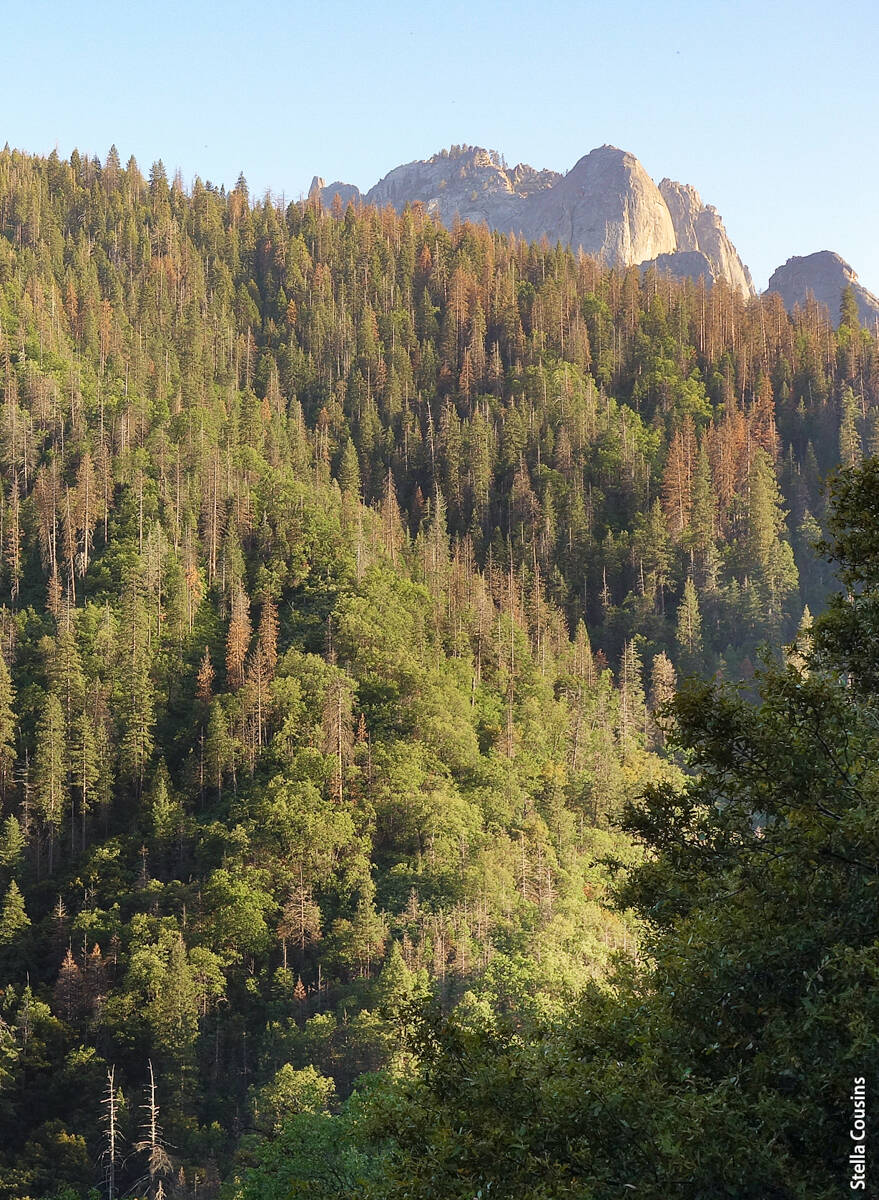
Over 147 million dead trees were detected in California by the U.S. Forest Service Aerial Detection Survey (USFS ADS) from 2010 to 2018 (USDA 2019). The massive tree mortality, mostly in the Sierra Nevada and evident in swaths of conifers with red needles, resulted from the 2012–2016 drought and subsequent explosions in native bark beetle populations. While levels of mortality have declined in the last 2 years, the consequences will last for decades to come. Trees that died will fall over and surface fuel loads will increase — already the accumulation of millions of tons of dead material on forest floors is vastly outpacing the resources of local, state and federal jurisdictions to remove it. Urgent dialogue has started among UC scientists, forest managers, and public agencies to manage the consequences of the unprecedented tree die-off and increase the resiliency of forests to future droughts.
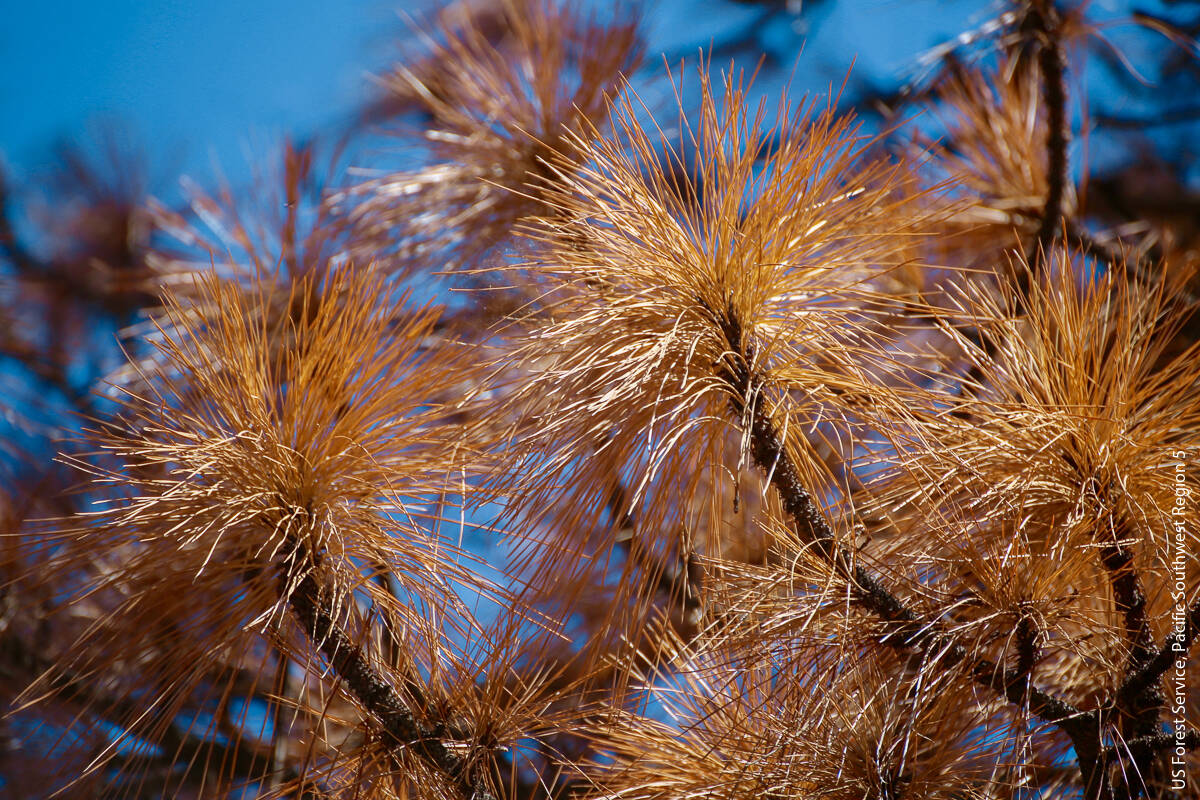
Dead needles on tree in the Sierra National Forest.
To accomplish these goals, we need data on the rates of ongoing tree mortality and dead tree fall, surface fuel build-up, wildfire hazard, forest renewal patterns, and the course of bark beetle outbreaks. Data are also needed to understand the long-term impacts of the wave of tree mortality on ecological services such as carbon storage and water quality.
In 2017, we set up the Tree Mortality Data Collection Network, led by academics at UC Berkeley and UC Agriculture and Natural Resources, to bring together scientists and agencies who are conducting field and remote-sensing studies across the Sierra Nevada. Then, rather than waiting for the results to be published in academic journals, we decided a paradigm shift was necessary — we would translate our science into dialogue by hosting in-person events and putting the results quickly into the hands of forest decision-makers and planners, and counties needing grants to remove accumulating surface fuels.
The dialogue began in March 2018 at the first Tree Mortality Data Collection Network workshop held at the USFS Wildland Fire Training Center in McClellan Park, Sacramento, and continued at a second workshop there in March 2019. Along with other researchers, we presented newly collected data to state and federal agencies, local governments, nongovernmental organizations, landowners and community representatives (see next pages).
Huge increase in dead tree biomass
Among the most troubling information presented at the 2018 workshop was the huge increase in dead tree biomass. Models predict that 1,000+ hour fuels (dead biomass ≥ 3 inches in diameter) will double in some areas; fuels in these size classes produce significant heat that strongly influences fire effects, such as fire severity and soil heating. A study in the central to southern Sierra showed that between 2014 and 2017 an average of 48.9% of trees died; mortality was higher at low elevations (60.4%) than high elevations (46.1%), most severe in 2016 and concentrated in larger-diameter conifer trees, especially ponderosa pines. Data from another study showed that thinning before the drought had substantially reduced subsequent levels of pine tree mortality in the central Sierra, but thinning had not been effective in the southern Sierra, where drought stress was much greater.
At the workshops, researchers shared the results from many new studies and also from the longstanding field-based inventories conducted by the USFS Forest Inventory and Analysis Program (FIA), which are a key source for understanding long-term forest change. Conducted across all forested lands, the inventories enable a large-scale picture to emerge of how California's forests have been impacted by mortality and give a glimpse of where forests are headed as they recover and face future droughts.
Workshop participants were also interested in remote-sensing technologies for monitoring forests. As the technology has evolved and products have become publicly available, a multi-decadal archive of data has allowed researchers to ask questions about disturbances and disturbance regimes in ways not possible before. There are also new ways to quantify disturbance impacts by integrating data from different agencies and institutions. For example, merging forest structure data and USFS ADS mortality polygons showed that of all the dead standing biomass in the state, 82% to 85% was located in 10 central and southern California counties, many of which have been designated by CalFire as high-priority counties for tree removal projects.
During an open conversation between planners, managers and scientists at the 2018 workshop, a resounding sentiment expressed was the need for studies to provide insight at the county level. Of the list of priorities generated by stakeholders, progress has been made in the following areas:
-
contextualizing the recent tree mortality against background levels of mortality and identifying the characteristics of healthy forests
-
monitoring tree fall rates, to help quantify hazard predictions and suitability for salvage
-
characterizing living trees and regeneration, identifying where regeneration is unlikely without restoration efforts and also where tree thinning should be prioritized
Ongoing mortality, tree fall, fire risk
At the 2019 workshop, expanded from a half day to a full day and attended by more than 70 people, the audience first heard scientists' reports on patterns of ongoing mortality, tree fall and fire risk.
Encouragingly, 2018 saw a decrease in ongoing mortality across a Sierra-wide network of plots. Mortality ranged from around 20 to 80 dead trees per acre, with the highest mortality in the southern Sierra. Measurements of tree fall in 2018 indicated that white fir experienced the highest fall rate, 3%, and ponderosa pine the lowest, just over 1%.
In the Sierra National Forest, a study found that between 2016 and 2018 an average of 19% of recently dead trees (trees that had died since 2014) fell, increasing surface fuel loads. Incense cedar experienced the highest fall and breakage rates, at 35%, followed by red fir, at 26%. Of all of the fallen snags, 64% broke below 15 feet and 34% broke at 0 feet.
A study that looked at the 2016 Cedar fire and 2015 Rough fire in the southern and central Sierra Nevada, respectively, showed that pre-fire tree mortality in those areas could influence fire severity. In the Cedar fire, influential variables on fire severity were weather metrics and the severity of pre-fire red phase tree mortality. In the Rough fire, the most influential variable on fire severity was the severity of pre-fire red phase tree mortality, followed closely by stand basal area (the cross-sectional area of trees across a unit of land).
Forest regeneration, species change
Researchers monitoring field sites are beginning to observe patterns of forest regeneration and resilience. Across a Sierra-wide network of sites, researchers found total sapling density ranged from 30 to nearly 600 trees per acre, with an average of 238 saplings per acre; seedling density ranged between 300 to over 14,000 trees per acre, with an average of around 4,100 seedlings per acre. Both saplings and seedlings were dominated by shade-tolerant species, such as white fir and incense cedar, with very low counts of pines or hardwoods (i.e., oak).
In the central through southern Sierra, in stands that all experienced high mortality (67% to 100% of the basal area), a study is showing a difference in regeneration patterns between previously thinned and unthinned stands. In unthinned stands, tree mortality was higher, and shade-tolerant species were now dominating the understory; less than 20% of the saplings and seedlings were pines and less than 25% were hardwood species. In thinned stands, mortality was lower, and more hardwoods (50%) and pines (25%) were present in the understory; only 25% of understory trees were shade-tolerant species. Researchers in both studies were uncertain how much of the understory will survive as dead trees fall and crush seedlings and saplings. Ongoing monitoring will be necessary to understand these dynamics, and to inform decisions concerning how and whether, considering the changing climate, to replant underrepresented species.
A rapid response framework
Following the research updates, roundtable sessions focused on the elements of a rapid response to ongoing and future tree mortality. Ideally, a rapid response framework would be created by sharing information and coordinating decision making before a state-level emergency needed to be declared. Thresholds could be established, which when crossed would trigger specific actions across jurisdictions in a time-effective way. For example, datasets on the limited regeneration of desirable tree species, such as pines, might initiate replanting efforts focused on these species.
A rapid response framework requires collaboration in four areas: research and monitoring, land management, education and outreach, and policy. These particular needs were identified:
-
a landscape-scale understanding of what factors predispose forests to mortality
-
a set of key factors, or indicators, that identifies when a mortality event is occurring and where forests are most vulnerable
-
tools to prevent and respond to tree mortality (e.g., streamlined permitting and adequate infrastructure such as workforce, funding and forest products processing facilities)
-
projections of how tree species changes could affect ecosystem services such as water supply and quality, wildlife, aesthetics and carbon storage
-
education and outreach that help the public learn what a healthy forest looks like
-
across local, state and federal jurisdictions, the political will to be more proactive in forest management, especially in engaging with communities to develop collaborative planning and policy mechanisms
-
indicators to identify when planting is desirable, and novel approaches to species mixes and seed zones
-
guidelines on how tree density in newly regenerated areas should be maintained to be more sustainable in a changing climate
-
nuanced messaging — focused on ecosystem services and wildfire hazard risk reduction — around the effects of changed species composition and the need for reforestation
-
educator networks to reach all landowners, especially those in wildland-urban interface areas
-
long-term, coordinated funding for forest management, perhaps from ecosystem service taxes paid by those who benefit from forests
Our collective challenge
The 2012–2016 drought in California (Swain 2015) revealed just how vulnerable vast regions of the state's forests are to extremely dry and warm conditions. In some areas the recent drought was the most severe to occur in the past 1,200 years (Griffin and Anchukaitis 2014). With more frequent and extreme drought conditions predicted with a changing climate (He et al. 2018), a better understanding of drought-induced tree mortality is essential, as are the forest management strategies that can minimize future tree mortality (Stephens et al. 2018). As the waves of red trees drop their needles and fade into the background, we hope individuals, agencies and institutions will stay engaged to promote healthy, productive and resilient forests and communities.
The degree to which we can collectively address issues raised in these workshops and develop a framework for action is ultimately contingent on securing adequate funding, continued collaboration among scientists, and continued participation by a variety of stakeholders. The Tree Mortality Data Collection Network is a first step in this direction. We will continue to share data and work with land managers and decision-makers to feed research findings into action for resilient future forests.
Tree mortality in the Sierra Nevada studies
UC Berkeley, UC ANR mortality study
Jodi Axelson, John Battles, Lauren Cox, Susie Kocher and Elliot Kuskulis
Mortality and regeneration study, 283 plots on eight sites, in mixed-conifer elevation bands, north to south Sierra Nevada.
-
Tree mortality lowest in north, highest in south (fig. 1A), mirroring pattern detected by USFS ADS (California Forest Pest Council 2017).
-
Tree mortality largely driven by bark beetles; fir engraver (Scolytus ventralis) the most damaging.
-
Sapling and seedling density in 2018 highly variable across sites; most abundant were shade-tolerant species such as white fir (Abies concolor) and incense cedar (Calocedrus decurrens) (fig. 1B).
-
In 2018, white fir experienced the highest tree fall rate, 3%, and ponderosa pine the lowest, just over 1%.
-
Predictions for Sequoia-Kings Canyon National Park from 2017 to 2030: 31% loss of live tree biomass, 330% increase in dead tree biomass, doubling of 1,000+ hour fuels (≥ 3 inches).
-
Predictions across all sites in the network, 2017–2030: 75% of plots will have greater than 100 tons per acre of downed and dead wood.
-
More information at https://ucanr.edu/delivers/?impact=1077&delivers=1 .
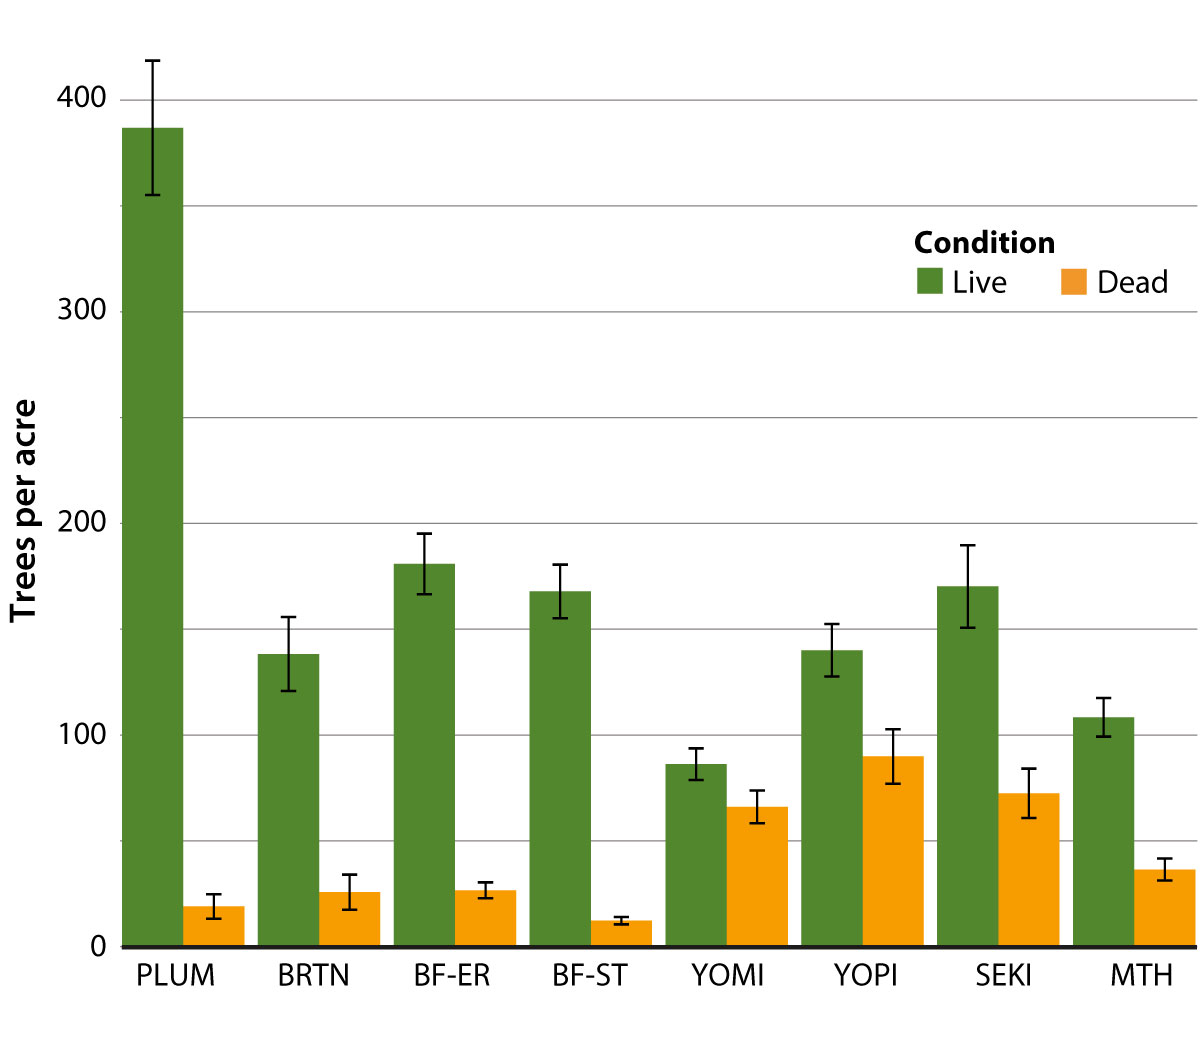
FIG. 1A. Mean number of live and recently dead trees per acre (+ standard error of the mean, SEM), 2018. Sites, from north to south: Plumas National Forest, Burton Creek State Park, Blodgett Research Forest – Ecological Reserve, Blodgett Research Forest – Single Tree Selection, Yosemite National Park (mixed conifer), Yosemite National Park (pine), Sequoia-Kings Canyon National Park, Mountain Home State Demonstration Forest (Axelson et al., in preparation).
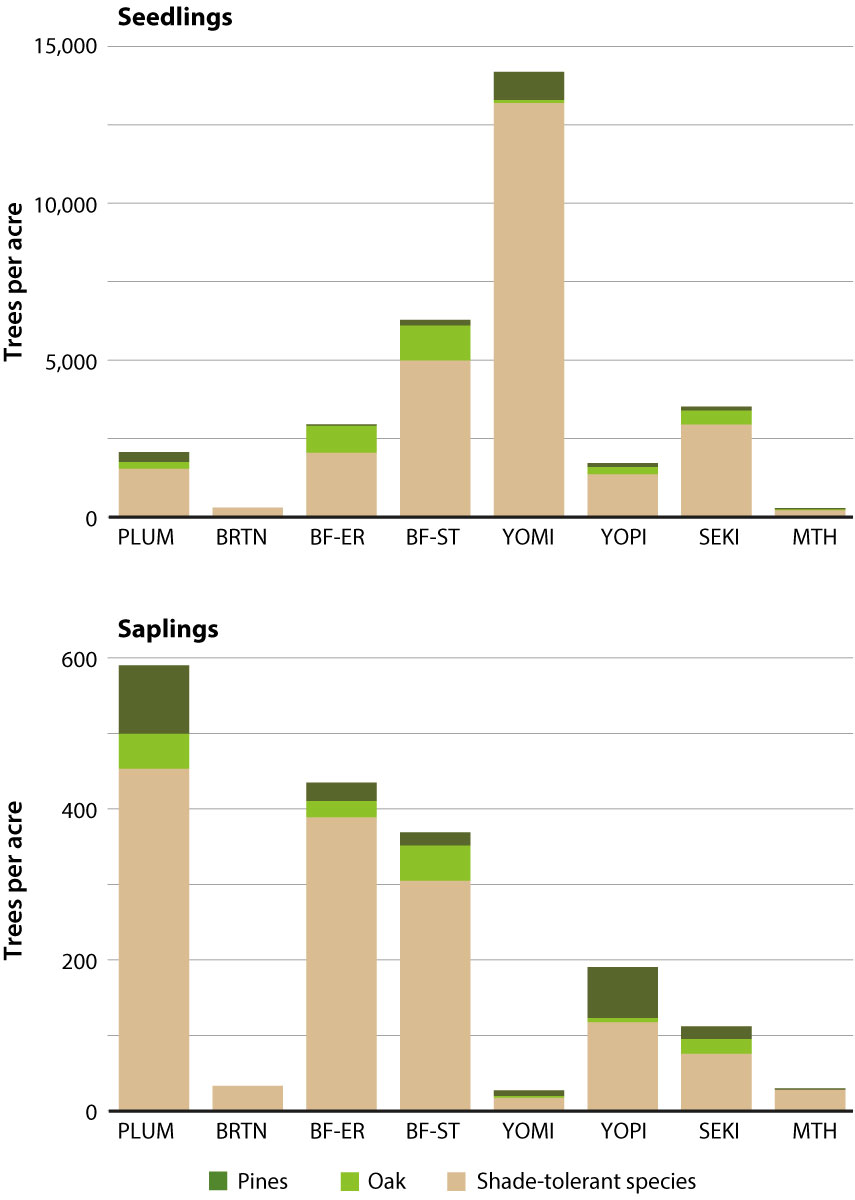
FIG. 1B. Mean number of seedlings (top) and saplings (bottom) per acre, 2018, categorized as pines (ponderosa and sugar pine), oak (black oak) and shade-tolerant species (white fir, incense cedar and Douglas fir) (Axelson et al., in preparation).
Researchers will remeasure components of the plots annually to track tree status, bark beetle activity, dead tree fall rates, fuel accumulations and understory response.
U.S. Forest Service Region 5 thinning study
Becky Estes, Derek Young and Christina Restaino
Effects of thinning on tree mortality along a latitudinal gradient in forests on National Forest, National Park and Bureau of Land Management lands.
-
Thinning effectiveness decreased along the latitudinal gradient to the southern Sierra, where water stress was so high that stand density was less important (fig. 2A).
-
Thinning substantially reduced mortality in central Sierra.
-
In 2017, even in thinned, high-mortality plots, the density of surviving canopy trees (> 3-inch diameter) was 18 per acre; regeneration (< 3-inch diameter) was 76 per acre, suggesting that most stands will recover reasonable densities naturally.
-
Drought mortality (concentrated in pines) has led to species shift. Among surviving canopy trees and regeneration, there was an unnaturally high relative abundance of shade-tolerant conifer species; pre-drought thinning reduced this effect (fig. 2B).
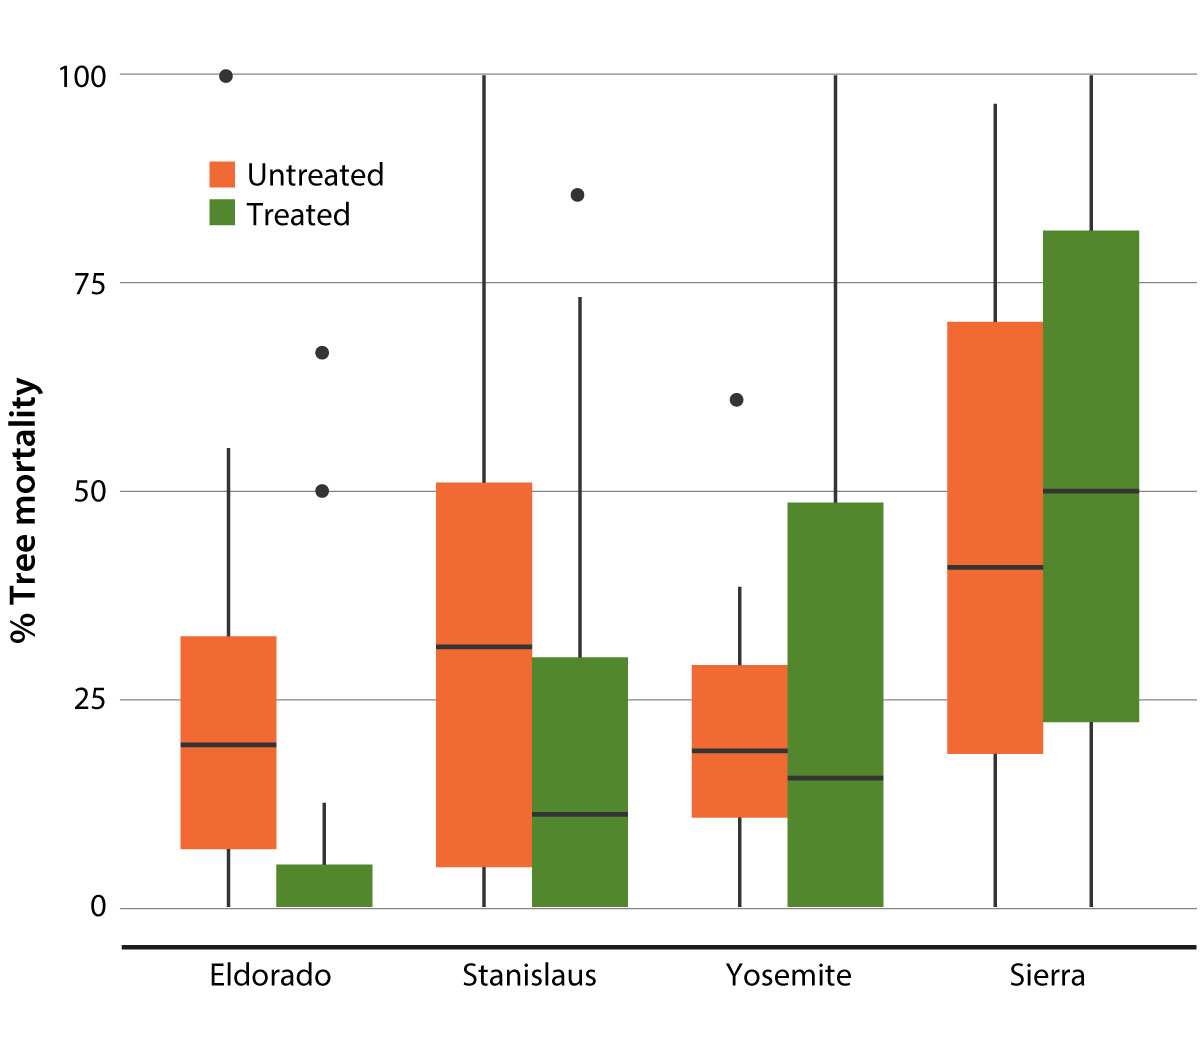
FIG. 2A. The effectiveness of thinning treatments decreased from the central to southern Sierra Nevada (Restaino et al., in press).
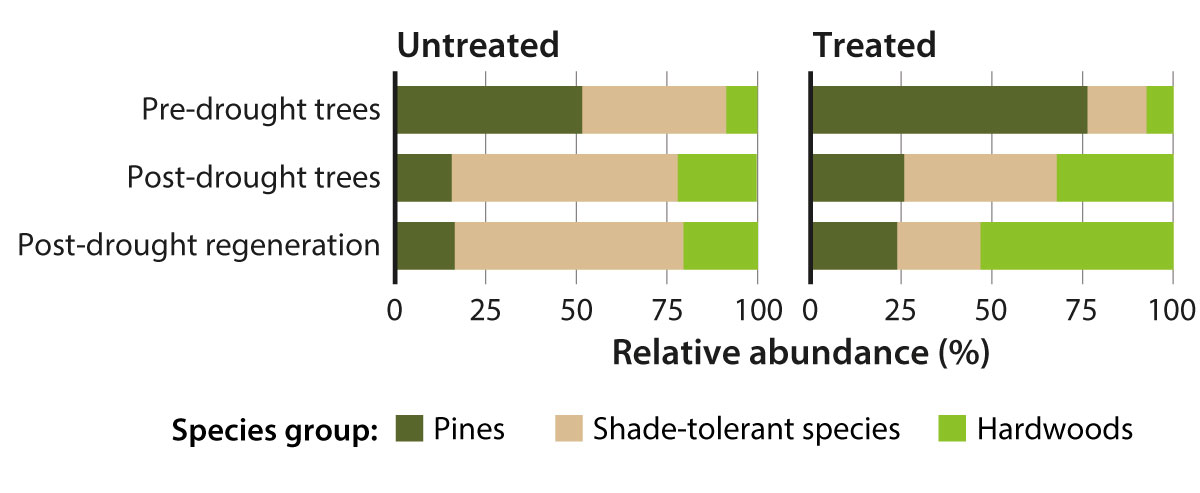
FIG. 2B. Drought has increased the dominance of shade-tolerant species, especially in unthinned stands. Thinned stands include more pines and hardwoods (Young et al., in review).
Researchers will document changes in stand resilience by evaluating residual structure and composition.
U.S. Forest Service Pacific Southwest Research Station mortality study
Chris Fettig, Leif Mortenson and Beverly Bulaon
Study in high-mortality areas, at three elevational bands, in the Eldorado, Stanislaus and Sequoia National Forests.
-
Mortality most severe in 2016 (fig. 3) and concentrated in larger-diameter conifer trees — in 3 years only one oak (Quercus) died.
-
Between 2014 and 2017, 48.9% of trees died (fig. 3), and there were higher levels of mortality at low elevations (60.4%) than at high elevations (46.1%).
-
Mortality mostly attributed to western pine beetle (Dendroctonus brevicomis; WPB).
-
Ponderosa pine (Pinus ponderosa), the only host of WPB in the area, suffered highest levels of tree mortality, from 18.2% to 100% per plot.
-
39% of plots lost all ponderosa pine.
-
Sugar pine (Pinus lambertiana) experienced 48% mortality, concentrated in mid-diameter trees, most due to mountain pine beetle (Dendroctonus ponderosae).
-
White fir mortality at 26%, most due to fir engraver.
-
Mortality positively correlated with tree density (Fettig et al. 2019).
As funding allows, researchers will remeasure plots on a regular basis.
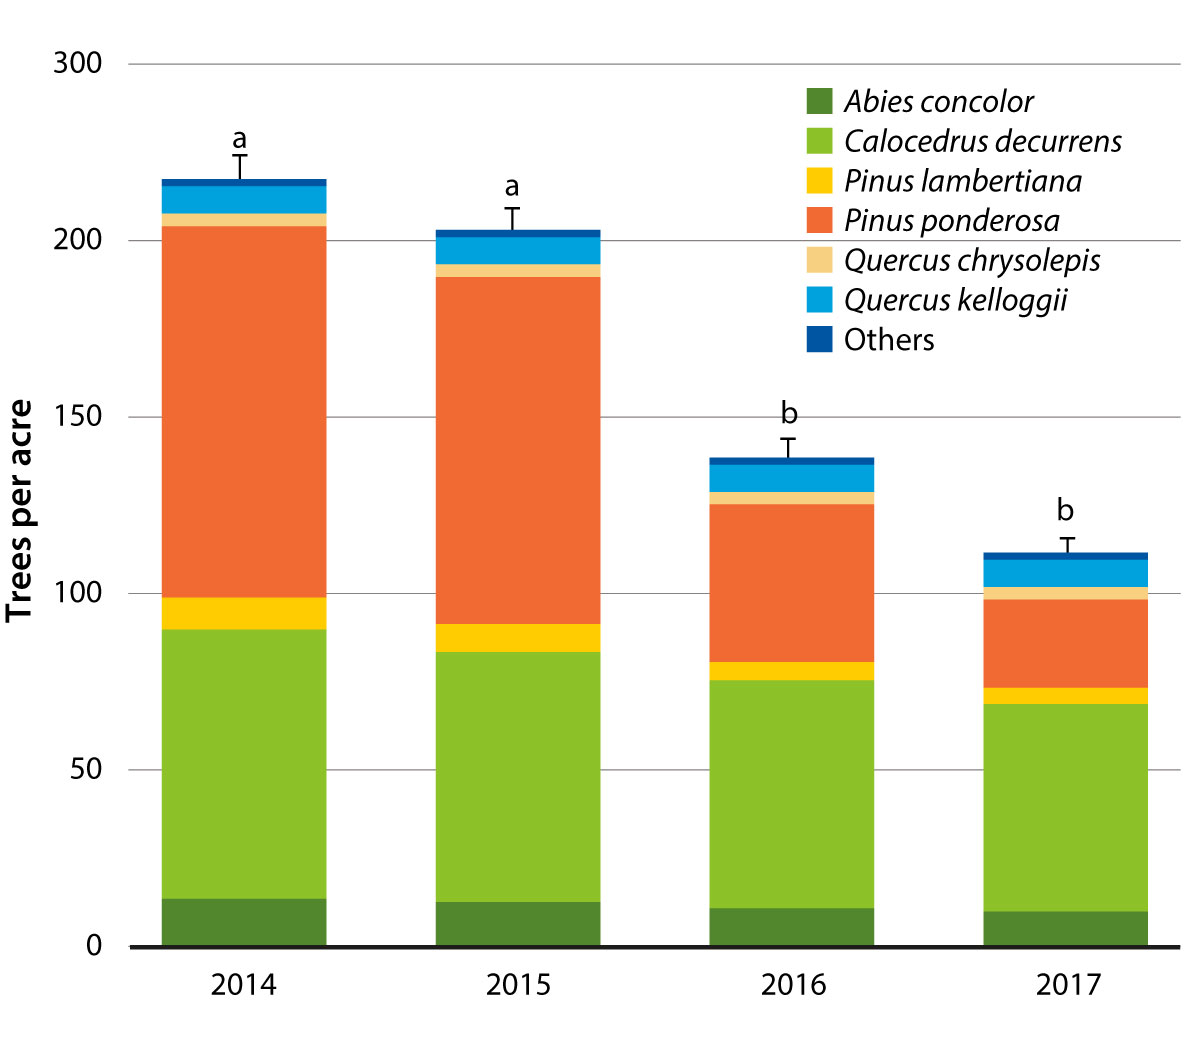
FIG. 3. Mean number of trees per acre by species (+ standard error of the mean, SEM), 2014–2017. Ponderosa pine (Pinus ponderosa) has suffered the highest levels of mortality. Means (+ SEM) followed by the same letter are not significantly different (P > 0.05). Adapted from Fettig et al. (2019).
U.S. Forest Service Rocky Mountain Research Station vegetation and fuels monitoring study
Sharon Hood, Sheri Smith, Danny Cluck, Beverly Bulaon, Stacy Hishinuma, Andrea Hefty and Adrian Poloni
Vegetation and fuels monitoring study plots on Sierra and Los Padres National Forests in areas of high and low tree mortality.
-
In 2017, on the Sierra National Forest, mortality was high, especially in pines — 93% mortality of sugar pine, 89% of ponderosa pine.
-
In 2017, areas of high mortality, no clear difference in tree size between live and dead white fir and incense cedar; dead red fir (Abies magnifica) trees smaller than living red fir; dead ponderosa pine trees larger than living ones.
-
Regeneration in Sierra study plots mainly white fir.
-
From 2016 to 2018, an average of 19% of new snags (i.e., trees that died since 2014) fell; 64% broke below 15 feet, 34% broke at 0 feet (table 1).
-
Fuel loading is very high, particularly in 1,000+ hour class.

Researchers will remeasure plots annually for 5 years to follow changes in tree status and fuel loading, and use dendrochronology data to compare the growth of trees that lived with the growth of those that died recently.

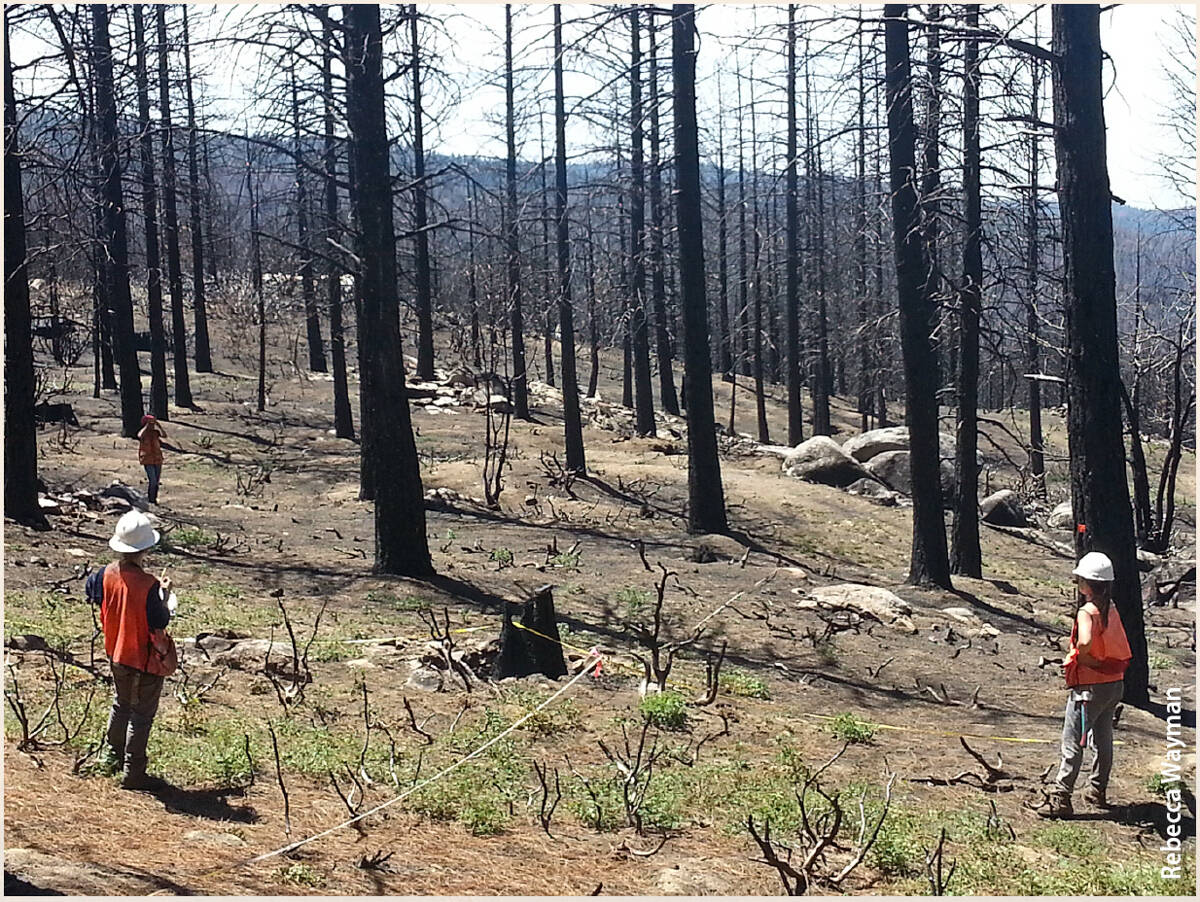
In the Sierra National Forest, Adrian Poloni (then at UC Davis) and Lindsay Grayson (USFS Rocky Mountain Research Station) sample fuels in an area of high mortality. Red trees are recently dead white fir.
UC Davis, U.S. Forest Service study on effects of tree mortality on wildfire severity
Rebecca Wayman and Hugh Safford
Study on how recent tree mortality has influenced wildfire severity in forests that historically experienced frequent fires, 180 plots on the 2015 Rough fire (150,000 acres) and 2016 Cedar fire (30,000 acres) in the southern Sierra Nevada.
-
In the Cedar fire, influential variables on fire severity were weather metrics and the severity of pre-fire red phase tree mortality.
-
In the Rough fire, the most influential variable on fire severity was the severity of pre-fire red phase tree mortality, followed closely by stand basal area.
-
Increasing levels of pre-fire tree mortality up to 30% to 45% corresponded to increasing fire severity on both fires, but higher levels of tree mortality were not associated with further increases in fire severity.
Researchers will continue to analyze data and hope to publish results in 2019.
In the footprint of the 2015 Rough fire, UC Davis crew members collect plot data 1 year post-fire to evaluate the relationship between pre-fire tree mortality and wildfire severity.
UC Berkeley, U.S. Forest Service field-based mortality inventories
Stella Cousins and colleagues
Field-based inventories conducted by the USFS Forest Inventory and Analysis Program (FIA), 2,800 plots (one for every 6,000 acres) on California forests, all ownership types.
-
2012–2015 estimate of mortality in Sierra Nevada: 167 million trees.
-
From 2011 to 2016, over 79,000 trees were remeasured — mortality rates more than doubled since 2001–2003.
-
Leading causes of tree mortality were fire, harvest and unknown causes. Mortality primarily caused by pests or pathogens was 24% of nonharvest mortality.
-
Largest increases in mortality were among red fir, white fir and sugar pine.
-
Mortality in smaller trees (< 30-inch diameter) highest in white and red fir; for largest trees, highest in sugar pine.
Researchers will continue to investigate patterns of tree mortality over time.
Mortality in pines and firs at elevations from 4,000 to 7,000 feet, June 2018, on the middle fork of the Kaweah River mirrors FIA data — tree mortality increasing at all elevations where forests are found and affecting many species.
U.S. Forest Service Region 5 western pine beetle study
Sheri Smith, Beverly Bulaon, Danny Cluck, Andrea Hefty, Stacy Hishinuma and Adrian Poloni
Examined historic research on western pine beetle (WPB) lifecycle timing, numbers of generations and winter temperature data; in 2017 conducted field-based monitoring of WPB to compare to historical baseline.
-
Timing and number of WPB generations nearly identical to historic observations (1930s), even during hottest summer on record.
-
2017 field data indicated that there were two full and one partial generations of WPB on Lassen and Stanislaus National Forests.
-
Most areas on west slope of Sierra Nevada, especially at lower elevations, likely never experienced cold enough temperatures (ambient air temperatures of −15°F to −20°F for an extended period) to result in WPB mortality or affect outbreaks.
More monitoring is needed in other parts of California over longer timeframes to better describe year-to-year variation and detect any differences in beetle biology from historic record.
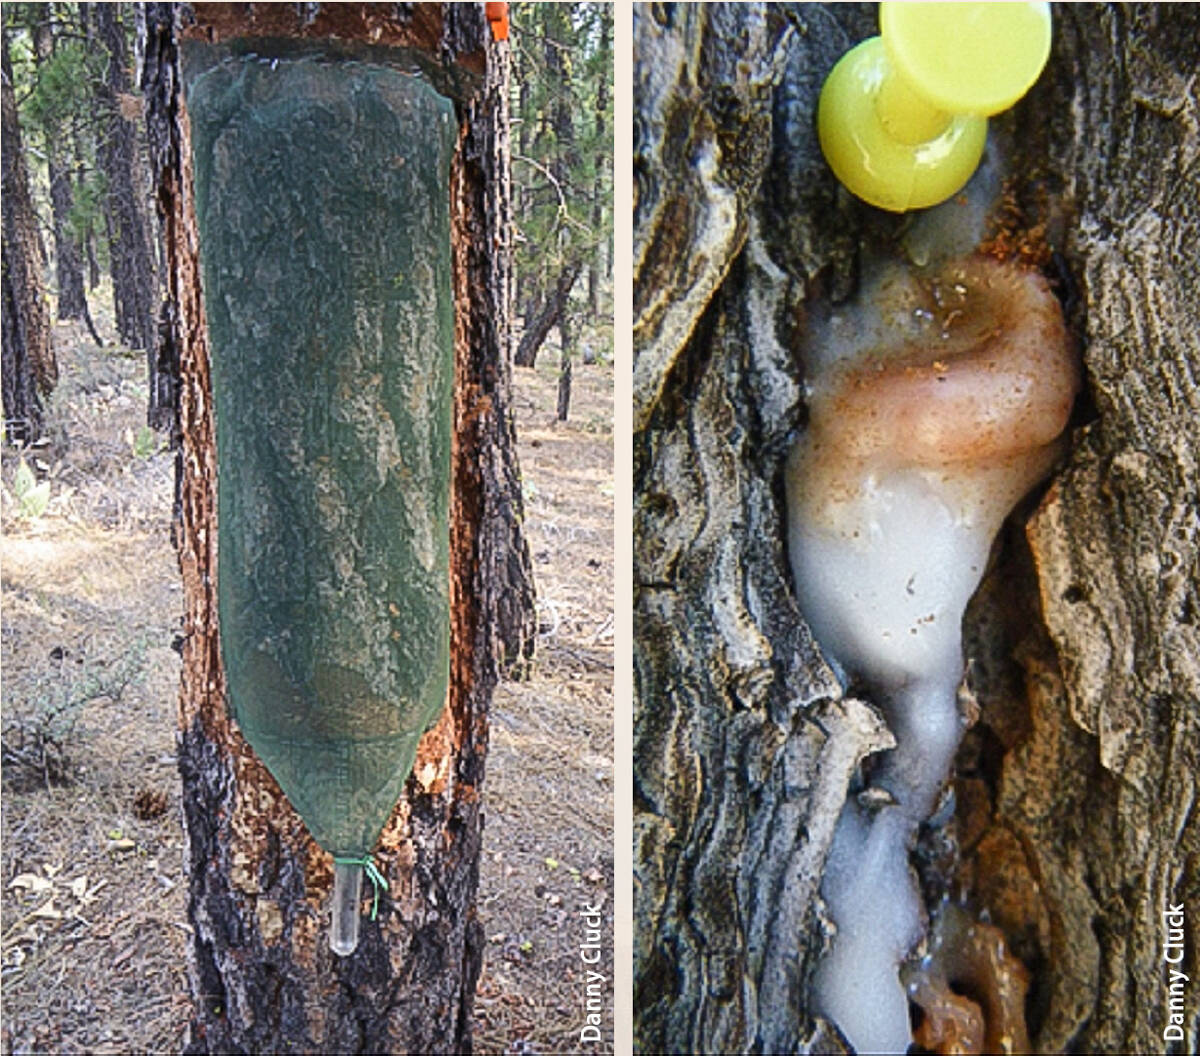
In the Lassen National Forest, western pine beetle emergence and new attacks were monitored weekly. A screen attached to a ponderosa pine, left, helps determine the timing and number of emerging beetles. A pin near a pitch tube, right, marks an attack since the previous monitoring period.
UC Berkeley, UC ANR biomass harvesting study
Carmen Tubbesing and colleagues
Mapping standing dead tree biomass with remote-sensing technology, determining how much of it could be feasibly harvested for energy, estimating harvesting and transporting costs.
-
Estimated 23.6 to 86.3 million metric tonnes of aboveground tree biomass died 2012–2017, peak in 2016.
-
82% to 85% of mortality in 10 counties.
-
More- and less-feasible areas for biomass harvest characterized based on slope, geographic isolation, average volume per tree, wilderness/National Park status.
-
29% of standing dead biomass (6.9 to 25.3 million metric tonnes) “more” feasible for harvest.
-
Biomass tool (fig. 4): http://geodata.ucanr.edu/biomass/ .

FIG. 4. Collaborating with UC ANR's Informatics and GIS Program (IGIS), Tubbesing and colleagues developed a web tool for site-based biomass estimates. Users can access results by area of interest, from state, to county (shown), or a smaller area drawn on the screen.
The next step is to estimate harvest and transportation costs statewide, using an approximation of the Fuel Reduction Cost Simulator (FRCS) and Google Maps road data.
U.S. Forest Service Region 5 Remote Sensing Lab, UC Davis Center for Spatial Technologies and Remote Sensing (CSTARS) eDaRT development
Carlos Ramirez, Michèle Slaton and Alexander Koltunov
Developed eDaRT (Ecosystem Disturbance and Recovery Tracker) to generate forest disturbance maps and provide customized data products and information services to forest managers, ecologists and wildlife biologists (fig. 5).
-
High accuracy and superior spatial and temporal resolutions of maps.
-
Refined correlative relationships among disturbances and processes, such as fire, forest thinning and tree mortality.
-
Sierra Nevada–wide estimates of forest change due to tree mortality.
-
Fine-scale change detection that facilitates project-level restoration planning and monitoring.
-
2% statewide loss in whitebark pine (Pinus albicaulis), a candidate for U.S. Endangered Species Act.
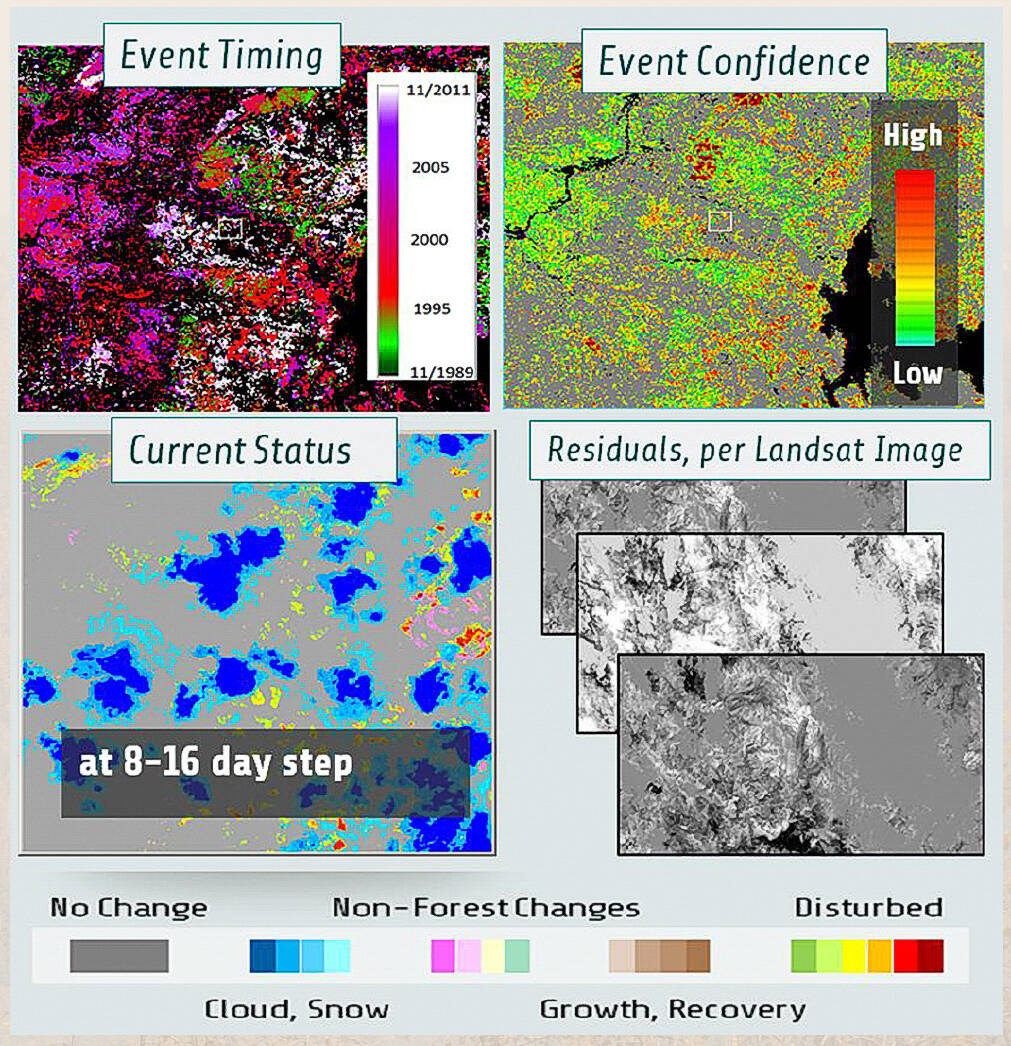
FIG. 5. eDaRT algorithm processes Landsat images at 16-day step and detects disturbance status snapshots and disturbance events (timing and confidence). Additional metrics of disturbance impacts include estimated relative change in vegetation cover, greenness and moisture content. More information at www.cstarsd3s.ucdavis.edu/systems#a-sys-drt .
Researchers will characterize forest disturbance by type (e.g., mortality, fire, harvest), improve disturbance magnitude metrics, reformat and deploy the system for near–real time operation, incorporate imagery from satellites other than Landsat, expand product validation efforts, and other developments.
The California Tree Mortality Data Collection Network — Enhanced communication and collaboration among scientists and stakeholders

