


All Issues
Three new Phytophthora detection methods, including training dogs to sniff out the pathogen, prove reliable
Publication Information
California Agriculture 72(4):217-225. https://doi.org/10.3733/ca.2018a0026
Published online December 17, 2018
Abstract
Multiple species of Phytophthora have been identified in production facilities of plants used in reforestation and restoration projects. There's a risk that infected plant stock will lead to Phytophthora species establishing and spreading in habitats that, having never experienced their presence, may be highly susceptible to infection. Eradication of these pathogens, once introduced into wildlands, is impossible. Thus, monitoring nursery stock is key, but sampling large production lots is still prohibitively complex and expensive. We tested three new sampling approaches that are practical for large production lots: baiting of small portions of symptomatic plant material pooled from multiple samples in addition to whole plant sampling; baiting of bench irrigation leachate; and training dogs to identify the pathogens. The first two methods detected Phytophthora with a high confidence level directly from batches of plants, but they are not designed to identify each infected plant specifically. Trained dogs identified individual batches of soil and water containing Phytophthora with a 100% accuracy and the research is continuing, to see if dogs can recognize the pathogen from individual infected plants and plant parts and discriminate its smell from other scents.
Full text
The introduction of microbial plant pathogens into natural ecosystems via contaminated stock has been observed multiple times (Geils et al. 2010; Grunwald et al. 2012; Jung and Blaschke 2004; Santini et al. 2013). Recently, it occurred in California, when Phytophthora-infected plant stock was used in restoration projects (Rooney-Latham et al. 2015).
The consequences are significant, particularly because many Phytophthora species are generalists and, as such, can easily “jump” across multiple hosts, potentially decimating those that are most susceptible (Garbelotto et al. 2018). The resulting plant mortality can erode the suitability of habitats for wildlife and other plants or for symbiotic organisms, resulting in cascading systemwide effects (Frankel et al. 2018). Infected stock may be distributed across a great area; the number of restoration projects in California is exceedingly large and a count is virtually impossible. For example, hundreds of restoration projects exist just in wetlands in the San Francisco Bay Area ( http://ca.audubon.org/conservation/restoration-projects ). Likewise, we estimate there are over one hundred plant production facilities in California that provide plant stock for restoration efforts.
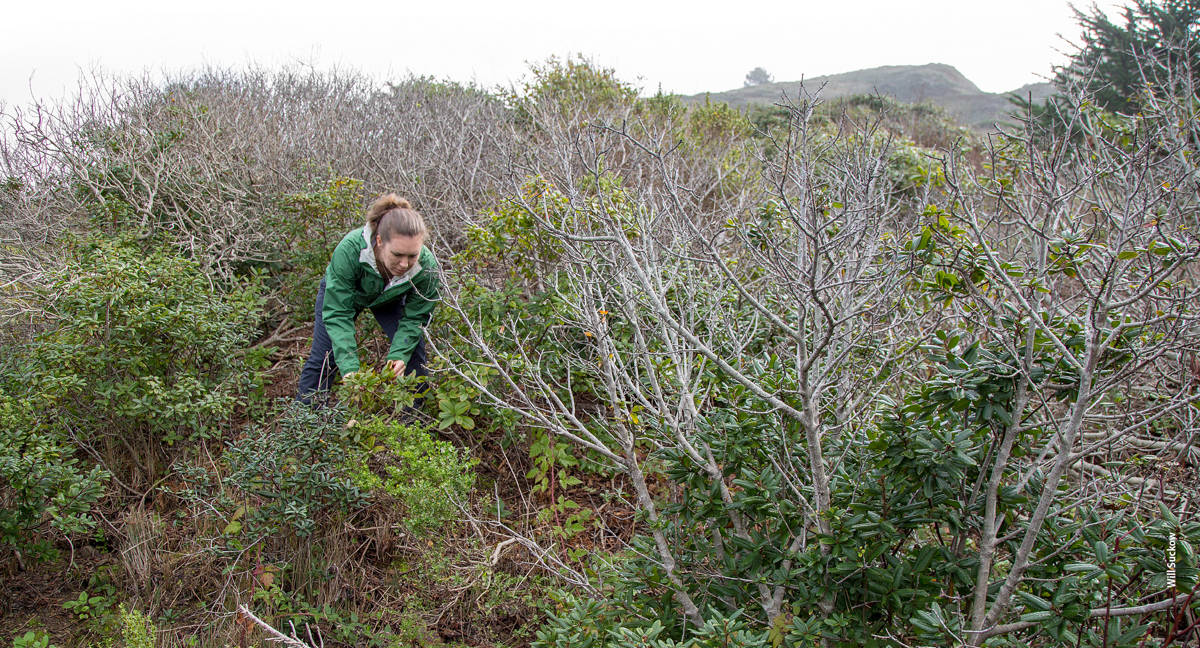
Co-author Laura Sims examines coffeeberry (Frangula californica) infected by Phytophthora introduced by nursery stock at a restoration area on Mori Point, Pacifica, in San Mateo County. The dead branches of coffeeberry in the foreground and background were killed by Phytophthora.
The problem of Phytophthora in plant production facilities has been compounded by several factors: asymptomatic infections (Osterbauer et al. 2004), the inability to correctly identify species due to a recent increase in the number of species (Kroon et al. 2012) and the use of chemicals that mask the infection without effectively eliminating the pathogens (Shishkoff 2014).
Molecular techniques have greatly enhanced the ability to correctly diagnose Phytophthora species (see Martin et al. 2012), and they have become cost effective for diagnosis at the species level on infected plants. The biggest hurdle is how to identify infected plants in large production lots, and how to adequately sample plant production facilities, many of which include large numbers of possible plant hosts.
Monitoring nursery stock to detect introduced pathogens is a key component of clean nursery production practices. To produce plants free of Phytophthora root rots to the maximum degree possible, a nursery needs to detect low levels of infection reliably. Any lapse in phytosanitary procedures must be identified and corrected quickly, so an infected plant can be quarantined to prevent disease spread in the nursery. And yet Phytophthora-infected plants may not show obvious symptoms in the canopy until root rot is severe, so visual inspection alone may not allow a nursery to catch an infestation at an early stage. To be practical, Phytophthora detection methods need to be relatively inexpensive and simple to carry out.
Our research studies in California have focused on different approaches to sampling for Phytophthora. The first study (Sims and Garbelotto) described and tested an assay approach in which portions of plants were collected and pooled to detect infection, and also included sampling from whole plants. The second study (Swiecki and Bernhardt) focused on a completely nondestructive detection method that tested irrigation water draining from plants. The third (Quinn, Oliver, Popenuck and Garbelotto) trained dogs to identify Phytophthora inoculum based on olfactory detection. For all three studies, this is the first published report on their outcomes, and, as such, its conclusions should be regarded as preliminary.
Detecting Phytophthora in root samples
In 2015, workers at the Presidio Native Plant Nursery (San Francisco, Calif.) noticed symptoms of severe and widespread root disease in a crop of blueblossom (Ceanothus thyrsiflorus), a common woody California native species. We capitalized on the availability of this infected blueblossom crop to perform this study. Our goal was to identify as many Phytophthora species as possible.
First, we evaluated the crop's actual infection level, commonly referred to as disease incidence value, caused by any combination of Phytophthora species. Then, we used the actual disease incidence values to calculate the minimum number of samples needed to detect the pathogen with a 95% confidence level using two sampling techniques (whole plant versus a composite of plant parts, see below). Finally, we created five sampling scenarios, using a combination of the two techniques, and estimated costs associated with each scenario.
Knowing the disease incidence of a crop and the detection rate of any given sampling technique are two essential pieces of information when attempting to design cost-effective sampling strategies. Disease incidence (DI) refers to the proportion of a lot that is infected and is a metric that will be positively correlated with the likelihood of discovering that any given production lot is infected. The detection rate (DR) is the proportion of infected plants that will test positive when measured by a specific methodology. In simple terms, the diagnostic effectiveness (DE) will be given by DE = DR/DI. A valuable assay necessarily needs to have a DE > 1.
Whole plant sampling is an intuitive and destructive sampling approach. Composite sampling combines small samples of roots and soil from multiple plants (25 in our case) into one sample, in a way not destructive to plants. Composite samples change the detection rate by improving it, and save money in lab processing fees by reducing the number of samples needed.
Calculating Phytophthora detection rate for a crop with a given disease incidence
There were 400 obviously symptomatic plants in a crop of 1,000 blueblossom plants. These were separated from the asymptomatic 600 and used to determine both the disease incidence and the detection rate as described below. Symptomatic plants were grouped by random selection into five blocks of 80 plants each, and Phytophthora was identified from each block following the standard techniques outlined below.
A total of 125 plants (25 plants selected randomly per block) were destructively sampled by baiting the entire plant. Baiting was performed as follows: Deionized water was added until it reached approximately 1 inch above the top of the sample; baits made of hard green pear fruit were submerged in the water over the soil and incubated for 5 to 7 days at a cool room temperature (18°C to 24°C), and moved to cold storage if temperatures exceeded this for several hours (Sims et al. 2015).
Each sample was baited separately, including control samples. Lesions on baits were plated on a Phytophthora-selective medium, kept at 18°C and identified using standard identification techniques at 3, 7 and 10 days after plating (Sims et al. 2015). Control baits were always negative. Cultures from positive baits were set aside for DNA extraction and storage. DNA was extracted using the Qiagen DNeasy Plant Mini Kit, PCR amplified using ITS (internal transcribed spacer) primers ITS4 (White et al. 1990) and DC6 (Cooke et al. 1999) and standard PCR settings (Sims et al. 2015). The amplified product was then sequenced and compared to published sequences in the GenBank database to determine species-level identification.
The overall disease incidence was calculated based on the baiting results from the 125 whole plant samples. The infection rate value was then used in power equations (Crawley 2007) to determine the smallest number of individual plant samples, n1, that would be necessary to make the probability of missing the Phytophthora altogether less than 0.05 (5%), by solving:
0.05 = (1 − infection rate)n1 (1)
Taking the logs,
log (0.05) = n1 log (1 − infection rate)
Therefore
n1 = log (0.05) / log (1 − infection rate) = minimum acceptable sample size
To test the composite sampling technique, 25 plants from each block were selected at random and a small sample of roots and soil from each container was combined into a single composite sample. Phytophthora was identified from each composite sample following standard techniques (outlined above), and then the detection rate was determined. Finally, the detection rate was used, in the same way the disease incidence was used, to determine the smallest sample needed, n2, to be 95% certain that the Phytophthora was captured. This result was achieved by solving:
0.05 = (1 − detection rate)n2 (2)
Taking the logs,
log (0.05) = n2 log (1 − detection rate)
Therefore
n2 = log (0.05) / log (1 − detection rate) = minimum acceptable sample size
Hybrid approaches and five sampling scenarios are presented; these were calculated using the sample density equation dbinom, using a saddle point algorithm for the greatest accuracy in the calculation of binomial probabilities (Loader 2000). All analyses were done using the R computing environment (R Development Core Team 2017).
Finally, rather than having a fixed disease incidence, we asked how the confidence level would change with varying infection levels. This was computed by solving equations 1 and 2, above, for the probability of missing Phytophthora.
Validation of the assays
Table 1 summarizes the calculated disease incidence and sample size necessary to detect the infection with a 95% confidence level. Whole plant sampling across all five blocks determined that the crop's infection rate was 28%. A minimum of 10 whole plant samples or four composite samples (if a composite includes portions from 25 plants) are necessary to detect the infection at this confidence level and infection rate.
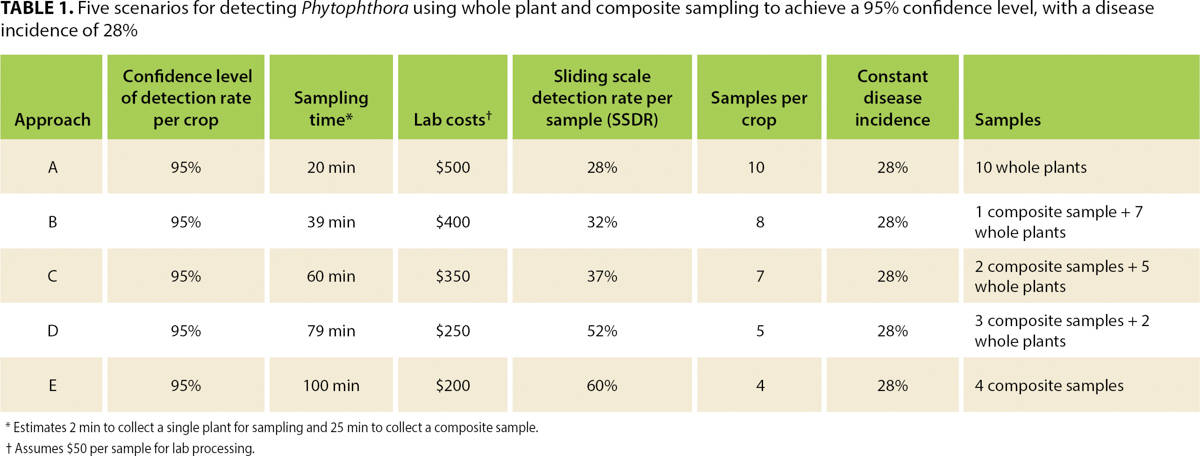
TABLE 1. Five scenarios for detecting Phytophthora using whole plant and composite sampling to achieve a 95% confidence level, with a disease incidence of 28%
Scenarios with a combination of whole plant and composite samples were also calculated to achieve the same 95% confidence level of detection probability. The same statistical confidence is achieved using different sample sizes because the detection rate per sample varies on a sliding scale in different scenarios (sliding scale average detection rate per sample, or SSDR; see table 1). Finally, costs were computed (table 1) for each sampling scenario, to provide an additional parameter for selecting the most appropriate one.
When disease incidence changes, so does the statistical confidence of these sampling scenarios. Of course, if disease incidence is higher than 28%, then confidence of the sampling approaches increases, but if it is 20%, for example, confidence becomes too low (80%) and the scale of the sampling would need to be increased to achieve the necessary 95% confidence level (see table 2).
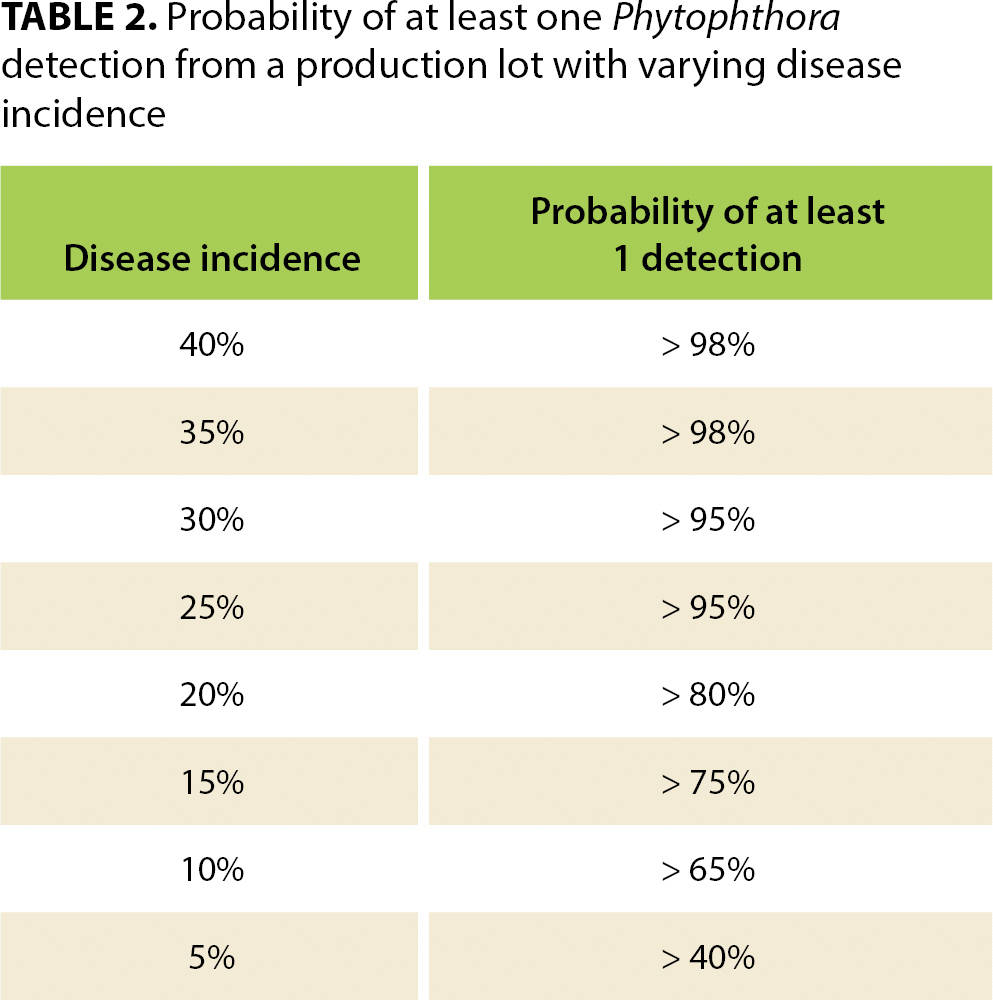
TABLE 2. Probability of at least one Phytophthora detection from a production lot with varying disease incidence
Collecting the samples
In a production facility, collecting the samples consists of the following steps. First, determine whether disease symptoms are aggregated in groups of symptomatic plants or are scattered randomly. If symptoms are aggregated in clusters, count the number and determine the location of each cluster, to ensure all clusters are sampled equally. Mark plants with any visible symptoms, collect these plants and place them together in a single area of the production facility. Then, once gathered, generate a randomized list (with plant tag numbers) to select plants for sampling. Tag each plant with a unique tag number, sampling evenly across the strata if aggregated. Designate the first plants on your list for whole plant sampling, and the second set for composite sampling, again ensuring sampling across strata if necessary.
All plants used for samples should be fully developed so that roots reach the outer portion of containers. For each sample, place roots and soil in a single leak-proof 1-gallon bag. Label each bag with a unique identifier that tracks it back to the original plants and notes associated with the sample and crop. After preparing each sample, add deionized water to 1 inch above the sample line and add washed unripe pear bait.
Plants selected for whole plant sampling should be grouped together. Remove each plant from its container to expose the root system. Include portions of the primary root ball and of the soil from all areas within the container, until you have reached a total sample of soil and roots of approximately 2 liters. Be sure to include samples of degraded roots from all areas within the container. When done, place the whole sample in a leak-proof 1-gallon bag.
Plants selected for composite sampling also should be grouped together. Use a Scoopula to remove 2 tablespoons of roots and soil along a lateral gradient from the upper to lower portion of the container at the container edge of each selected plant, from two opposite sides. In between each plant, wipe your tool with 70% alcohol. Place sample roots and soil in a bag and mix, and then the sample is ready for baiting.
Detecting Phytophthora in leachate
Phytophthora infections can be identified by detecting swimming zoospores released from infected roots into bench leachate. This identification method takes advantage of two well-established facts. First, irrigation runoff from Phytophthora-infected plants carries zoospores that are detectable by baiting (MacDonald et al. 1994). Second, zoospores tend to swim upward in a water column (Erwin and Ribeiro 1996), a phenomenon known as negative geotaxis (movement in the opposite direction of gravity), which helps concentrate zoospores from large volumes of leachate.
Phytophthora spreads very efficiently in nurseries, so it is important that an infection is detected quickly; once the pathogen is detected, the entire block of plants must be quarantined or disposed of. The bench leachate test is a quick test; a block of many plants can be tested at once, rather than requiring multiple individual plant tests. The test also potentially detects infection anywhere within the root systems of plants in a block, rather than from a targeted sample of root tissue from a selected set of symptomatic plants. Plants can be tested in place on a nursery bench or moved to a cart or another bench for testing.
Conditions for a sensitive test
The test depends on Phytophthora sporangia being present in the plant root systems or potting media and releasing zoospores during the test period. To maximize test sensitivity, conditions before the test need to be favorable for sporangia production and for zoospore release and motility.
Prior to testing, plants should be irrigated regularly, because viable sporangia may not be present if plants have been dry for an extended period. This precondition is typically met in most nurseries. Testing should also be conducted when average soil temperatures have been in the range of 65°F to 75°F (18°C to 24°C) for at least 3 days, preferably a week or more. These temperatures are favorable for growth and sporangium production in a wide range of Phytophthora species (Erwin and Ribeiro 1996).
It is possible to detect some Phytophthora species at temperatures outside of this temperature range, but our studies (data not shown) indicate that some species are less likely to be detected if soil temperatures are well above or below this range. For the same reason, the temperature of irrigation water applied during the test should be between 50°F (10°C) and 77°F (25°C). Unless plants are grown in controlled environments such as greenhouses, testing should be scheduled to avoid overly hot or cold conditions.
Conducting the leachate test
A collection system is placed beneath a mesh bench containing the plants to be tested. During irrigation, leachate from the bottom of plant containers is directed into a zoospore collection vessel (ZCV). As the ZCV fills, water drains from the lower-middle portion of it rather than overflowing at the top, which would result in loss of upward-swimming zoospores. The vessel also captures debris, which floats or settles to the bottom of the vessel and may contain sporangia.
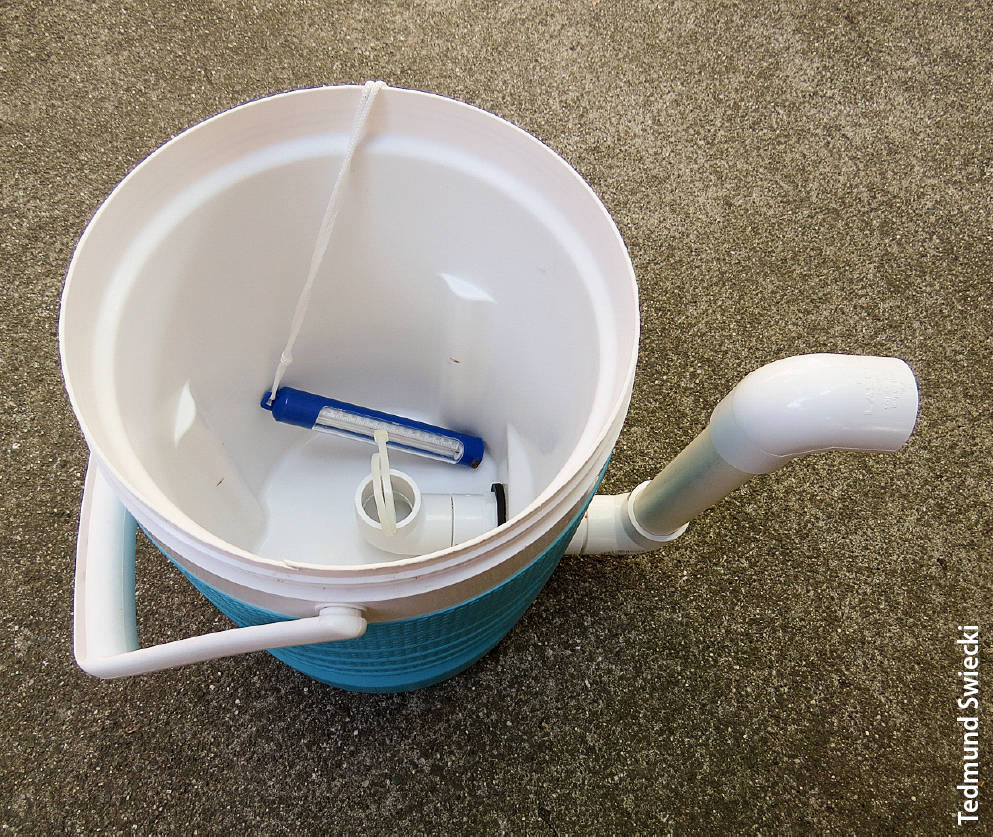
Zoospore collection vessel used in the leachate detection study. The drain is 2.75 inches (7 centimeters) above the bottom; the water outflow (upper pipe elbow outside of vessel) is situated to maintain the water level about 2.5 inches (6 centimeters) below the rim. Vessel depth is 12 inches (30 centimeters). A pool thermometer (shown) or similar can be used to monitor water temperatures during the test.
Green pears are used as detection bait. Green pears are readily available year-round and can be infected by a wide variety of Phytophthora species. If unwounded, they are also highly selective for Phytophthora species, which commonly induce distinctive lesions. Most pears float at the water surface, where they attract motile Phytophthora zoospores. For the occasional nonfloating pear, a pear floatation device can be made by using a rubber band to attach a small piece of closed-cell foam.
At the start of the test, a green pear is placed into the ZCV, which is situated to receive the irrigation leachate channeled by the collection system. Plants are individually irrigated six times at 15-minute intervals, using low pressure to avoid splash. Applied irrigation should not overflow the container rim but should be sufficient to cause water to leach from the bottom of each container. Approximately equal amounts of water should be applied to each container. For #1 containers, the amount applied at each irrigation should be about 22 fluid ounces (650 milliliters); larger containers will take more and smaller ones less water at each irrigation. The irrigation regime is based on experiments showing that few if any zoospores are detected in leachate from the first two irrigations but are readily detected in leachate from irrigations 3 through 6 (table 3).
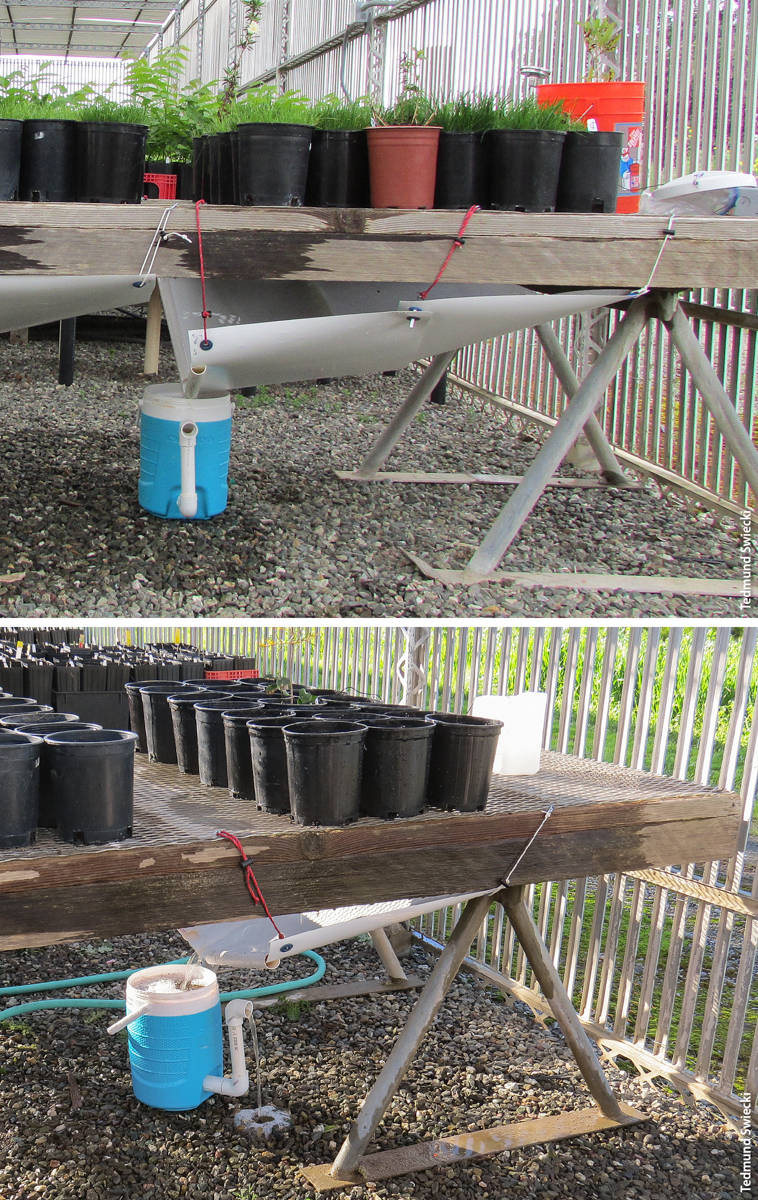
Leachate collection systems and zoospore collection vessels under arrays of 42, top, and 21, bottom, #1 container plants. Each array contains one known Phytophthora-infected plant. Remaining pots are filled with pasteurized potting media (seeded with turfgrass, top).
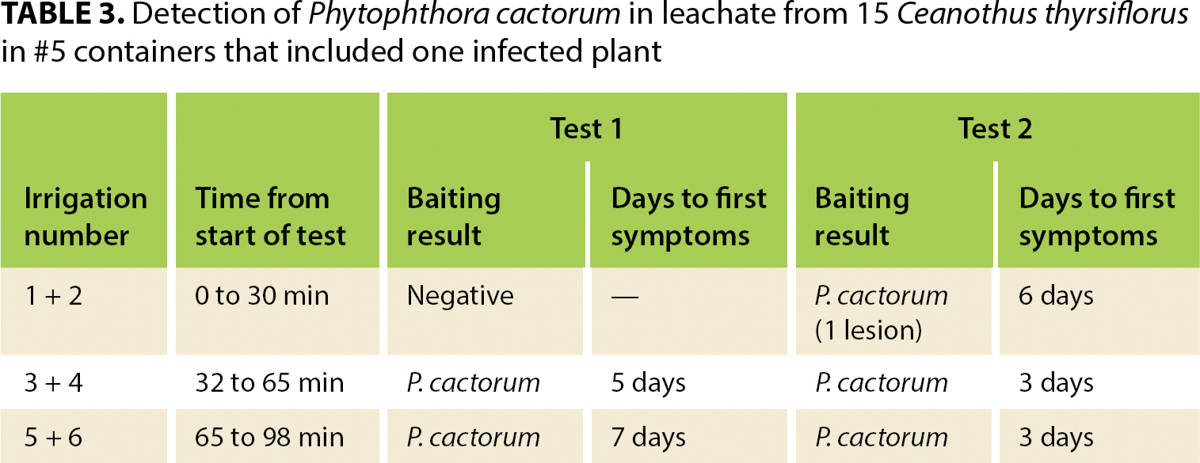
TABLE 3. Detection of Phytophthora cactorum in leachate from 15 Ceanothus thyrsiflorus in #5 containers that included one infected plant
Fifteen minutes after the sixth irrigation (about 90 minutes after the first irrigation), the pear is transferred to a heavy-duty 1-gallon zip-closure plastic bag supported in a container. Water in the ZCV is drained from the center of the water column until 2.9 quarts (or about 2.7 liters) remain; the amount shown is precise because this appears to be the maximum amount of water that will fit without spillage in the 1-gallon bag used for incubation. This remaining water, which typically includes container mix and other particles that have settled to the bottom, is then transferred into the zip-closure plastic bag with the bait. The pear remains floating in this water for 3 more days at moderate temperatures (65°F to 75°F, 18°C to 24°C). At that point, pears are removed from the water and placed onto clean paper towels for up to an additional 5 days of observation.
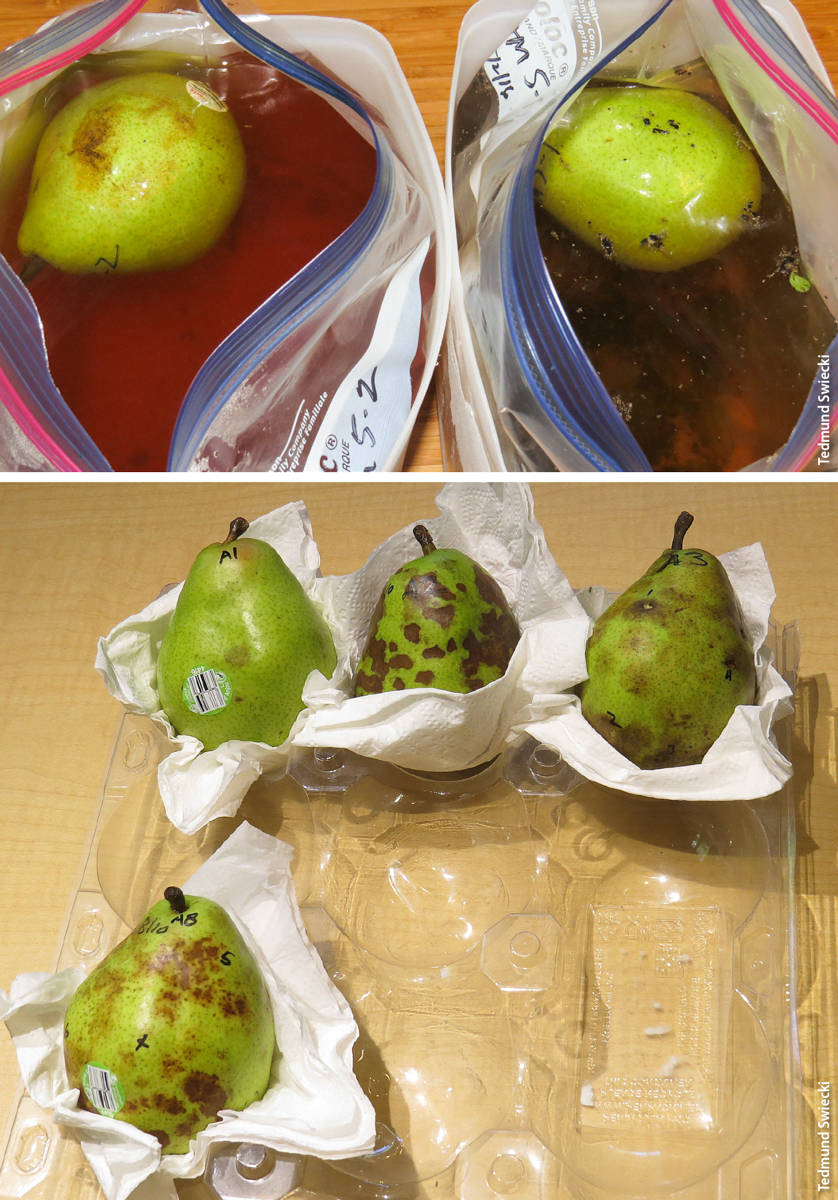
Pear baits during incubation in the leachate study, 3 days from test, top, and 1 day after removal from leachate, bottom. Pear at left in top image shows brown lesions caused by Phytophthora cactorum infections; pear at right has no Phytophthora symptoms. Bottom image shows a range of Phytophthora symptoms in pears, from a single spot (upper left) to extensive infections.
Our studies (data not shown) indicate that infection of the pear bait can occur in the first 90 minutes of the test (while the pear is in the ZCV) and in the following 3-day baiting period, so both parts of the test can contribute to a Phytophthora detection. Symptoms may develop on the pear bait in as little as 2 days after the test or may take as long as 5 days after the pear has been removed from the water (8 days after leaching). Culturing pieces from the pear lesions can be used to confirm Phytophthora detection and obtain a species identification. A detailed description of the protocol and equipment used is available at http://phytosphere.com/BMPsnursery/test3_4bench.htm .
Sensitivity of leachate test
We conducted a series of experiments to assess the sensitivity of this protocol. Into an array of containers with noninfected plants or containers with only pasteurized potting media, we placed one or two Phytophthora-infected plants. Phytophthora was detected when infected plants made up no more than about 6% of the array. Phytophthora cactorum was consistently (eight times in eight tests) detected from an array of 15 Ceanothus thyrsiflorus in #5 (3.8-gallon, 14.5-liter) containers with one infected plant. P. niederhauserii was detected in three of three tests from an array of 42 #1 (0.75-gallon, 2.8-liter) containers that included a single infected Juniperus sabina ‘Tamariscifolia’; the total irrigation volume for that test array was about 43 gallons (164 liters).
In other tests conducted at soil temperatures of 62°F (17°C) or less, which is below the recommended minimum, detection of several different Phytophthora species was inconsistent. Phytophthora was detected in five of nine tests in arrays with 5% infected plants and in one of four tests in arrays with 2% infected plants. Most of the Phytophthora source plants in these studies were recently transplanted and were smaller than typical for #1 container stock. Hence, inoculum would be more diluted, probably by a factor of three or more, beyond what was expected based on the infected plant percentage.
Results from these and other studies suggest that the minimum threshold for detection can vary based on the species of Phytophthora present, temperatures of irrigation water and soil, and condition of the Phytophthora source plants. Additional studies are under way to assess how these and other factors influence detection efficiency and whether the protocol can be modified to minimize these influences.
To date, we have used the test protocol in multiple nurseries under various temperature conditions and have detected nine Phytophthora species in nursery stock from a range of plant species and container sizes. Results from these tests have enabled land managers to identify and prevent the planting of Phytophthora-infected material into native habitats. Several habitat restoration nurseries have implemented this protocol for testing stock they are producing for habitat restoration plantings.
Although we have detected Phytophthora in plant batches of up to 200 small containers (Deepot D40, 0.17 gallon, 0.66 liter), we suggest limiting the number of containers in a test batch to about 40 until more data from controlled sensitivity tests is available. Test sensitivity can be maximized by selecting the most symptomatic plants in a batch, rather than random sampling. Plants should be tested when they are well established within a given container size, before rather than after they are moved into larger containers. This test does not produce false positives, but false negatives are possible. Repeated testing can provide greater confidence in negative results.
Detecting Phytophthora by smell
The UC Berkeley Forest Pathology and Mycology Lab teamed with H. T. Harvey & Associates to determine if it is possible to train ecological scent detection dogs to survey for the presence of Phytophthora. Although the research is scant, there are a few examples of dogs being successfully employed to detect plant pathogens (see Eckhardt and Steury 2012; Woollett et al. 2012). If dogs could detect Phytophthora, it would allow for more immediate confirmation of the pathogen than is available using current detection methods.
The team developed a Phytophthora detection dog pilot study, which includes a two-phase training approach, starting with a single dog (starting with one animal is the standard practice in the industry). The first phase of the scent recognition training focuses on teaching the dog to recognize Phytophthora odor in a range of media. The dog-handler team is introduced to two aqueous mixtures, potting soil and locally collected forest soil. We test the ability of the dog to detect four species of Phytophthora in those four media. Next, we test whether the dog can detect the same four species in an infected plant or plant parts (i.e., leaves and roots).
If that is successful, we commence the second phase, which is the scent discrimination phase. That involves conducting experimental trials in which targets and nontargets are manipulated to test the dog-handler team's ability to discriminate the scent of Phytophthora species from co-occurring and distracting scents.
Preparing the Phytophthora targets
All training and trials were conducted in the Phytophthora quarantine lab at the Forest Pathology and Mycology Lab in 2017. Phytophthora species were cultured in pea broth media designed to facilitate sporulation and were handled and stored by qualified lab staff members using Phytophthora quarantine procedures. All samples were handled using latex or sterile nitrile gloves and placed into a secured container with a ventilated lid. Two different types of containers were used during this study: PVC tubes placed over a ventilated container and glass mason jars with wire mesh lids. They were designed to allow the target's scent to be released while preventing the dog from touching the sample.
Four Phytophthora species were used for this study: two airborne species, P. nemorosa and P. ramorum, and two soilborne species, P. cactorum and P. cinnamomi. Each species was grown in standard pea broth (Erwin and Ribeiro 1996), by placing three disks, 15/64 inches (6 millimeters) in diameter, in 12-well cell culture plates containing 5 milliliters of pea broth, and placing the plates in an 18°C incubator for 5 days. This inoculum preparation protocol resulted in the production of mycelium, sporangia and chlamydospores for all four species, and possibly in the production of oospores for the homothallic (i.e., self-fertile) P. cactorum and P. nemorosa. For each trial, different media were amended with three 30-cubic-millimeter samples of the inoculum of each species.
Training the dog to the scent
Initial training was conducted using the inoculum of each target Phytophthora species simply absorbed onto filter paper, to offer the dog the purest scent of Phytophthora possible. The dog was then exposed to Phytophthora inoculum placed in potting mix commonly used in commercial nurseries, in forest soil collected under California coast live oak (Quercus agrifolia) in Lafayette, California, in a mixture of soil and water and, finally, in a combination of the original pea broth used for the growth of the inoculum and the soil-water mixture.
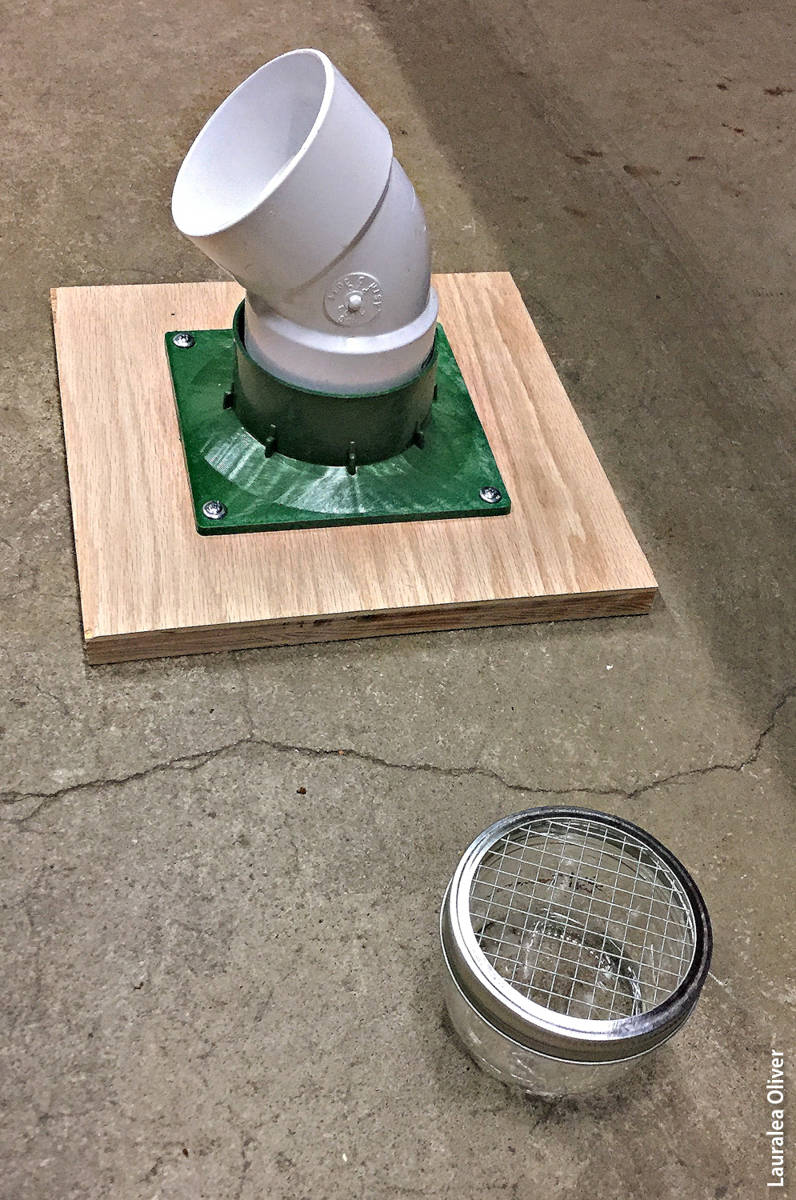
The two types of containers used to hold Phytophthora during the training of the scent detection dog.
Container drills were used to teach the dog to associate the target odor with a play or food reward. The dog was led along a row of eight identical ventilated plastic containers. Four of the containers held Phytophthora species in one of the four media, and the others were control containers (identical containers that held the same medium but without the Phytophthora inoculum). When the dog sniffed the container with the target odor, she was rewarded immediately.
This exercise was repeated until the dog displayed anticipatory behavior when she smelled the target odor. Anticipatory, or “alert,” behavior varies among dogs but often includes a sudden change in direction of movement or a change in posture, combined with focused attention toward the handler in anticipation of the reward. This behavior demonstrates to the handler that the dog associates the target odor with the reward, after which the dog is ready to be tested on her ability to consistently recognize the target scent.
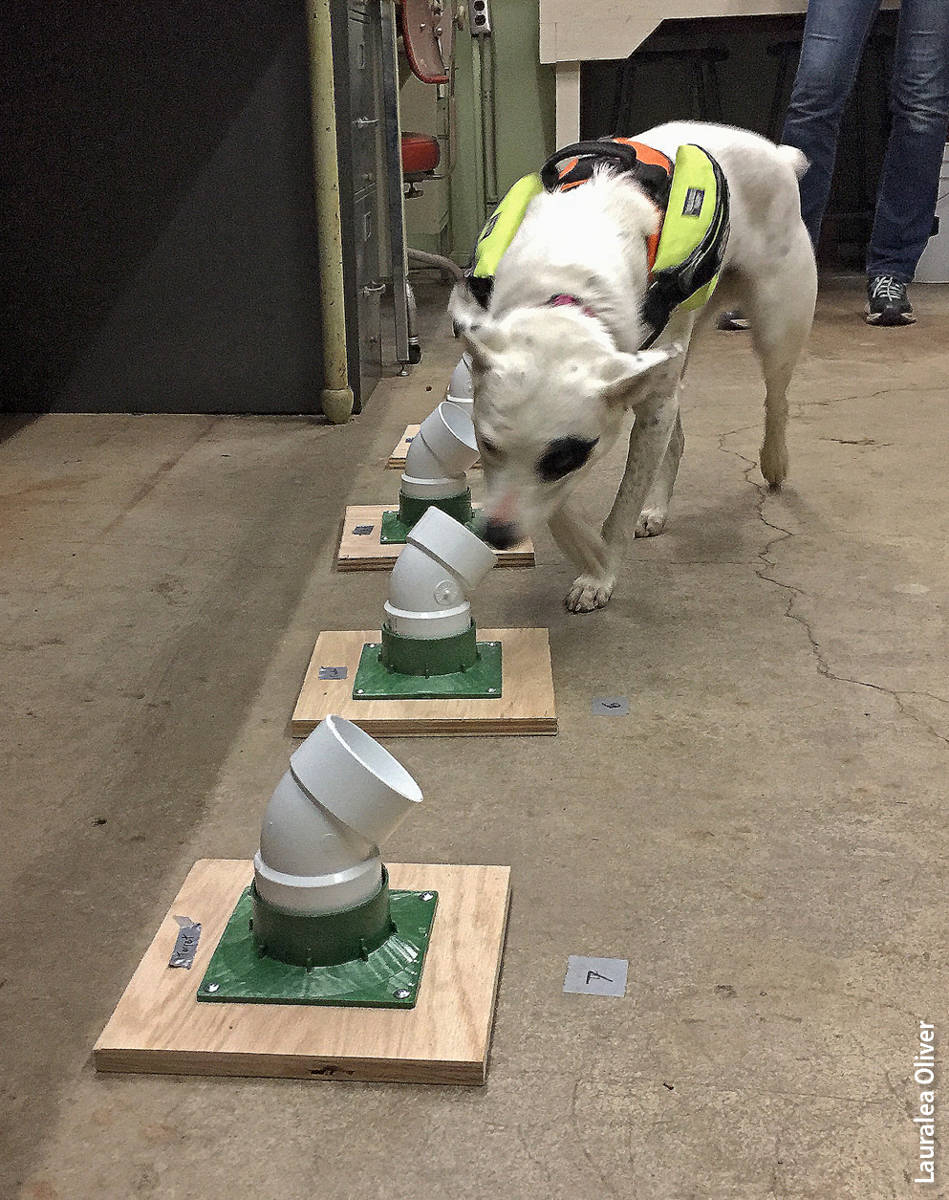
Imprinting the odor of Phytophthora using a container drill.
After the dog displayed recognition of the target odor, a scent recognition test was performed in which the dog-handler team was required to successfully indicate one target container randomly placed in a linear arrangement with seven control containers. The handler was unaware of the placement of the target container. The dog-handler team was required to successfully complete 10 consecutive target detection trials to move on to the next species and medium.
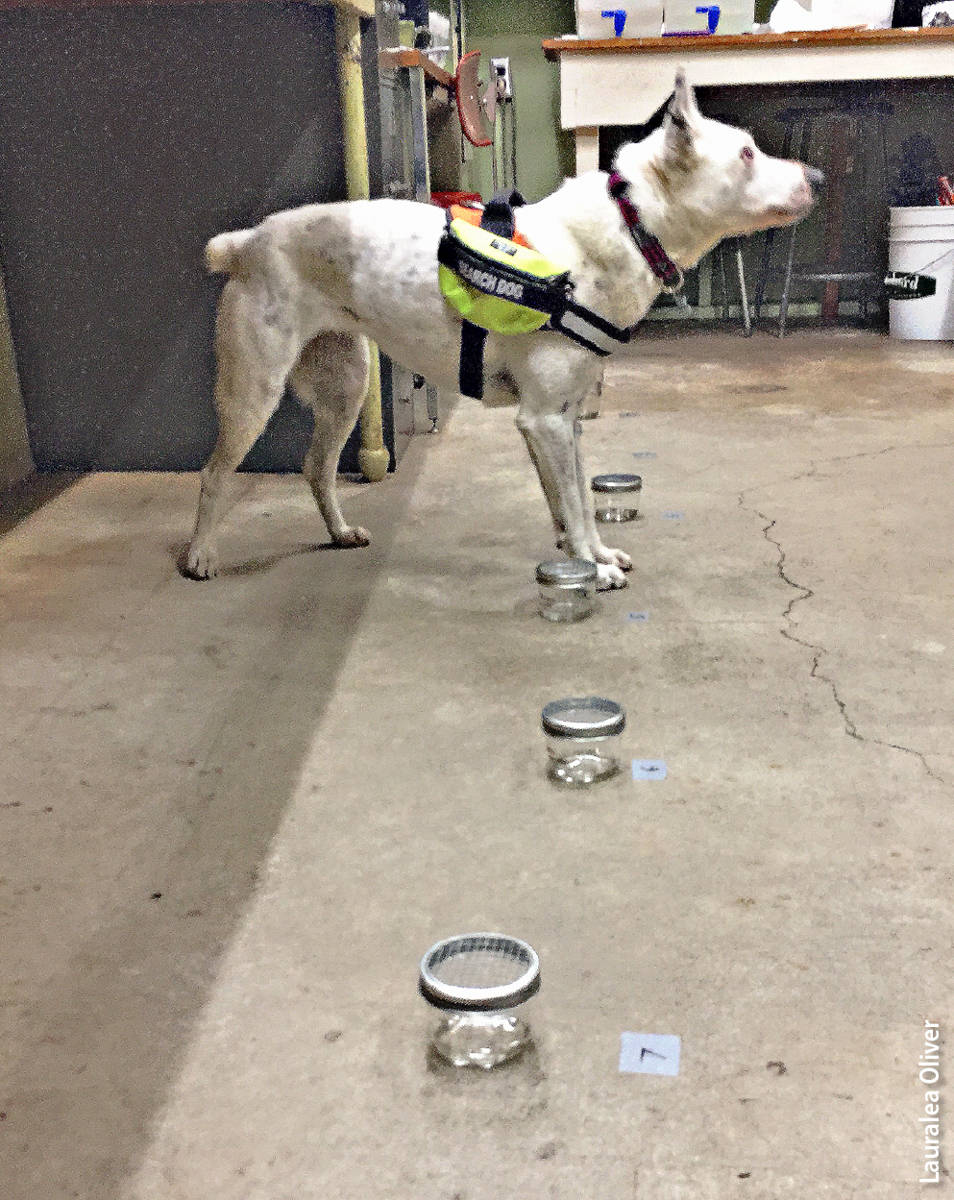
Detection dog displaying anticipatory, or alert, behavior at the one container that contained Phytophthora.
Validation of the assays
The dog-handler team began training in the lab Feb. 2 and performed its first tests Feb. 16. Training and testing continued until March 9. A total of 16 tests were performed (four Phytophthora species in four media) (table 4). The team passed each test on its first attempt, achieving a positive alert only to the target container in each of 10 trials.
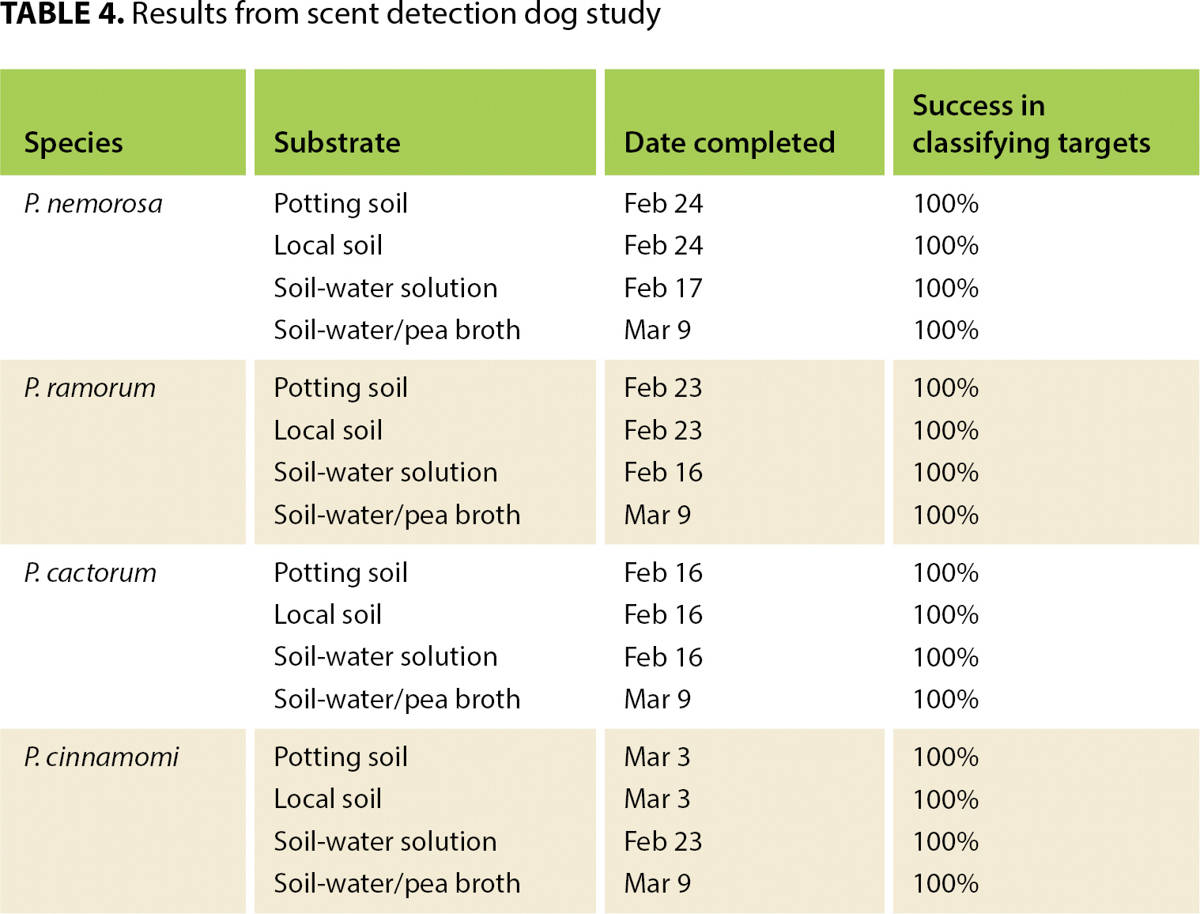
Results from the study so far suggest that ecological scent detection dogs may offer an innovative and reliable method to survey for Phytophthora in a variety of settings. Target recognition remained strong even when the shape and size of the containers were manipulated and the quantities of the pathogen varied. The dog excelled at communicating the locations of the pathogens to the handler, demonstrating a 100% detection rate.
Results to date engender confidence that detection dogs may offer an efficient and effective alternative or complementary technique to detect Phytophthora. Current detection techniques require various laboratory tests to confirm presence and identity, and ecological scent detection dogs could possibly be used in place of some lab tests. Dogs could offer a rapid way to reliably detect the pathogen in a variety of controlled environments, such as nurseries; to prescreen plants before they are installed at habitat restoration sites; and possibly to identify infected naturally occurring plants and soil in the field.
The next part of the scent recognition training phase will be to transition the dog to recognize Phytophthora-infected plants and plant parts. Infected rhododendron leaves and live plants with infected roots will be presented to the dog in the lab to assess her ability to detect Phytophthora in these living materials. Undoubtedly these tests will be more challenging due to a broader range of confounding factors.
Following completion of the scent recognition phase, the objective is to quickly progress to phase 2, the scent discrimination training. We will test the dog's ability to discriminate harmful Phytophthora species from co-occurring and distracting scents, including common related water molds, such as Pythium species.
Future directions
The studies presented here provide proof of concept on the potential of three distinct approaches to detect Phytophthora in production facilities with minimal destructive sampling of nursery stock. All three approaches are suitable for large production facilities specializing in the production of plant stock for restoration because they help to minimize sampling costs and plant damage while achieving measurable and often high detection levels.
The composite sampling approach validated in this study capitalizes on the presence of symptomatic plants to detect Phytophthora (Hayden et al. 2004). In some cases, asymptomatic plants may also be infected in nurseries (Bienapfl and Balci 2014; Parke et al. 2014). Other methods are available for randomly sampling plant lots with no symptoms (Bienapfl and Balci 2014), but they were not within the scope of our study.
In the case of the leachate approach, priorities for future research include assessing detection sensitivity in small container sizes commonly used in restoration plantings. Plants in these small containers are tightly packed in racks or trays and often produced in large quantities, so a high detection efficiency is desirable.
For dog-based detection, it will be necessary to successfully complete the scent recognition phase of the training and then progress to field tests under a range of conditions. Field tests will include plants whose infection status can be verified by other methods so that the frequency of false negative and false positive identifications can be determined.
Notwithstanding the need for further research, the approaches described appear to be innovative and powerful, with clear practical applications. Further work is needed to refine the approaches and determine the range of conditions under which they can be applied. Whether they are truly applicable as here described, or they need adjustment, can be determined only when sampling is performed at a larger scale and includes greater sample, facility and pathogen variability.
Three new Phytophthora detection methods, including training dogs to sniff out the pathogen, prove reliable

