


All Issues
Modeled soil erosion potential is low across California's annual rangelands
Publication Information
California Agriculture 72(3):179-191. https://doi.org/10.3733/ca.2018a0021
Published online September 19, 2018
PDF | Citation | Permissions
Abstract
We used the Revised Universal Soil Loss Equation (RUSLE) to evaluate how different residual forage dry matter (RDM) levels affect erosion potential in rangelands across California. The model was adapted to operate in a geographic information system (GIS) to model 14.8 million acres (6.0 million hectares) of land. Average erosion potential was low among all RDM scenarios and increased from an estimated 0.05 ton per acre per year (0.11 megagram per hectare per year) with the high RDM scenario to 0.12 ton per acre per year (0.27 megagram per hectare per year) with the low RDM scenario. Considering all RDM scenarios, fewer than 174,733 acres (70,710 hectares, or 1.2% of land) had erosion potential that exceeded soil loss tolerance values. Although achieving a uniform RDM target across a landscape may be an oversimplification of reality, simulations suggest that erosion potential on average is low in California's annual rangelands across high, moderate and low RDM recommendations. Moreover, our findings indicate that grazing management (maintaining moderate or high RDM) to mitigate erosion can be effective when targeted at areas of high vulnerability.
Full text
California's annual rangelands occupy more than 16 million acres (6.5 million hectares), supplying over 70% of the forage for the state's $3 billion beef cattle industry. They also provide a variety of other societal services, including wildlife habitat, carbon sequestration, biodiversity and aesthetic value. Additionally, they lie within watersheds that regulate the quantity and quality of California's water supply. Limiting erosion is critical to the sustainability of rangeland ecosystems, and is directly linked to healthy soils.
Erosion is the leading cause of forage productivity degradation in the United States (OTA 1982; Pimentel et al. 1995); it threatens the vitality of rangelands in a variety of ways. Loss of topsoil and associated organic matter decreases available nutrients and the remaining soil's nutrient retention capacity. Eroded soils typically have diminished rooting depth, water infiltration rate and water-holding capacity. Soil loss decreases vegetative production, rooting, and thus vegetative cover — potentially accelerating additional erosion in a feedback loop of diminishing soil health, forage productivity and carbon sequestration (OTA 1982; Schuman et al. 2002; Thurow and Taylor 1999). Erosion from rangelands has also been associated with degraded water quality in adjacent streams and rivers (US EPA 2012) and can compromise an ecosystem's biotic integrity and hydrologic function (Pellant et al. 2005).
Excessive cattle grazing from high stocking rates, because it can increase erosion, is a primary issue facing rangeland sustainability worldwide (Briske et al. 2011; Menke and Bradford 1992). Stocking rate — a measure of annual grazing intensity defined as number of animal units (1,000 lb beef cow) per acre — is the predominant grazing decision determining ecological, edaphic and production outcomes (Briske et al. 2011). On California's annual rangelands, residual dry forage matter (RDM) at the end of the summer dormant season (just prior to the onset of fall rainfall-runoffevents) is the standard indicator of annual grazing intensity at a site (Bartolome et al. 2006; Bartolome et al. 2007; Tate et al. 2004). UC Agriculture and Natural Resources (UC ANR) grazing recommendations for California provide RDM guidelines for discrete classes of slope, tree cover and rainfall (Bartolome et al. 2006); the guidelines help ranchers achieve sustainable forage production by limiting soil degradation caused by erosion and also provide benefits to species composition (Bartolome et al. 1980; Bartolome et al. 2014).
Results from a UC study suggest that a majority of California's rangeland is resistant to sheet and rill erosion if recommended residual forage dry matter levels are being achieved.
To varying degrees, excessive grazing removes substantial vegetation and can compact soil and weaken or destroy aggregates — particularly when soils are wet — all of which can increase surface runoff, erosion and pollutant transport (Beckmann and Smith 1974; Hodgkinson 1993; Knoll and Hopkins 1959; Warren et al. 1986). Adequate vegetative cover reduces soil erosion by (1) protecting soil from raindrop impact, (2) attenuating runoff velocity (Wischmeier 1975), (3) increasing infiltration and (4) stabilizing soil (De Ploey 1982; Dunne et al. 1991; OTA 1982). Several studies indicate that proper grazing management of a site results in soil loss values similar to those for ungrazed land (Weltz et al. 1998).
Recently, the White House Office of Science and Technology Policy issued a national call to action to protect America's soil (OSTP 2016). The purpose was to inform decision-making and engage the public about soil degradation, with erosion as a primary focus. In response to this call to action, we — a group of UC soil and range scientists — evaluated erosion potential across 14.8 million acres (6.0 million hectares) of California's annual rangelands — including annual grasslands, oak savannas and oak woodlands (Cal Fire 2015) — and the impact of changes in vegetative cover on the sustainability of this resource, using the Revised Universal Soil Loss equation (RUSLE) model. Our objective was to identify regional patterns in erosion potential across high, medium and low RDM scenarios and demonstrate where grazing management works best to protect against soil erosion. Recognizing that California annual rangelands have relatively high vegetative cover, we sought to demonstrate the inherent resilience of this system to erosion under careful management.
RUSLE model, GIS database
RUSLE is an empirical model that predicts sheet and rill erosion. Other types of erosion such as gully, stream bank and stream bed erosion are not evaluated by RUSLE (Renard et al. 1997; Wischmeier and Smith 1978). Sheet erosion is caused by the movement of water over the land surface. Rill erosion is caused by surface runoff becoming concentrated in small channels that generally do not exceed 4 inches in depth (USDA NRCS 2015a). Gullies are larger channels, too large to be removed by normal tillage operations.
Examples of sheet, rill and gully erosion in rangeland settings
Sheet and rill erosion
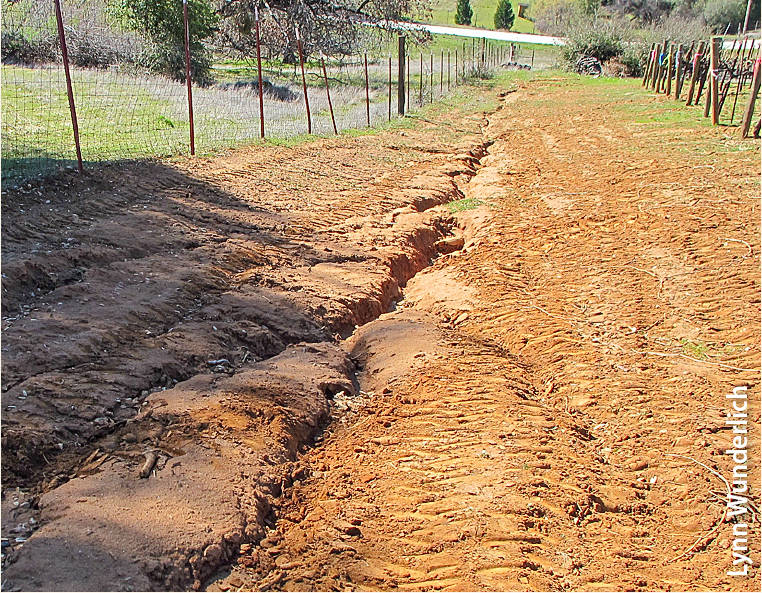
Sheet and rill erosion on an unimproved dirt road. Rills are the channel networks. Areas of sheet erosion are the smooth textured surface soil surrounding the rills.
Gulley, sheet and rill erosion

Evidence of sheet, rill and gully erosion on steep rangelands. (A) Sheet and rill erosion can strip topsoil, exposing underlying subsurface soil layers. Gullys form where water concentrates, resulting in deep channels (B) that are difficult to restore.
Gulley erosion

Left, gully erosion in upland headwaters of an intermittent stream. Right, an example of how poorly designed roads can focus runoff and cause gully erosion.
Stream bed erosion

Turbid streamflow below a road crossing.
Stream bank erosion

Left, cattle near a degraded stream bank. Right, incised stream channel, which leads to bank failure.
Model inputs
RUSLE predicts erosion based on six factors: rainfall, soil erodibility, slope length and steepness, cover management, and conservation practices (Renard et al. 1997). We developed a geographic information system (GIS) database to reflect the RUSLE equation:
A = R × K × L × S × C × P
where A is average annual soil loss due to rain-induced erosion, which we termed erosion potential, R is the rainfall runoff erosivity factor, K is the soil erodibility factor, L is the slope length factor, S is the slope steepness factor and C is the vegetation cover management factor (table 1). P is conservation practices. We assumed no conservation practices, and thus P was left out of the model.
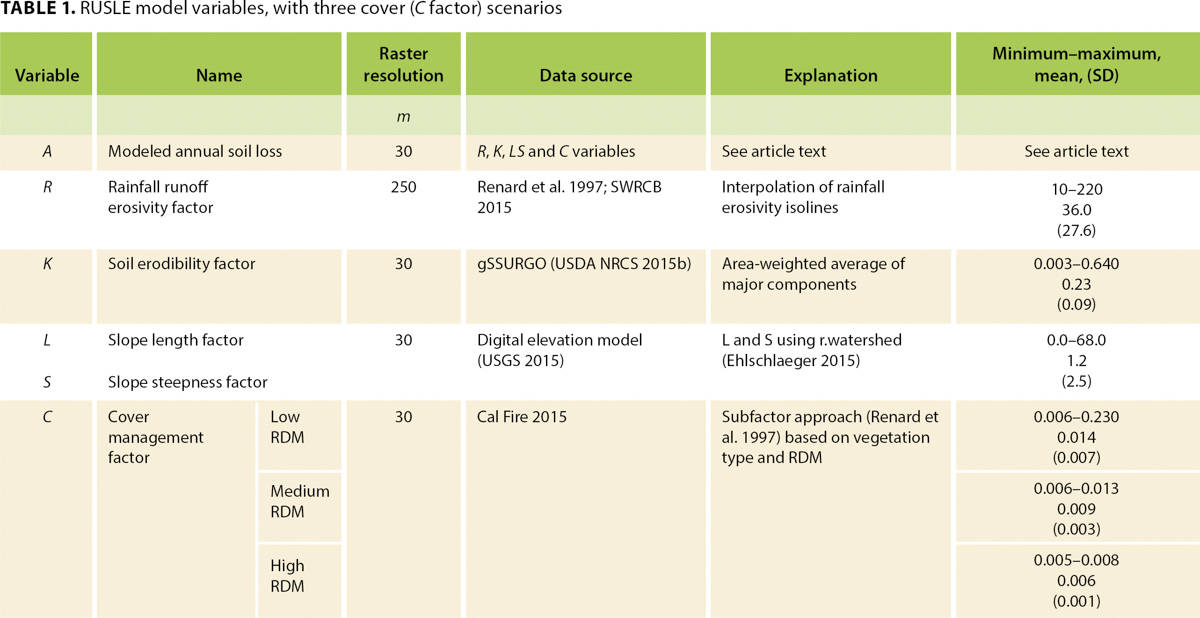
The GIS database contained a raster layer for each input factor. Spatial resolution was 30 meters, except for the R factor, which was 250 meters. Three separate RDM scenarios were modeled as explained below. Details about how the R, K, C, L and S factors were digitized into a statewide GIS are described in Salls (2016).
R factor. A raster layer for average annual rainfall erosivity was derived from a map of R factor isolines (Renard et al. 1997) and georeferenced by the California State Water Resource Control Board (SWRCB 2012). R factor pixel values were derived by linear interpolation of georeferenced isolines at a resolution of 250 meters. To complete interpolation, isolines terminating outside of California were closed manually by georeferencing maps of neighboring regions and tracing the isolines. Closure of isolines terminating in Mexico or off the coast was approximated.
K factor. The soil erodibility layer was developed from the gridded soil survey geographic (gSSURGO) database (USDA NRCS 2015b). Surface horizon K factor (including rock fragments) was used for each component, and major components were aggregated across SSURGO map units based on their percentages using an area-weighted average.
The K factor was adjusted in the northern Sierra Foothills to account for the binding effect of iron oxides present in the metavolcanic parent materials. Singer et al. (1980) recorded the K factor of one such soil, the Auburn Series, as 0.03 — far below the values in gSSURGO estimated using the system in Wischmeier and Smith (1978), which range from 0.22 to 0.30. To correct for artificially high soil erodibility in areas with metavolcanic terrain, K factors were multiplied by 0.14.
L and S factors. The raster layer for the slope length and steepness factors was calculated from the national elevation dataset (NED) digital elevation model (USGS 2015). The product of L and S was calculated using the r.watershed module in GRASS GIS version 7.0 (Ehlschlaeger 2015), which uses equations for calculating the LS factor (Weltz et al. 1998). NED 1-arc-second grid cells were reprojected into 30-meter pixels using bilinear interpolation.
C factor. Three RDM scenarios (low, moderate and high) were examined to approximate the UC Cooperative Extension (UCCE) grazing management RDM recommendations (table 2). The C factor raster layer for each RDM scenario was calculated using the subfactor approach presented in Renard et al. (1997):
C = PLU × CC × SC × SR
where C is the vegetation cover management factor, PLU is the prior land use, CC is the canopy cover, SC is the surface cover, and SR is the surface roughness. Salls (2016) explains each sub-factor calculation.
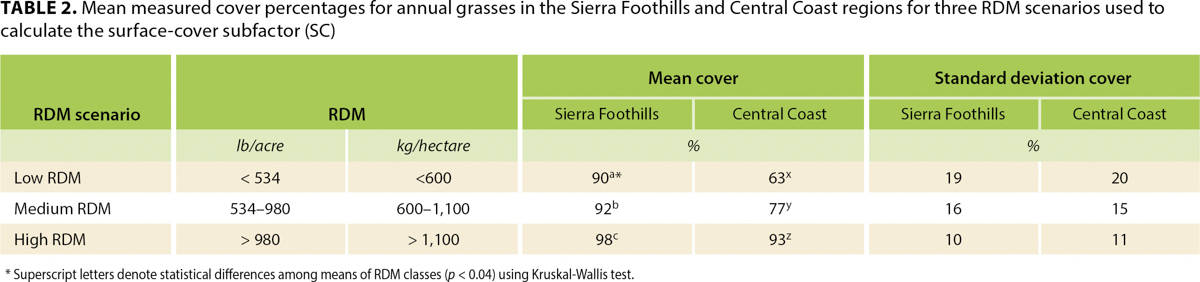
TABLE 2. Mean measured cover percentages for annual grasses in the Sierra Foothills and Central Coast regions for three RDM scenarios used to calculate the surface-cover subfactor (SC)
To populate surface cover (SC) for the three modeled RDM scenarios, relationships between RDM and surface cover were established. These data do not exist for the range of conditions throughout California's annual rangelands. We used existing data collected from two different locations: 614 field plots in the northern Sierra Foothills region in Yuba County sampled during fall of 2013, 2014 and 2015, and 168 field plots in the Central Coast Range in eastern San Luis Obispo County collected during fall 2015 to establish a relationship between SC and RDM within each RDM scenario, which generally reflect UCCE grazing guidelines.
In each field plot, the area of bare ground was visually estimated, and vegetation was cut at the base, dried and weighed to determine RDM. Vegetative cover was calculated as the mean cover percentage of samples falling within high (> 980 pounds per acre, 1,100 kilograms per hectare), medium (534 to 980 pounds per acre, 600 to 1,100 kilograms per hectare) and low (< 534 pounds per acre, 800 kilograms per hectare) RDM classes (table 2).

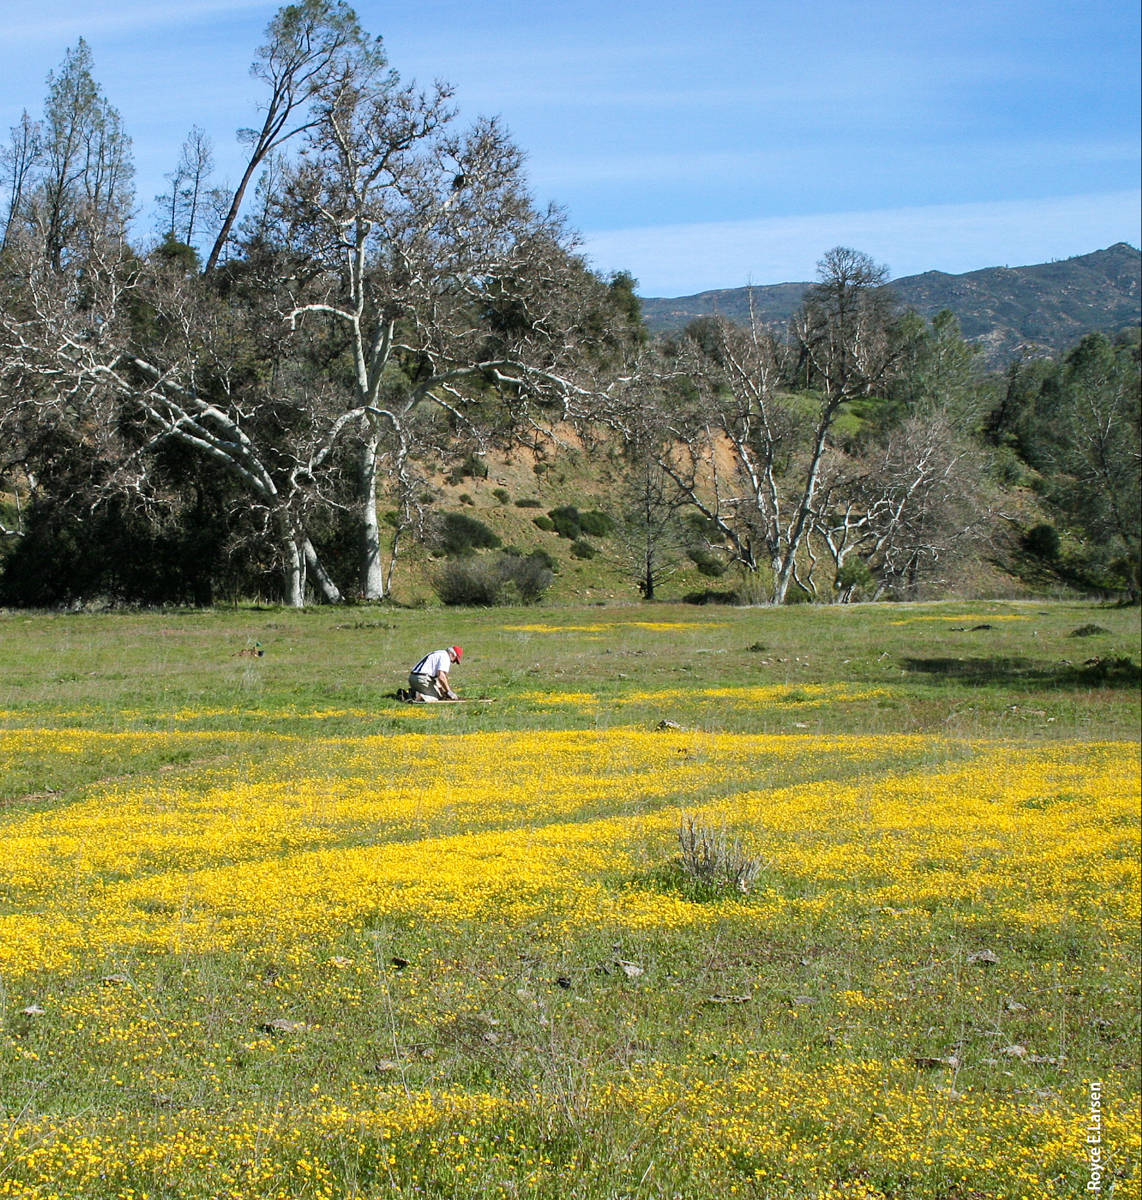
Co-author Toby O'Geen investigates evidence of soil compaction, which can occur on trails and loafing areas where livestock congregate. Soils are especially prone to compaction by excess traffic when wet, and compacted soils are prone to erosion.
Relationship between cover and RDM
Field plot cover assessments revealed high surface cover (SC in equation above) across all RDM classes, especially in the Sierra Foothills region (table 2). Percent cover remained high even in the low RDM scenario because of the high density of annual grasses that maintain surface cover. Each RDM scenario (low, medium and high) had significantly different mean vegetative cover percentages (p < 0.04). Mean SC was over 90% in the Sierra Foothills region across all RDM scenarios and increased slightly as RDM increased, ranging from 90% for low RDM to 98% for high RDM (table 2). Mean SC was lower in the Central Coast, ranging from 63% for low RDM to 93% for high RDM (table 2).
Mean SC values derived from measured relationships between SC and RDM in the Central Coast and Sierra Foothills (table 2) were assigned to rangeland productivity zones (RPZs) in a GIS (fig. 1 and see below). The Central Coast Range RDM SC relationship (table 2) was assigned to RPZs 4, 5 and 6, which are dry and warm areas (table 3). The Sierra Foothills RDM SC relationship (table 2) was assigned to RPZs 1, 2 and 3, corresponding to cooler and wetter areas (table 3).

FIG. 1. Distribution of rangeland productivity zones (RPZs). These regions reflect differences in climate, soils and topography, which are factors directly related to soil erosion. RPZs 1, 2 and 3 were assigned the Sierra Foothills RDM cover relationship, and RMZs 4, 5 and 6 were assigned the Central Coast RDM cover relationship.
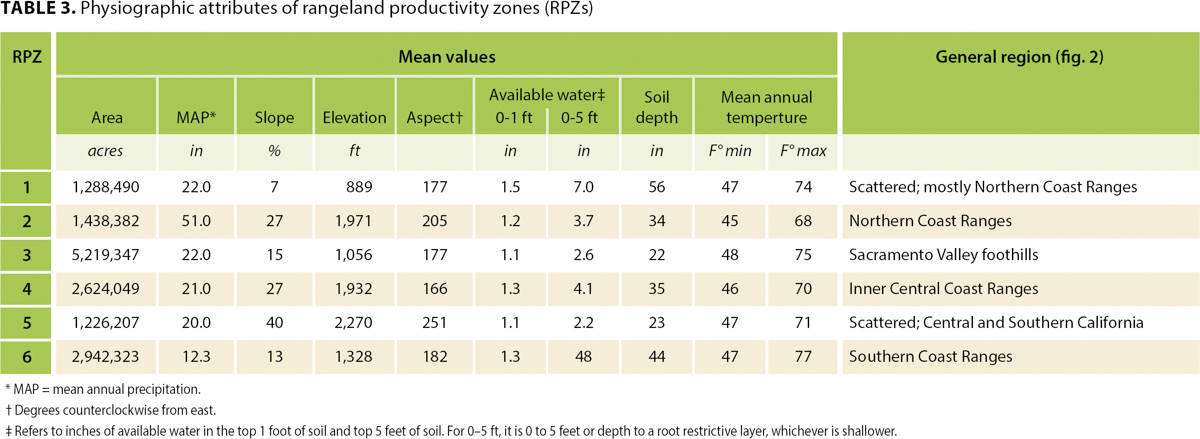
RPZs were developed using a cluster analysis of the following environmental variables: plant-available water at 30 and 150 centimeters, soil organic carbon at 30 and 150 centimeters, root zone depth, solar radiation, landscape position (Jasiewicz and Stepinski 2013), slope, flow accumulation, precipitation, and mean annual minimum and maximum temperatures. Random forest regression was used to compute importance values for all environmental variables in explaining an estimate of peak standing biomass determined by Thematic Mapper (TM) scene (April 26, 2010) using MODIS Enhanced Vegetation Index (EVI). A partitioning around medoids approach was used to create the set of clusters. These clusters were mapped across the landscape using a random forest model to predict RPZs based on the geospatial input variables.

FIG. 2. Average erosion potential differs statewide and for each RPZ due to differences in climate, surface cover, soils and topography. The effect of RDM scenarios (low, medium and high) on erosion potential is not constant among regions (RPZs).
Differences in erosion potential
At the statewide scale, differences in erosion potential among RDM scenarios were relatively small. Of the three scenarios modeled, average erosion potential was highest for low RDM, at 0.12 ton per acre per year (0.27 megagram per hectare per year) (table 4). For medium RDM, it was 0.09 ton per acre per year (0.20 megagram per hectare per year), and it was lowest, at 0.05 ton per acre per year (0.11 megagram per hectare per year), for high RDM. Median erosion potential values showed the same trend among RDM scenarios, but they were lower than the average values, indicating that most values in each modeling grid were relatively small values (table 4).
A small portion of land was highly erodible under all scenarios because it received intense rainfall, contained erodible soils and/or had long, steep slopes. Maximum erosion potential was 33 tons per acre per year (74.0 megagrams per hectare per year) for low RDM, 19 tons per acre per year (42.6 megagrams per hectare per year) for medium RDM and 10 tons per acre per year (22.4 megagrams per hectare per year) for high RDM (table 4).
RPZs with high erosion potential
Erosion potential was not uniform across the state. RPZs 2, 4 and 5 had the highest erosion potential for all RDM cover scenarios (fig. 2). Among these three RPZs, zone 5 was most prone to erosion under low RDM (average = 0.29 tons per acre per year, 0.65 megagram per hectare per year), while by a small margin zone 4 showed the highest resistance to erosion under high RDM (0.08 tons per acre per year, 0.17 megagram per hectare per year) (fig. 2). RPZs 4 and 5 had the greatest difference in erosion potential among cover scenarios. Despite having relatively high erosion potential, the difference among RDM cover scenarios was minimal in RPZ 2 (fig. 2); erosion potential in RPZ 2 differed by only 0.02 ton per acre per year (0.04 megagram per hectare per year) across RDM scenarios.
RPZs 4 and 5 were assigned the Central Coast Range SC-RDM relationship, which had low SC factor associated with low and moderate RDM compared to RPZs assigned with the Sierra Foothills SC data set. As a result, RPZs 4 and 5 were more sensitive to RDM reductions. These RPZs both had steep slopes (particularly RPZ 5) and thus high LS factors, leading to generally high erosion potential.
Erosion potential was relatively high in zone 2 for all scenarios. This was the case even though RPZ 2 was assigned the high RDM SC relationship established from the Sierra Foothills data set, which resulted in high SC across all scenarios (table 2). With most of its area occurring in the North Coast and higher elevations of the Sierra Foothills, RPZ 2 had steep slopes and high rainfall intensity, and thus, generally high R and LS factor values, which explains the high erosion potential.
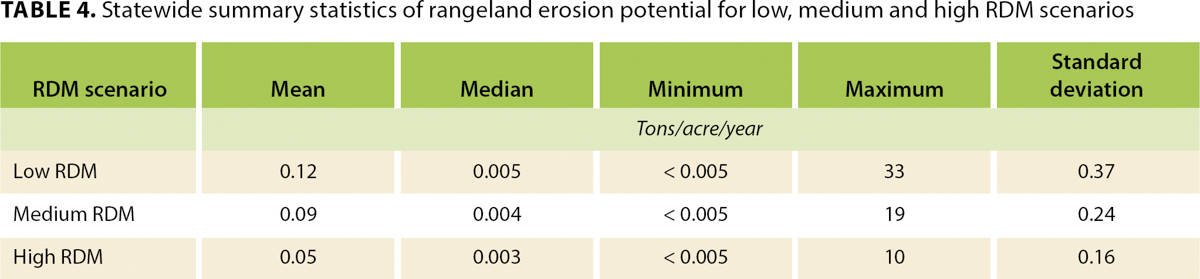
TABLE 4. Statewide summary statistics of rangeland erosion potential for low, medium and high RDM scenarios
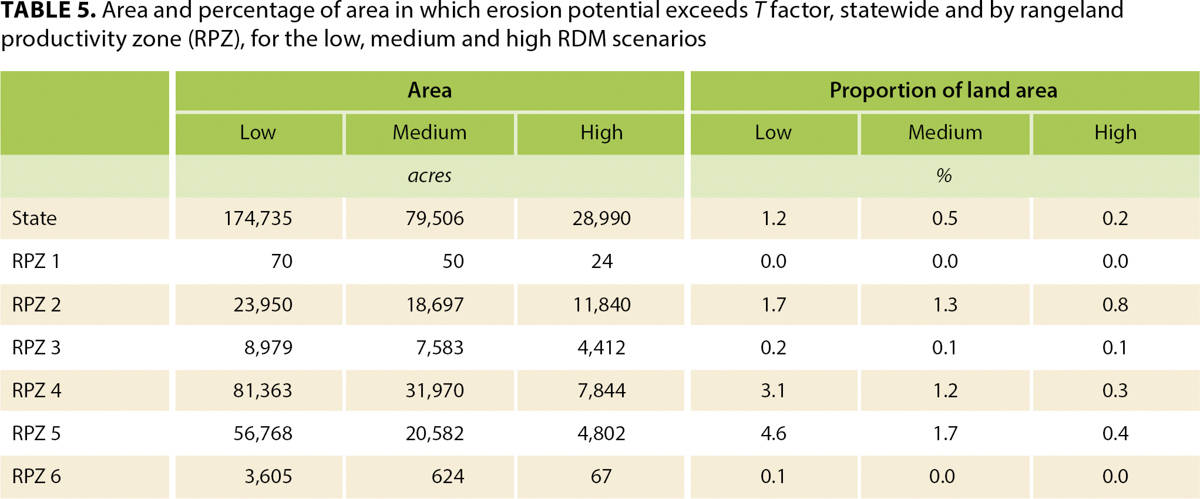
TABLE 5. Area and percentage of area in which erosion potential exceeds T factor, statewide and by rangeland productivity zone (RPZ), for the low, medium and high RDM scenarios
RPZs with low erosion potential
RPZs 1, 3 and 6 had low erosion potential for all RDM cover scenarios (fig. 2). RPZs 1 and 3 had extremely low mean erosion potential for all scenarios, with little difference between scenarios (fig. 2). RPZs 1 and 3 were assigned high RDM SC relationships established from the Sierra Foothills data, thus SC was high across all scenarios (table 2). Slope angles were also low, especially in RPZ 1, generally minimizing erosion potential.
RPZ 6 showed more substantial differences in erosion potential among scenarios. These differences were much smaller than in RPZs 4 and 5, though were similar proportionally. RPZ 6 was assigned the Central Coast Range SC data, which had lower mean SC subfactor values for RDM scenarios (table 2). Although RPZ 6 had the highest average K factor, its conditions of gently sloping terrain, low precipitation and low rain intensity translated to low erosion potential.
Relationship with soil loss tolerance
Modeled erosion potential was compared against soil loss tolerance values (T values) across the study area. T values identify the maximum level of acceptable erosion and are assigned based on estimates of the rate of soil formation and properties of the subsoil (Li et al. 2009). U.S. Department of Agriculture Natural Resources Conservation Service (USDA NRCS) defines T as “the maximum rate of annual soil loss that will permit crop productivity to be sustained economically and indefinitely on a given soil” (USDA 2015b).
NRCS established T values as integers from 1 through 5 tons per acre per year assigned to soil types, indicating the maximum allowable soil loss (Soil Survey Division Staff 1993). T values vary greatly across landscapes; those provided by soil survey may not always be accurate in rangelands, nor mapped at a scale fine enough to capture soil variability. We chose to compare modeled erosion potential with T values because T values are an established threshold condition used by the NRCS in conservation planning. While T values are published for rangelands in soil survey reports, they were originally designed for cropland evaluation.
Erosion potential was not uniform across the state. RPZs 2, 4 and 5 had the highest erosion potential for all RDM cover scenarios.
In this model, only small percentages of the state's rangelands exceeded T values (table 5). A little over 1% (174,704 acres, 70,710 hectares) of rangeland had erosion potentials exceeding T values for the low RDM scenario. It decreased to 0.5% for medium RDM (79,568 acres, 32,174 hectares) and 0.2% (28,911 acres, 11,732 hectares) for high RDM. Even if all rangelands in the state had the most conservative T value of 1 ton per acre per year (2.2 megagrams per hectare per year), more than 75% of rangelands would have erosion potential below T for the low RDM scenario. However, the small portion of rangeland exceeding T values does indicate potential areas in which soils should be managed carefully to maintain productivity.
The relevance of soil loss tolerance values should be considered cautiously. Low soil loss tolerance values fail to recognize the resilience of soil to management and can lead to unnecessary and expensive soil conservation strategies. In contrast, high T values can lead to productivity loss since they may unduly discourage managers from considering erosion protection measures (Li et al. 2009). Some believe that T values are not accurate benchmarks of sustainability because they are based on overestimated soil formation rates and fail to consider environmental costs associated with erosion (Amundson et al. 2015).
Influence of grazing recommendations on erosion potential
Moderate RDM is typically recommended to optimize livestock performance and rangeland protection (Bartolome et al. 2006). Our modeling results suggest that this recommendation is most important in regions that are more prone to erosion, such as RPZ 4 and 5, and to a lesser extent RPZ 2. Zone 6 may also benefit from moderate RDM, but erosion potential is low throughout.
It is important to note that all other factors being constant, the relationship between surface cover and erosion potential is not linear; a reduction of surface cover in areas where cover was low increased erosion potential more than reduction by the same percentage in areas where cover was high. This implies that erosion is most effectively reduced by carefully managing areas with low cover (i.e., areas with high amounts of bare soil).
While more cover reduces erosion potential, there are trade-offs between cover and other rangeland management objectives, including forage production, forage quality and plant species diversity. To maximize rangeland forage production as well as erosion protection, optimal RDM levels have been proposed. In California annual grasslands receiving annual rainfall between 15 and 40 inches (38 and 102 centimeters), maximum productivity was found to occur with 840 kilograms per hectare (750 pounds per acre) of RDM (Bartolome et al. 1980). Another study suggested that the RDM range to optimize forage production and species richness was 672 to 1,344 kilograms per hectare (600 to 1,200 pounds per acre) (Bartolome and Betts 2005). These RDM levels both coincided with the moderate RDM scenario modeled here, though the upper range identified by Bartolome and Betts (2005) extended into the high RDM class. Productivity has been observed to be higher with more RDM, but low RDM may increase plant species diversity in the form of forbs and clovers (Bartolome et al. 2007), which are considered higher quality forage. Additionally, as suggested by RDM guidelines, these relationships vary spatially (Bartolome et al. 2006), suggesting that our uniform extrapolation of RDM classes at regional scales is speculative.
Medium RDM scenario statewide
Figures 3 and 4 depict patterns in erosion potential using the medium RDM cover scenario. At the state scale (figs. 3A and 4A), erosion potential appears uniformly low. At finer scales, however (figs. 3B and 4B), erosion potential appears more variable where portions of the hillslope are depicted, which cannot be seen at the statewide scale. Some broad-scale trends are evident. High erosion potential values were common along the eastern edge of the Sierra Foothills, more so toward the south. A large swath of rangeland skirting the north end of the Central Valley near Redding showed elevated erosion potential as well (fig. 3B). Erosion potential was higher in the northern Coast Range (figs. 3A, 4A and 4B). Many of these areas coincide with relatively high rainfall intensity and steep slopes. Areas of low erosion potential include well-vegetated areas in the Sierra Foothills and the interior central and southern Coast Range, low slope angles in and around the Central Valley, and soils derived from metavolcanic rocks in the northern Sierra Foothills that are resistant to erosion because of low K factors (Salls 2016; Singer et al 1980).
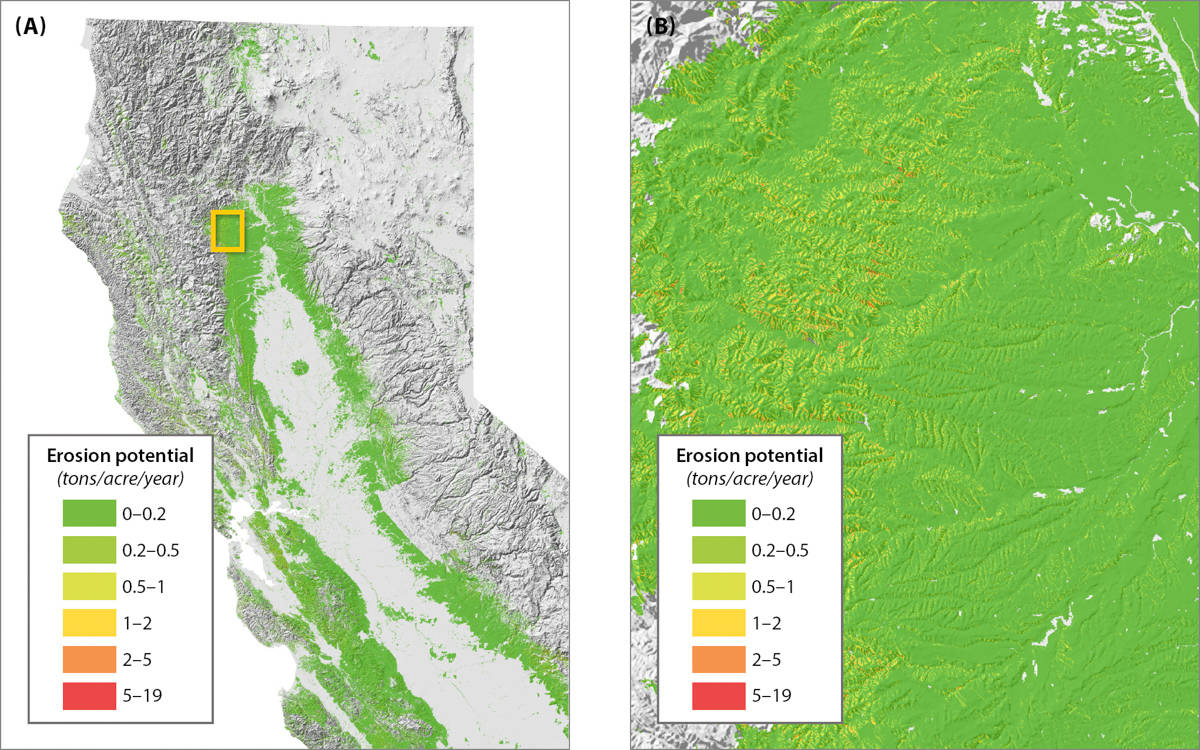
FIG. 3. Modeled erosion potential in tons/acre/year for Northern California (A) under the medium RDM scenario. Yellow box identifies the area of the finer scale map (B) near Redding, California. While erosion potential appears uniformly low at broad scale, areas of high erosion potential exist when visualized at fine scales.

FIG. 4. Modeled erosion potential in tons per acre per year for Southern California (A) under the medium RDM scenario. Yellow box identifies the area of the finer scale map (B) near San Luis Obispo. While erosion potential appears uniformly low at broad scale, areas of high erosion potential exist when visualized at fine scales.
Erosion potential was higher in the northern Coast Range. Many of these areas coincide with relatively high rainfall intensity and steep slopes.
Comparison of modeled and measured values
To assess model performance, modeled erosion potential values were compared to field data collected from three different locations. The first location was in the Central Coast Range near Paso Robles, where we measured erosion in three plots for each of two treatments: planted with a cover crop of the oilseed Camelina sativa, and bare soil. In addition, we used data from existing studies in two locations, each of which monitored sediment discharge into a California rangeland stream. Average annual sediment flux from each stream was used to calculate a sediment flux per area (in tons per acre per year) based on the size of each watershed. Though sediment flux values are not directly comparable to erosion soil loss rates (see explanation below), they provide a rare opportunity to test the model against watershed-scale assessments. One stream, Stemple Creek, originates in Sonoma County and drains from the Marin County coast (Lewis et al. 2008). The Stemple Creek study reflects monitoring of creek discharge after major storm events over two seasons (2004 to 2006). The other stream drains the Schubert watershed in the northern Sierra Foothills (Lewis et al. 2006). The Schubert study uses a 20-year data set (1981 to 2000) where stream flow was monitored continuously and suspended sediment was measured intensively during storms and occasionally during storm-free periods.
Measured erosion and sediment flux values at the three locations were low and were surprisingly (given the differences in scale) similar to average modeled erosion potential values based on the low RDM scenario (fig. 5).

FIG. 5. Comparison of measured soil loss at three locations with average erosion potential modeled for the site's associated rangeland productivity zone (RPZ) using the low RDM scenario. Stemple Creek and Schubert Watershed values correspond to suspended sediment in streams, not directly to soil loss, and runoff plots did not have a rangeland cover type. Evidence suggests that the RUSLE model produces estimates of erosion that are comparable to field measurements despite the fact that sediment in streams (Stemple and Schubert) is not a direct measurement of soil erosion. While modeled versus measured erosion at Stemple creek and RPZ 2 appear different, they are both low.
Erosion rates measured at the planted and bare runoff plots in Paso Robles were similar to modeled erosion potential for zone 4, the RPZ where this site is located. Measured sediment flux from the Schubert Creek study was 0.088 ton per acre per year (0.20 megagram per hectare per year), relatively close to the average modeled erosion potential based on the lower RDM scenario in RPZ 3, in which Schubert is located: 0.05 ton per acre per year (0.11 megagram per hectare per year).
Measured sediment flux averaged across the Stemple Creek watershed was 0.015 ton per acre per year (0.03 megagram per hectare per year). This value was much lower than the modeled erosion potential in its associated RPZ (2), where average erosion potential ranged from 0.18 ton per acre per year (0.4 megagram per hectare per year) under low RDM to 0.13 ton per acre per year (0.29 megagram per hectare per year) with high RDM.
Some of the difference between measured and modeled values at the Stemple Creek site may be explained by the fact that, as mentioned above, the sediment flux measurements generated by watershed discharge studies are not directly comparable to RUSLE modeled values. Sediment flux is an imperfect proxy for erosion as it reflects sediment transported to waterways; it does not account for all on-site soil loss, some of which may be deposited on land before reaching a waterway (Renard and Stone 1982; Walling 1983). Therefore, sediment yield to waterways can be lower than erosion at the catchment scale. Another implication is that the findings of this study do not provide information about sediment flux to streams in rangeland areas.
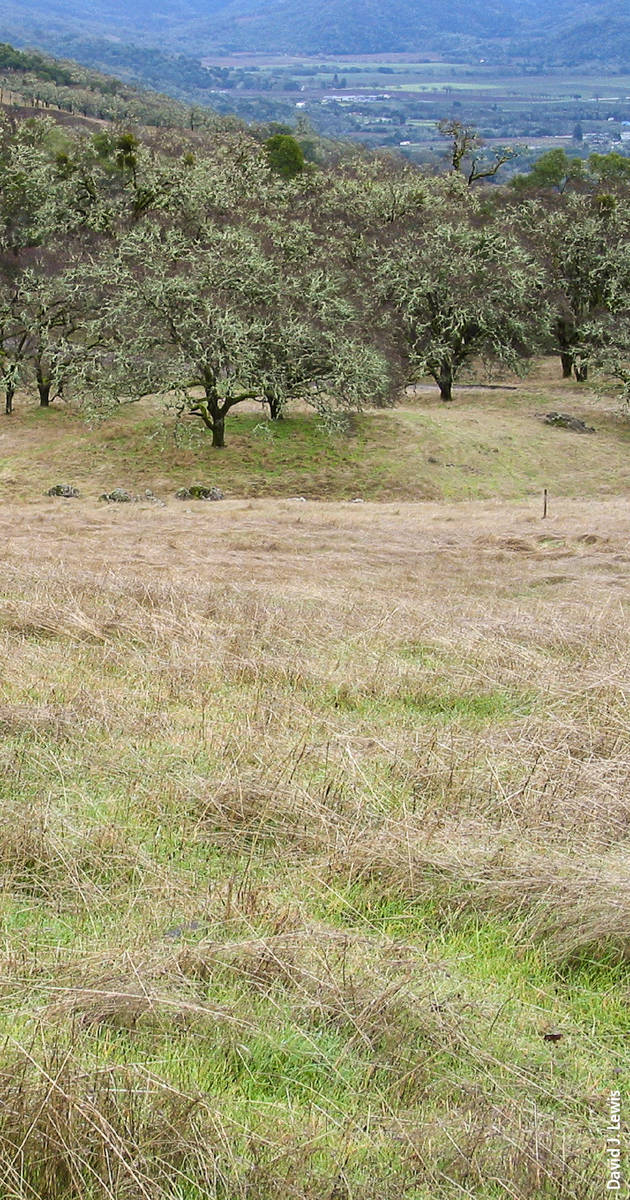
Rain falling in late fall and early winter, when protective cover is lowest, can have a disproportionate impact on soil erosion compared to rain falling in the spring, when annual grass cover begins to emerge.
Model limitations
There are many limitations to our analysis. Modeling at a statewide scale diminishes precision. Generalizations, often unrealistic, must be applied to larger areas. RUSLE models rill and sheet erosion, but does not include channelized gully erosion. Erosion from cattle trails has been shown to be significantly higher than the surrounding grazed landscape (George et al. 2004). Our modeling could not account for this fine scale occurrence and is a possible explanation of why our results were so low. While RUSLE was originally designed and tested in both rangelands and croplands (Renard et al. 1997; Spaeth et al. 2003), USDA-NRCS now limits its application primarily to cropland. Inconsistences in erosion predictions from RUSLE have been identified. In general, soil erosion models have a bias against extreme values, whether high or low. This limited modeling of variability leads to overprediction of low values and underprediction of high values (Nearing 1998). Moreover, results do not reflect erosion from roads or cattle trails, which may be significant contributors to erosion (George et al. 2002; George et al. 2004; Lewis et al. 2001). In other studies, infiltration rate has been shown to increase in the presence of blue oak trees (Dahlgren et al. 1997) and decrease due to soil disturbance from intensive grazing (Thurow et al. 1988; Warren et al. 1986), effects not directly considered here.
We chose to use an older version of RUSLE1 (Reynard et al. 1997) even though a more recent version exists (RUSLE2), because the latter calculates erosion on daily time steps. Statewide data on seasonal changes in rainfall intensity and vegetation cover do not exist for California, thus we decided a simplified approach was needed for our statewide assessment. We acknowledge that RUSLE1 erosion output can vary from RUSLE2 by as much as 20% (Foster et al. 2003). For example, RUSLE1 models the average rainfall intensity and does not consider extreme events, which could be responsible for a bulk of the runoff. Despite this discrepancy, our field validation suggests that RUSLE1 produces reliable estimates of erosion.
The model could be improved through better definition of the C factor by establishing more relationships between cover and RDM across a wider array of physiographic conditions. This relationship varies spatially with a variety of factors including temperature, precipitation, light, soil depth and fertility, slope, and aspect. Moreover, this study did not address temporal variability of cover, neither within nor between years. Cover and rainfall vary throughout the year, particularly in California's Mediterranean climate zones (Becchetti et al. 2016; George et al. 2010). Unlike perennial systems, the annual grass and forb cover of California's annual rangelands is seasonally dynamic in response to grazing and the timing of precipitation. Cover generally increases as the rainy season progresses and peaks in mid- to late spring. After excessive grazing, cover remains low until the rainy season resumes the following growing season. Rain falling in late fall and early winter when protective cover is lowest can have a disproportionate impact on erosion. Our assumption likely overestimates erosion since cover often regenerates during the rainy season, depending on timing of temperature and precipitation (Becchetti et al. 2016). Variability between years is more problematic. Rainfall varies substantially each year, but this is not captured in the empirical structure of RUSLE. Cover RDM relationships and rangeland productivity also vary year to year depending on amount and timing of rainfall, temperature and sunlight (Becchetti et al. 2016). For example, in the Central Coast Range, RDM has been observed to decrease 7% to 11% each month during the dry season due to natural decomposition (R. Larson, personal communication 2017). If fall rains fail to arrive and RDM levels continue to decrease, cover can diminish substantially, resulting in a landscape highly vulnerable to erosion in winter months when rainfall intensity is high. These issues demonstrate that modeling provides information about scenarios modeled, but may not accurately simulate real-world conditions. Ultimately better models are needed that address the complexity of range landscapes (Nearing et al. 2011).
Other geospatial erosion models are available (see Borah and Bera 2003 and Merritt et al. 2003 for extended reviews of models), but are generally intended for modeling individual watersheds. A few other models such as N-SPECT and SedNet are intended for larger scales (Álvarez-Romero et al. 2014). Though RUSLE was developed at the field scale, its simple multiplicative factor approach is well suited to broad scale GIS based modeling in rangelands (Blaszczynski 1992) and elsewhere (Demirci and Karaburun 2012; Erdogan et al. 2007).
Unlike perennial systems, the annual grass and forb cover of California's annual rangelands is seasonally dynamic in response to grazing and the timing of precipitation.
Implications
Modeled erosion potential in California's rangelands was remarkably low (mean well below 1 ton per acre per year), and less than for most land uses in most states reported in the 2012 National Resources Inventory (USDA 2015). Actual erosion in a given area could be much higher. Areas with high erosion potential exist throughout the state. Such hot spots where erosion potential was especially high represent instances where a combination of some or all factors (R, K, LS) creates an environment favorable for substantial soil loss. These locations must be managed carefully.
Soil erosion potential was summarized by RPZ to reflect differences in forage productivity, growing conditions and terrain characteristics across the state's annual rangelands. Thus, RPZs are intended to serve as geographic templates to understand spatial patterns in soil erosion potential. Ideally, this understanding could lead to regionally focused or prescriptive management responses. This information could be used for ranch water quality plans, assessments of rangeland soil health and carbon sequestration potential.
The fact that no more than 4.6% of the land area in any RPZ or RDM scenario exceeded the soil loss tolerance value suggests that a majority of California's rangeland is resistant to sheet and rill erosion if recommended RDM targets are being achieved. This finding is consistent with the results of other erosion assessments in California's annual rangelands (George et al. 2004; Lewis et al. 2001).
Results suggest that sheet and rill erosion from uplands may not be a significant source of sediment in rangeland streams. Thus, effort and resources intended to protect stream water quality should focus on reducing gully erosion and implementing sediment control strategies in and around roads and streams. Our results suggest that ranch managers can achieve greatest reduction in erosion that impacts stream water quality by targeting erosion control strategies on sensitive areas such as roads, trails and stream banks.
One-size-fits-all grazing recommendations of a single RDM level across entire landscapes will do little to reduce erosion in the most vulnerable areas and may sacrifice forage productivity in others.
This study illuminates the spatial variability of erosion, suggesting that uniform grazing management of large land areas may not be effective in achieving the cobenefits of erosion protection, diversity in plant communities and high forage productivity. One-size-fits-all grazing recommendations of a single RDM level across entire landscapes will do little to reduce erosion in the most vulnerable areas and may sacrifice forage productivity in others. Areas with inherently high erosion due to steep slope angles, long slope lengths, heavy rainfall, erodible soils and/or naturally low vegetative cover are also more sensitive to changes in cover, and therefore must be managed carefully. Reducing grazing dramatically in highly erodible areas will likely mitigate erosion more effectively than reducing grazing a little in areas less prone to erosion. Another consideration is that limiting grazing to areas less prone to erosion can lead to tradeoffs between forage production and species diversity, because high RDM can lead to lower species diversity and lower forage quality.
Modeled erosion potential values must be understood as estimates with limitations. Because the RUSLE model has many shortcomings, and because we modeled scenarios as opposed to reality, results are not intended to be interpreted as real erosion magnitudes. Likewise, attempts to identify sources of water quality impairments using these results, and RUSLE in general, should be avoided. Rather, the study is meant to provide a spatial representation of the relative resistance to and risk of erosion across California's rangelands.
Modeled soil erosion potential is low across California's annual rangelands

