


All Issues
Calf and yearling prices in California and the western United States
Publication Information
California Agriculture 70(4):179-186. https://doi.org/10.3733/ca.2016a0019
Published online November 16, 2016
NALT Keywords
Abstract
This paper investigates spatial, quality and temporal factors impacting the pricing of calves and yearlings in the western United States using data from a satellite video auction and a hedonic regression framework. Results suggest that spatial price discounts received by western ranchers closely match reported shipping costs and, thus, are consistent with free-on-board pricing and competitive procurement. This study also identifies the presence of temporal price premiums, on average, for seller-offered forward contracts at video auctions. With respect to quality attributes, this study provides estimates of the marginal value associated with various quality attributes and management practices, including vaccination protocols, weaning, certified Angus beef candidates, and age and source verification. Finally, we show that the considerable year-to-year variability in estimated valuations for value-added attributes in hedonic regression models of cattle pricing can be linked to the stage of the cattle cycle, with premiums paid by buyers being attenuated when cattle inventories are high.
Full text
Cattle-feeding and meat-processing sectors have become increasingly consolidated and concentrated geographically in the central portion of the country. Yet, beef cattle production remains an important industry in many states across the country. Figure 1 is a dot density plot of calf inventories in the United States in 2015. As it shows, calf inventories are geographically diffuse with no one state having more than 14% of the total inventory. In contrast, figure 2, a dot density plot of cattle on feed, shows that by a considerable margin, the greatest intensity of cattle on feed occurs in the Great Plains. Ultimately five states (Texas, Nebraska, Kansas, Colorado and Iowa) market 76% of all fed cattle for slaughter in the United States (USDA 2012).

Fig. 1. Dot density plot of calf inventory, January 1, 2015. Map shows state-level inventory totals with each dot representing 1,500 calves. Calf inventories are not breed or industry specific and thus include both beef and dairy “type” animals. Source: Calf Inventory, January 1, 2015. U.S. Department of Agriculture, National Agricultural Statistics Service.
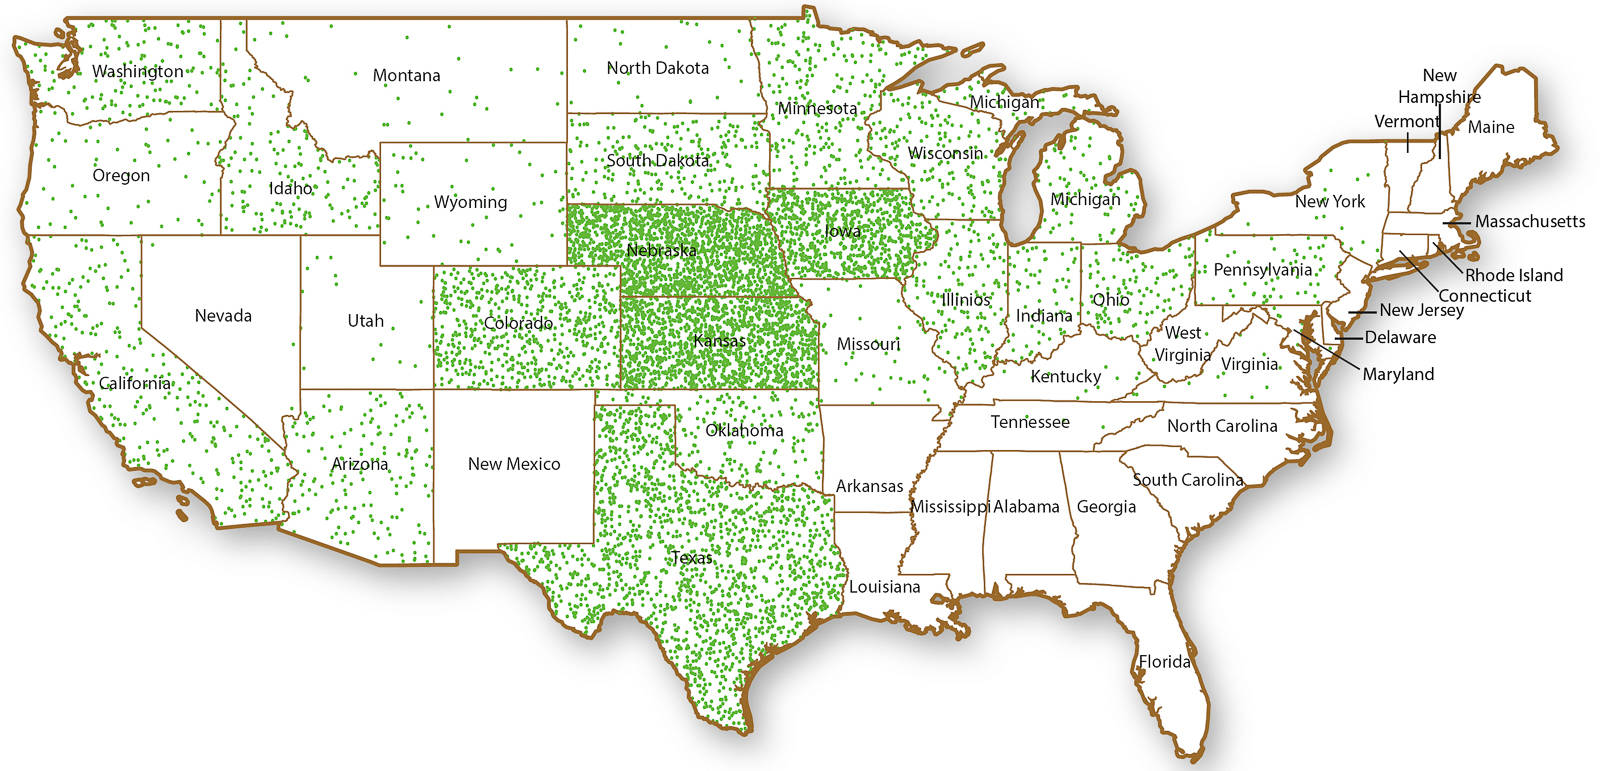
Fig. 2. Dot density plot of cattle on feed, January 1, 2015. Map shows state-level inventory totals with each dot representing 1,500 head. Cattle on feed are defined as those animals being fed a ration of grain, silage, hay or protein supplements and expected to produce a carcass that will grade Select or better. States with few cattle on feed are aggregated into an “other states” category, which accounts for a total of 56,000 head (0.4%). Source: Cattle on Feed Inventory, January 1, 2015. U.S. Department of Agriculture, National Agricultural Statistics Service.
Geographic location may place cattle ranchers in California and other western states at a disadvantage, relative to their counterparts in the Midwest, due to costs of transporting cattle to feeding and processing facilities and, potentially, less competition among buyers to procure western cattle. Indeed, prior work suggests that western ranchers receive lower prices, relative to their midwestern counterparts (Blank et al. 2009). However, no prior research has quantified the magnitude of such discounts as a function of distance from the midwestern hub of feeding and processing, or determined whether lower prices are due solely to spatial factors or also involve buyer market power.
Temporal considerations may also play a role in the prices paid for cattle. Video auctions allow for buyers to procure cattle in advance of taking possession of those animals (i.e., forward contracting). This may be advantageous to buyers who need a steady supply of animals to sell to processors and, as a consequence, they may be willing to pay a premium to secure those animals in advance.
Ranchers can also add value to their cattle by engaging in a wide variety of value-added management practices. In this article, we consider those practices commonly employed by ranchers selling their cattle through Western Video Market Auction (WVM). These include vaccinations, weaning, age and source verification, natural (no implants or antibiotics), and certified Angus beef candidates.
In this paper we investigate spatial, quality and temporal factors impacting the pricing of calves and yearlings in California and the western United States using data from a satellite video auction and a hedonic regression framework.
Research suggests that western ranchers receive lower prices relative to their midwestern counterparts due to costs of transporting cattle to feeding and processing facilities, which are concentrated in the central United States.
Video auctions
Video auctions operate much like a traditional auction, but have the potential to generate a much larger pool of buyers from across the country. Cattle sold in video auctions are located at ranches across multiple states, thus providing an opportunity to analyze sales by producers at different locations, examine spatial pricing patterns and test hypotheses pertaining to regional price differences.
Video auctions provide rich data on the characteristics of cattle offered in lots for sale, making them ideally suited to analyze the marginal valuation of animal characteristics and attributes following the hedonic framework. A possible downside to analysis based on video auction data is a sample selection problem if cattle sold at video auctions are not representative of the cattle inventories in California. For example, Bailey et al. (1991) found evidence that cattle sold on video auctions tended to be higher quality than cattle sold elsewhere.
Relative to prior studies of cattle pricing using a hedonic framework, this study makes a number of contributions: (i) it provides a detailed analysis of the spatial and competitive dimensions of calf and yearling prices that are a central concern to western ranchers; (ii) it isolates the price impacts of forward contracting sales of cattle, finding in most cases that forward contracting earns a seller premium; and (iii) it links a persistent year-to-year variation in the premiums earned for value-added practices to the stage of the cattle cycle.
Empirical model
WVM, headquartered in Northern California, serves as a marketing outlet for cattle ranchers in 16 western states selling approximately 250,000 head of cattle each year. WVM holds live-cattle auctions broadcast via satellite each month except February. WVM provided data on 6,500 lots of steer calves and 8,016 lots of yearling steers sold in all of their auctions held from 1997 through 2013. Steer calves are castrated males that are around 6 months of age and roughly 450 to 600 pounds, while yearling steers are castrated males that are about one year old and usually 800 to 950 pounds. The number of lots sold per year ranged from 154 in 1998 to 530 in 2007 for calves and from 234 in 1997 to 620 in 2005 for yearlings. In total, 888,438 calves and 1,300,440 yearlings were included in the data. Most of our analysis focuses on the most recent 10-year period, 2004–2013. However, the entire 17 years of data were utilized in an analysis of premium variability for value-added practices.
Prices for calves and yearlings were analyzed separately. In both cases, only steers were considered. All calf lots had a flesh score of medium, a frame score of medium or medium-large and average weights in the 500- to 625-pound range. This weight range was chosen to focus on the price effects of management of calves at weaning. Yearling lots had average weights in the 750- to 925-pound range. Lots with animals weighing between 625 and 750 pounds were excluded from the study, as were lots of cattle that included steers and heifers. Lots of Brahman influence, Mexican origin and Holsteins were not included in the analysis given that WVM is not a common sales outlet for these types of cattle.
We utilize a traditional hedonic regression framework to analyze the price per hundredweight (cwt.) received for each lot of cattle. Each lot of cattle, Yi, is defined by its characteristic bundle, Xi = {X1,…,Xn} where X1,…,Xn are characteristics/attributes that collectively define the lot Y. Price, Pi, of product i is specified as a function of its characteristics vector: Pi = f (Xi), or in linear form as

where vi represents a random error term, and the terms represent the marginal effect or value of characteristic j in determining the price of lot Y. The lot-level characteristics/attributes that are controlled for in the model include: (a) the physical characteristics of the lot, including breed, number of cattle in the lot and average per-animal weight, (b) geographic distance from the midwestern sales/processing hub, (c) value-added characteristics and (d) variables to account for temporal effects, including delivery month and whether the lot was sold as a forward contract.
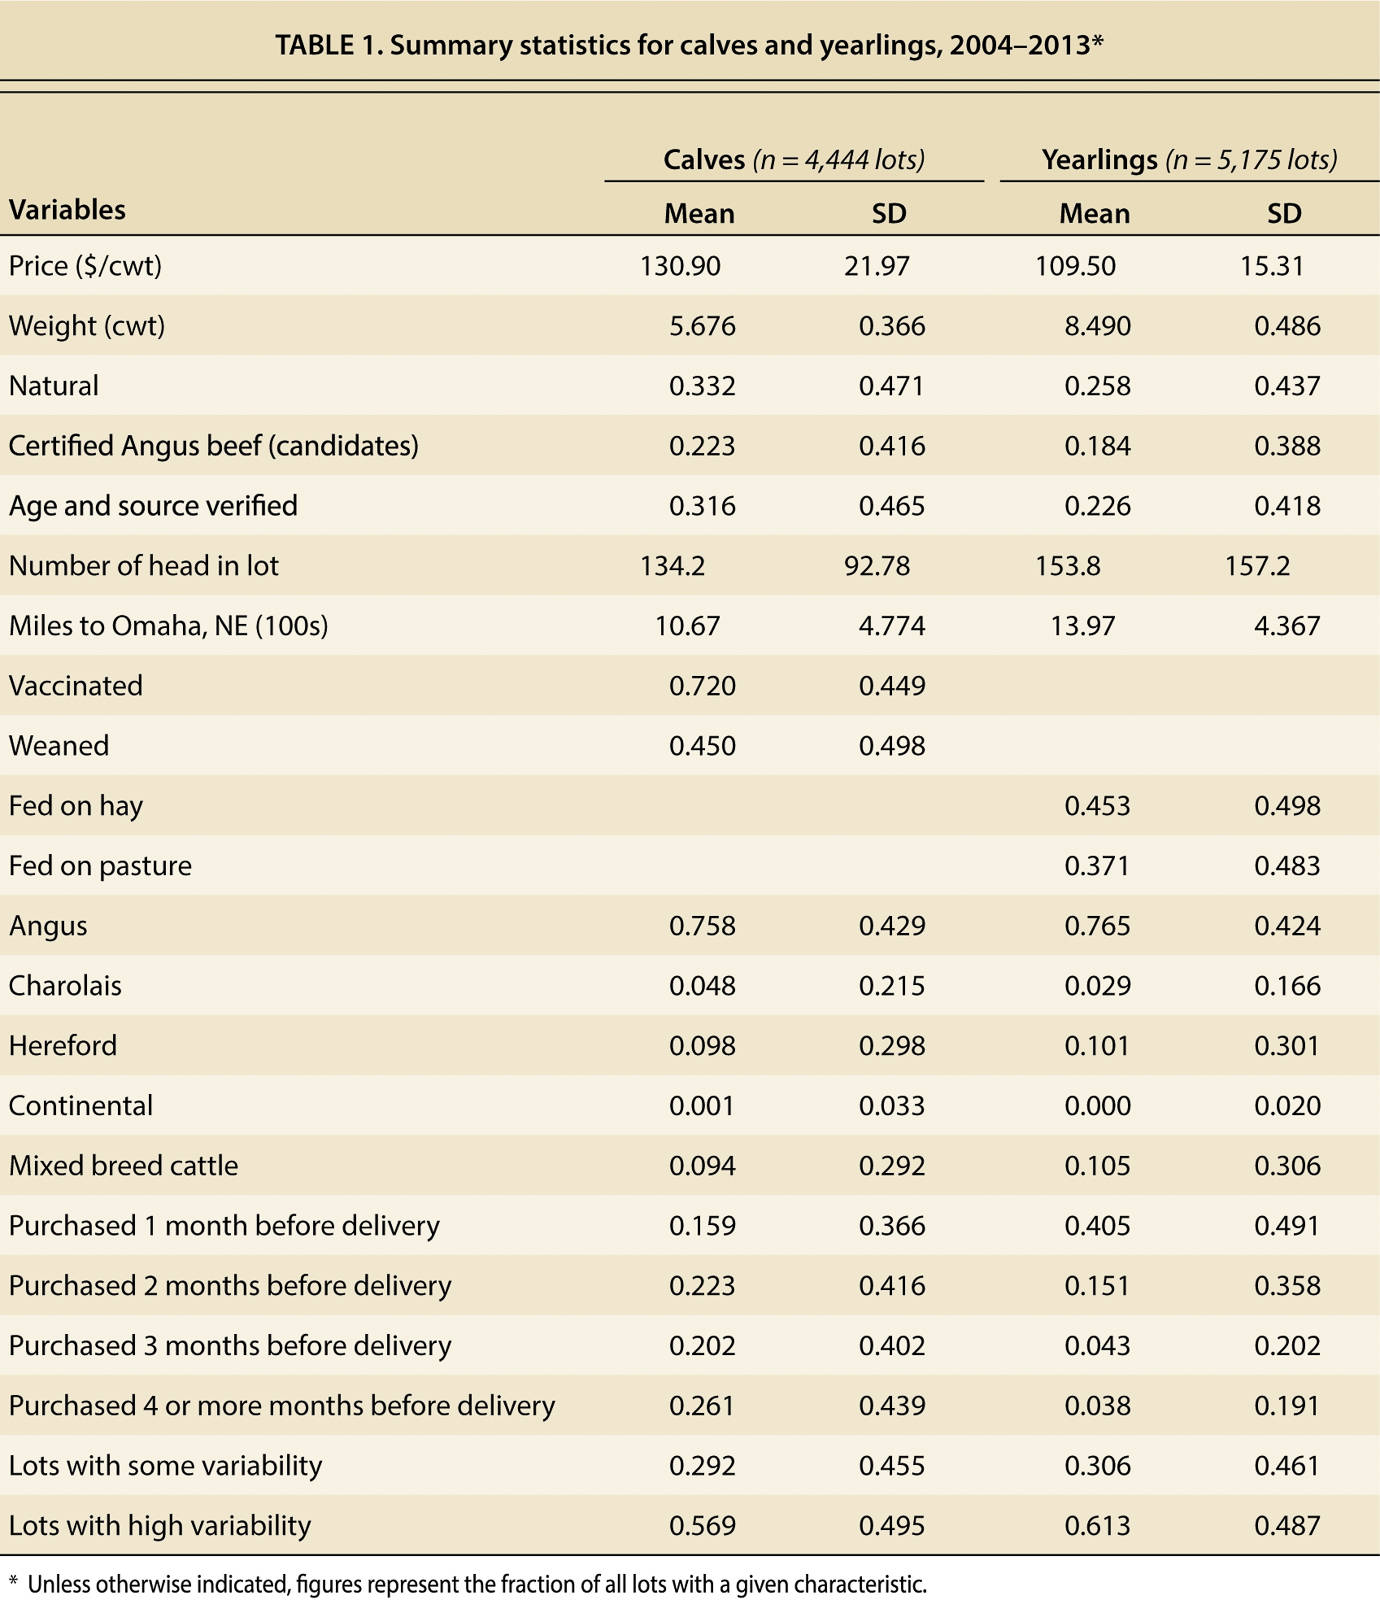
Summary statistics for 2004–2013 are contained in table 1. The distance variable (miles to Omaha, NE) is the driving distance in hundreds of miles from Omaha to the location of the ranch selling the lot of cattle. Based on lot-level auction data, each lot is geocoded and the driving distance from that location to Omaha, Nebraska, is computed using Google Maps. The spatial dispersion of lots sold through the video auction allows us to estimate the degree to which prices for cattle sold in the West are discounted based on their distance from the concentration of feeding and processing capacity. Use of Omaha is consistent with its central location in terms of processing capacity and results of prior research, which has found Nebraska, and Omaha in particular, to be the key hub in price setting for the cattle market (Schroeder 1997; Tomek 1980).
Estimation of separate models for calves and yearlings enables us to specify variables to represent characteristics of lots that are potentially important to determining the value of each type of animal (Anderson and Trapp 2000). However, several indicator variables were common to both the calf and yearling models. The Certified Angus beef indicator variable indicates a steer that is a certified Angus beef candidate. This designation requires that cattle qualify for U.S. Department of Agriculture (USDA) specifications for the Angus Influence by meeting either the genotype (positive identification and traceability to Angus parentage) requirements or the phenotype (appearance of predominantly solid black) requirements.
The Natural variable signifies that the seller certifies the steer has been raised without implants or antibiotics. Age and source verified denotes that the seller is participating in one of two USDA programs (the Process Verified Program or Quality System Assessment Program) intended to provide certification of production practices for buyers primarily targeting export markets.
Premiums for value-added characteristics such as vaccinations, weaning, and age and source verification were factors that influenced bids made by buyers.
Weight and weight squared are the average lot weight per head and its square. These variables test for premiums or discounts related to the size of the steers in a lot. For calves, Weaned is an indicator variable that denotes a steer that has been weaned 30 or more days prior to sale, compared to the baseline of a calf that has not been weaned. Vaccinated is an indicator variable that denotes the lot has received a respiratory vaccine (either two kill vaccines or one modified live vaccine for IBR/BVD/PI3/BRSV).
The model uses fixed effects to control for time invariant price differences across breeds of cattle. Breed fixed effects are included for (i) Angus and other black-hided breeds, (ii) Charolais, (iii) Hereford, (v) Continental and (v) mixed cattle. The share of Angus and black-hided cattle sold via WVM has increased over time while the shares of Herefords and mixed breed cattle have commensurately decreased over the sample period.
For yearlings, the lot characteristics examined also included indicator variables to depict the feeding regimen for the animals in the lot. The variable Fed on pasture denotes steers that had been fed on pasture only, and Fed on hay denotes steers fed on hay only. Each is compared to the baseline of steers fed on both pasture and hay. Steers fed hay may adapt better to feedlot conditions, making such animals more valuable to some buyers.
By comparing the sale and delivery dates, we derived a series of indicator variables to identify forward contracting for 1 month, 2 months, 3 months and 4 or more months, with the baseline being cash sales (lots delivered the same month as the sale). These variables enable us to conduct tests for premiums or discounts associated with forward contracting sale for immediate delivery.
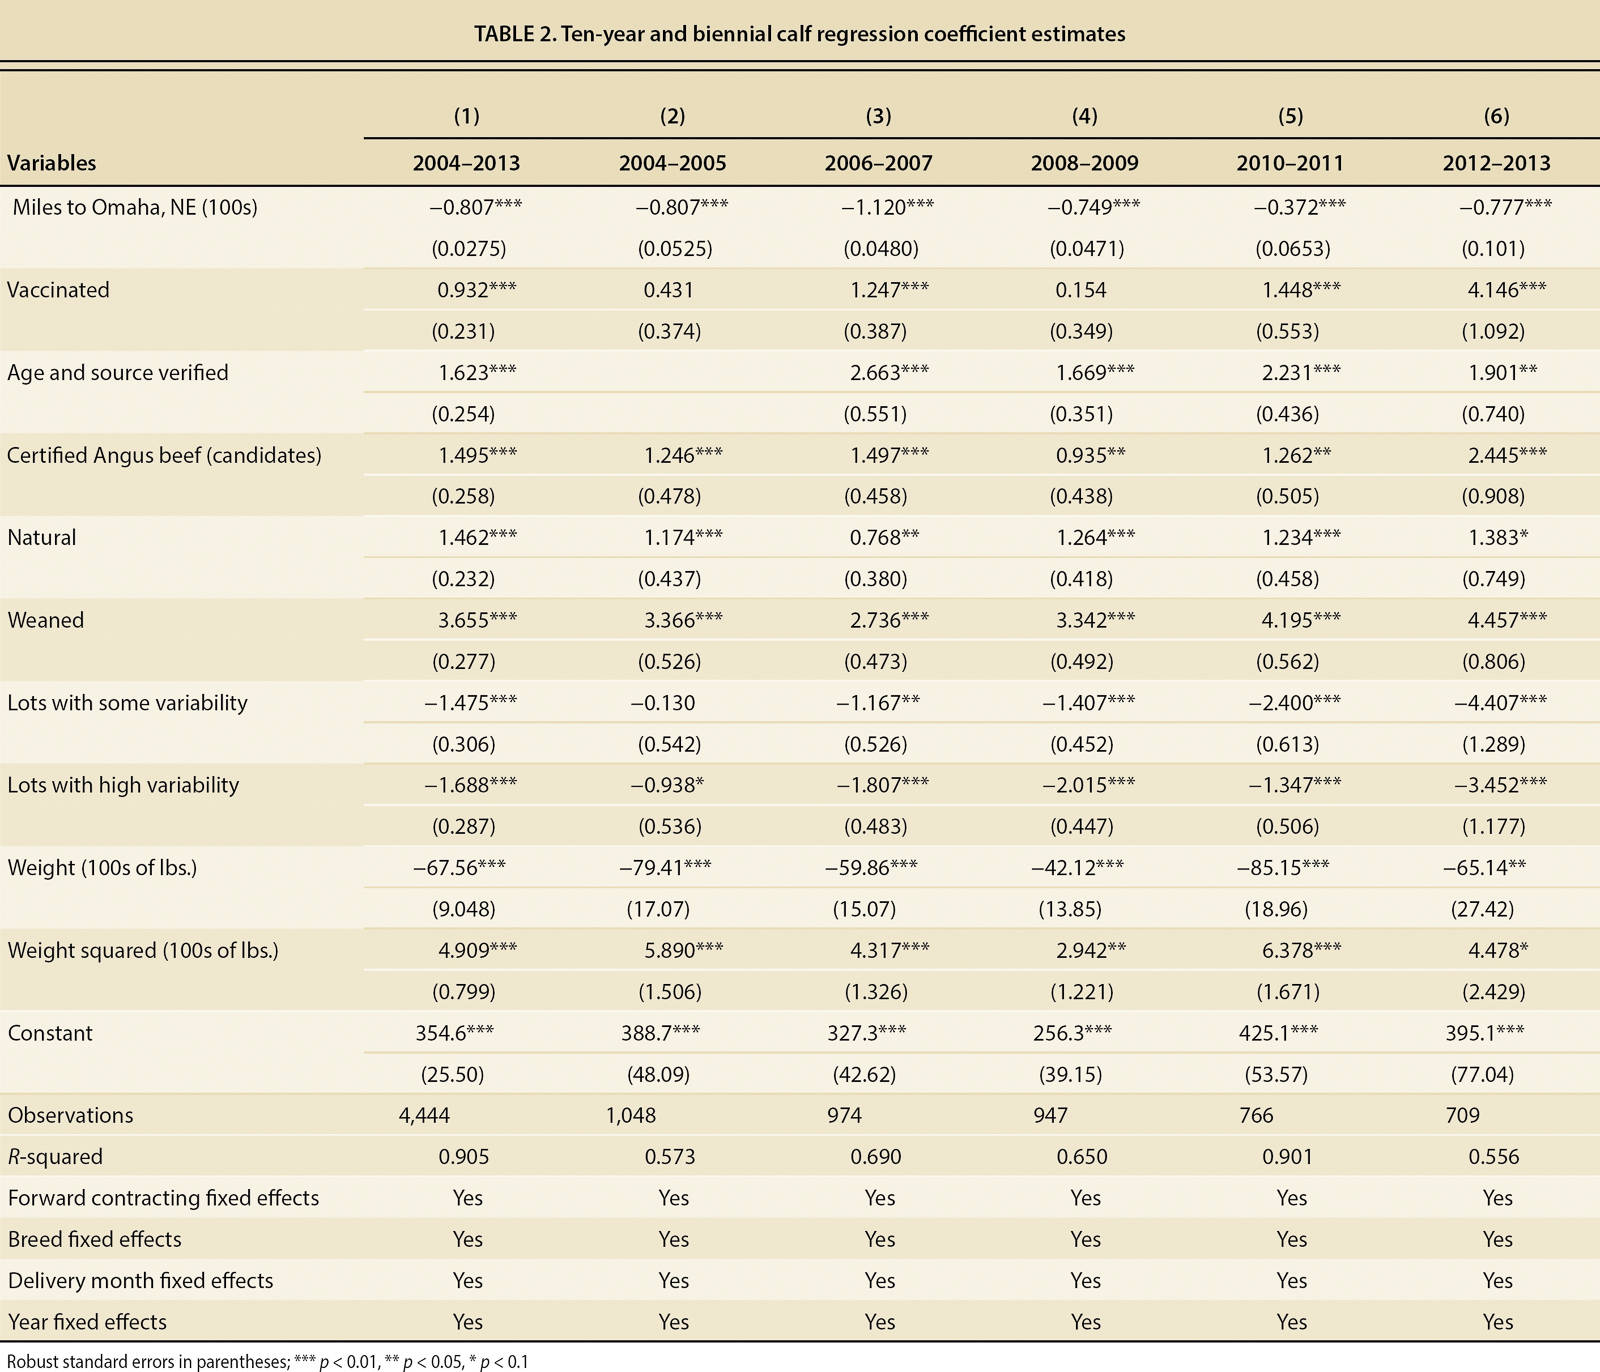
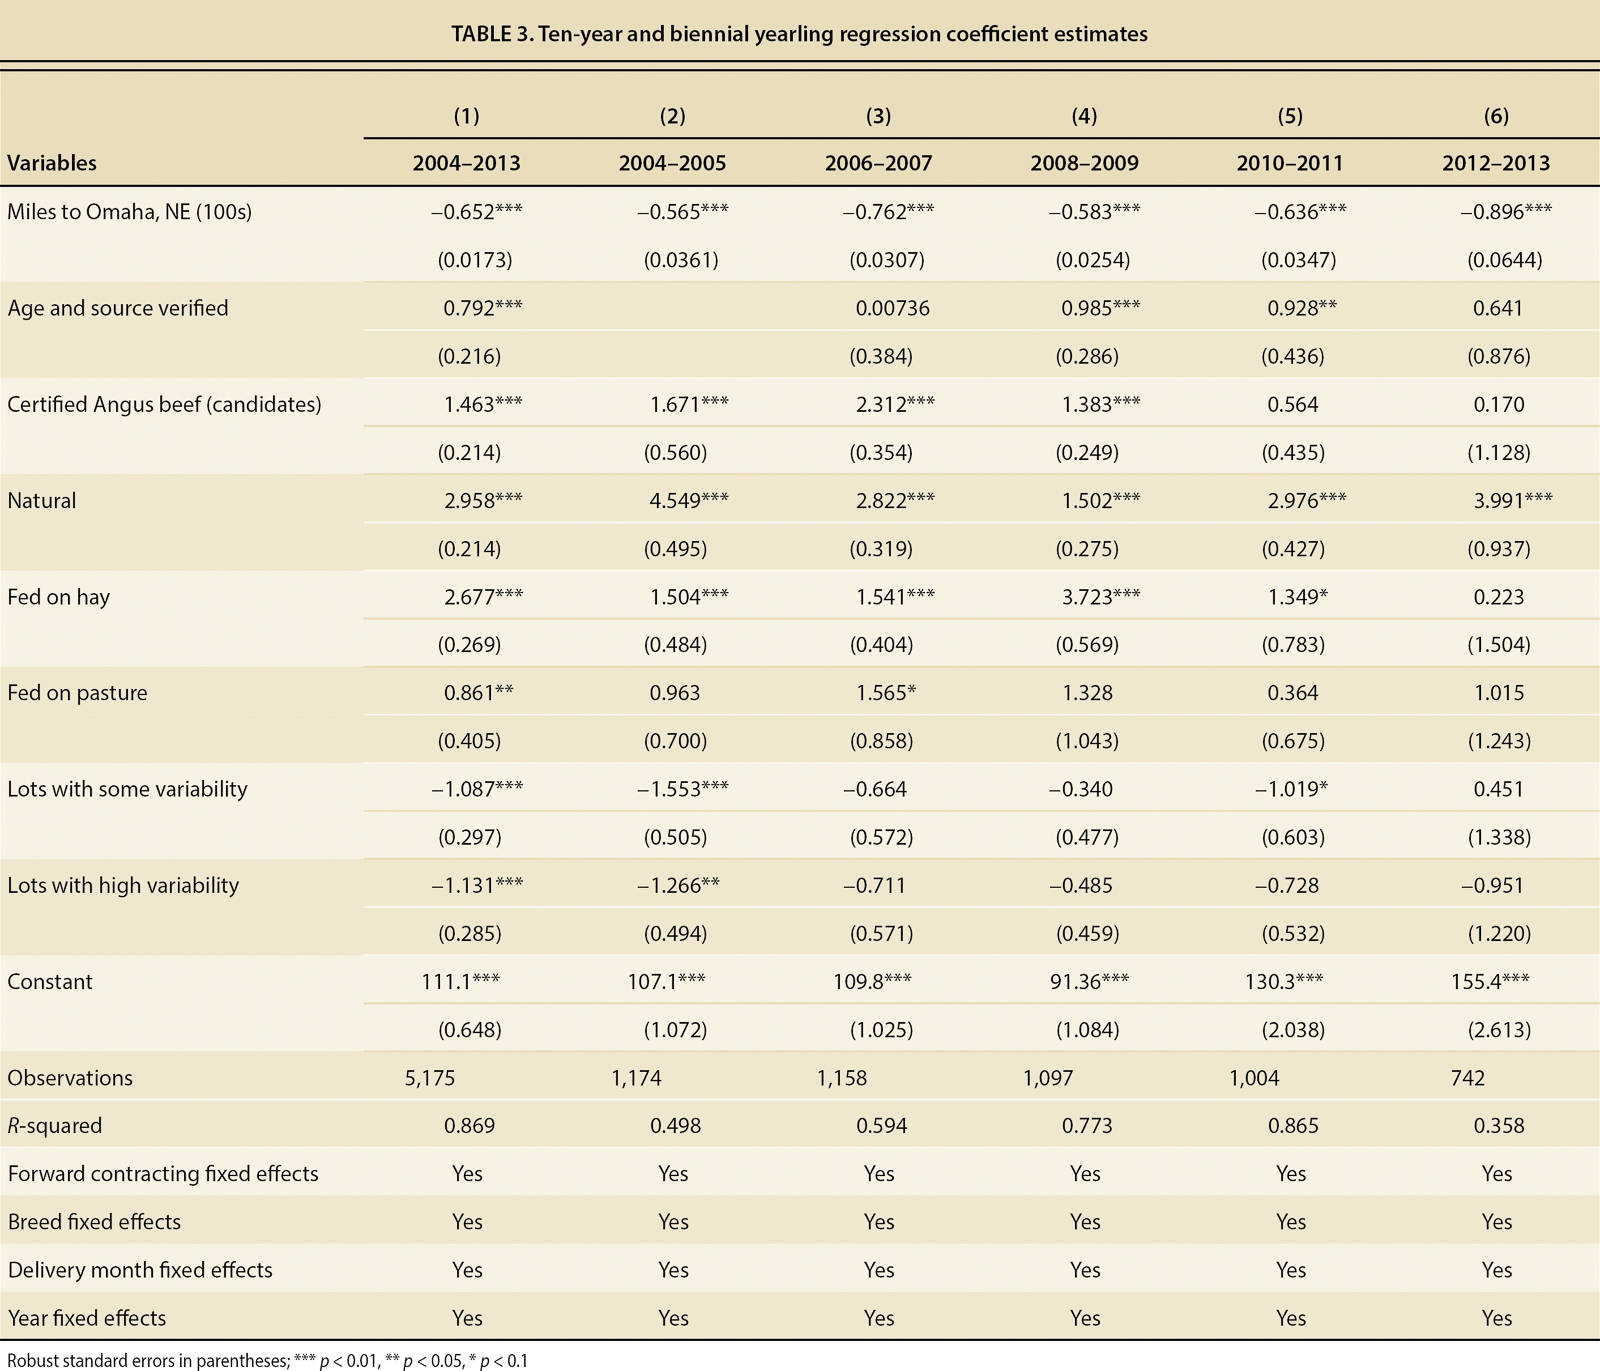
In addition to the full 10-year period from 2004 to 2013, results are reported for each 2-year interval within that time span. Regression results for calves and yearlings are provided in tables 2 and 3, respectively.
Impact of distance
The variable Miles to Omaha was statistically significant at the 0.01 level in each of the calves and yearlings regressions. In the calf price equation, the coefficient on Miles is −0.807 over the full 10-year period, indicating that the price received by ranchers over the sample period was discounted by about 81 cents per cwt. for each 100 miles the calves were located from Omaha, Nebraska, other factors constant. The estimated effect of distance was somewhat smaller for yearlings — a coefficient of −0.652 or a discount of 65 cents per cwt. per 100 miles from Omaha. With one exception, the 2010–2011 calves regression, the coefficient on Miles was relatively stable across the biennial regressions. These estimates confirm that ranchers that are selling cattle farther away from the concentration of processing capacity in the midwestern United States are receiving discounted prices. Even if western cattle are not shipped directly to the Midwest and instead go to stocker operations or feedlots located elsewhere, most of these cattle must eventually travel to the Midwest for processing, and thus buyers at these intermediate market stages pay less for western cattle, recognizing that the prices they receive subsequently for sales to processors will be discounted by transportation costs, shrink and mortality associated with shipments to the Midwest.
A clearer sense of the impact of spatial discounts is obtained by examining the impacts of Miles in major ranching areas located at different distances from Omaha. To make this comparison, we use coefficient estimates from the most recent biennial model (2012–2013) to compare to shipping costs quoted in 2015. For example, Redding, California, is located 1,642 miles from Omaha. Our results suggest that a lot of calves based in Redding sold for $12.76 less per cwt. in 2012–2013 than a comparable lot located near Omaha.
The discount for yearlings was $14.71 per cwt. Based on information from industry sources, actual transportation costs from Redding to Omaha during this time were about $11.97 per cwt., based on a load cost of $3.50 per mile.
A key consideration is how tightly linked our estimates of spatial discounts are to actual shipping costs. The tighter this relationship, the stronger the evidence that western ranchers are experiencing discounts in the prices they receive that are consistent with free-on-board (FOB) pricing. FOB pricing, where the seller is responsible for shipping costs, either explicitly or implicitly in the form of a price discount, is the only pricing structure that is consistent with competitive procurement. Alternative pricing schemes (e.g., those that include “freight absorption,” where the buyer assumes some or all of the shipping costs) discriminate against those sellers that are closer to the buyer in favor of those who are further away. Spatial price discrimination cannot survive under competitive procurement because sellers disfavored under one buyer's discriminatory pricing plan would receive better offers from competing buyers. The estimated actual shipping cost lies within the 95% confidence interval of the price discount for both calves and yearlings and is thus supportive of an FOB pricing structure for feeder cattle in the West and is consistent with, but not conclusive of, a competitive procurement market. Thus, these results suggest that the discounts that we observe are due to transportation costs and are unlikely to be the result of downstream buyers (e.g., feeding operations) exercising buyer power to depress prices.
Absent the establishment of new processing facilities in the West, these results suggest that western ranchers face a chronic disadvantage in price relative to their counterparts in the Midwest.
Impacts of forward contracting
The coefficients on the variables estimating the impact of forward contracting were positive and statistically significant at the 0.01 level in each instance in the 2004–2013 models for both calves and yearlings. Most coefficients in the biennial models are also positive and significant.
The coefficients themselves, however, do not provide estimates of the premiums or discounts associated with forward contracts versus spot sales. Forward-contracted cattle are sold based upon their anticipated weight at delivery. We thus needed to compare the forward-contracted auction price to an estimate of the price the forward-contracted lot would have received if it had been sold at video auction in its delivery month.
On average, seller-offered forward-contracted cattle sell at a premium, relative to lots sold spot.
To make this comparison, we first computed the predicted price for each forward-contracted lot in the data set using the pooled 2004–2013 model and then computed the predicted price for the same lot if it had been sold as a “spot” transaction in its delivery month. This approach allows the analysis to incorporate month and, in some cases, year fixed effects that account for seasonal and other inter-temporal effects in the market. For example, August is a comparatively high-price month for calves, and October is a low-price month, so figuratively “reselling” a lot of calves in October that were in reality sold in August for delivery in October (that is, a 2-month forward contract) enables us to control for these temporal effects, thereby focusing solely on the price impact due to forward contracting. The difference between the actual predicted price for a lot and its predicted price for a spot sale in the delivery month represents the estimated premium or discount received from forward contracting the lot.
The results from this analysis of forward contracting are presented in table 4. Forward-contracted calves and yearlings each earned a price premium on average for each of the four possible contract lengths. For calves the average premium ranged from $1.57 per cwt. for a 1-month forward contract to $2.90 for 4 or more months. For yearlings the range was $0.72 for a 1-month forward contract to $2.31 for 4 or more months. There is, however, considerable variation in the estimated premiums, as reflected in the standard deviations reported in table 4. Such variability in the premiums is likely due to unanticipated changes in market conditions and price expectations between the sale and delivery month.

On balance, these results provide rather strong evidence that a premium existed on average for seller-offered forward-contracted calves and yearlings over this time period. The ability to lock in a sale or purchase at a fixed price is beneficial to both buyers and sellers, depending upon each party's aversion to risk. Beyond simple risk aversion, however, downstream buyers also benefit from guaranteeing in advance a supply of cattle to their facilities, which is a crucial factor in determining their operating efficiency and unit cost. Given downstream buyers’ clear incentive to lock in supplies of cattle, it should not be surprising to find that, on average, they pay a price premium on forward-contracted cattle, thereby providing an opportunity for sellers to gain a price premium relative to spot sales.
Premiums for value-added characteristics
Table 2 contains results on quality and management variables that attract price premiums for calves. For calves, weaning is a very important practice that generated an estimated premium of $3.66/cwt. over the 10-year period; the premium was relatively stable across each of the five biennial regressions. Our estimates are smaller than those of Schumacher et al. (2012) ($5.35/cwt.) and Williams et al. (2014) ($5.23/cwt.) but consistent with Zimmerman et al. (2012) ($3.47/cwt. in 2010). Certified Angus beef candidates earned an average premium of $1.50/cwt. over and above the premium afforded black-hided cattle that were not part of the program. Operator certification of Natural beef earned a consistent premium over the 10-year period, with a coefficient of $1.46/cwt. in the pooled model. Age and source verified resulted in an average premium of $1.62/cwt., and was quite consistent across the biennial regressions. Vaccinated earned a smaller average premium of $0.93/cwt., but this premium was highly variable across the biennial regressions.
Variability of flesh and frame of cattle in a given lot earned a consistent discount, with little difference in the discounts across moderate- and high-variability lots at $1.48/cwt. for lots with some variability versus $1.69/cwt. for lots with high variability. This is consistent with the findings of Zimmerman et al. (2012) that lots classified as very uneven were discounted $1.67/cwt. These discounts were relatively stable for the first four biennial models, but were dramatically higher for the 2012–2013 model.
Throughout the weight range specified in the data for calves, 500–625 pounds, larger animals received a lower price ceteris paribus throughout the weight range in the data. Smaller calves generally have a greater opportunity for weight gain and, thus, profit potential, ceteris paribus.
The results for yearlings in table 3 reveal a slightly smaller average premium for Certified Angus beef as for calves of $1.46/cwt., but the premium is much more variable in the biennial regressions for yearlings and is not statistically significant in the 2010–2011 and 2012–2013 models. Ranchers who certified that their yearlings were raised Natural earned a substantial premium on average of $2.96/cwt., although the premium varied considerably in the biennial models. Age and source verified earned a smaller average premium, $0.79/cwt., compared to the premium afforded calves, and the premium failed to attain statistical significance in two of the biennial regressions.
Feeding practices for yearlings yielded somewhat ambiguous results. Fed on hay earned a statistically significant premium of $2.68/cwt. compared to the baseline of a yearling fed on both hay and pasture, but this premium was highly variable in the biennial models. Yearlings fed solely on pasture also, and somewhat paradoxically, earned a small premium (even though this is likely a less expensive way to add weight), although this premium was not statistically significant in four of the five biennial models.
Variability in lots of yearlings was penalized by price discounts that were very similar in magnitude to those for calves. The discounts tended to be similar in magnitude for moderate and high variability.
Assessing variability in premiums
As noted, coefficients for many of the value-added attributes of calves and yearlings exhibit considerable variability across the biennial regression models in tables 2 and 3. Given that cattle prices have changed considerably over the time period of our sample, we also considered these premiums as a percentage of the average price for cattle sold during that time period as a robustness check. Use of percent premiums essentially deflates the dollar-value premium by the average sales price in each of the biennial models. The percent premiums, however, still display considerable inter-temporal variation. Similar variability in coefficients has been found in other studies (e.g., Zimmerman et al. 2012). In order to confirm that the variation in the marginal valuations of the value-added attributes are statistically significant, we estimated a “restricted” version of our standard regression specification wherein the coefficient estimate is the average premium for that characteristic over the sample period (2004–2013). We then estimated an “unrestricted” model wherein we allow the estimate of the value-added attribute to change in each year of the sample and then used an F-test to compare the coefficient estimates across the restricted and unrestricted models. This procedure confirms that the annual coefficient estimates are significantly different from the coefficient estimate in the restricted model (i.e., the average premium for the entire sample period). Thus, we went on to test the hypothesis that at least some portion of this variability is due to stages of the cattle cycle and in particular the hypothesis that during periods when cattle inventories are high, buyers will be less motivated to bid up to their valuations for particular lots.
In order to test this hypothesis, we used the estimated regression coefficients for Age source verified, Certified Angus beef, Natural and Vaccinated from a set of annual models (1997–2013) as the dependent variable of the model. The key explanatory variable in this analysis was the USDA's January estimate of U.S. cattle inventory. Also included in the model are year fixed effects to control for demandside factors that may be influencing some of the variation in value-added premiums. In the peak stages of the cattle cycle, cattle inventory numbers are large. Accordingly, price is lower due to the supply effect. Our research question was whether premiums for value-added practices were also reduced during the peak of the cycle.
We found that the level of Cattle inventory was negatively associated with the price premiums earned for value-added practices and statistically significant (at the 0.10 level). Thus, an additional million head of cattle in inventory is estimated to reduce value-added premiums paid by $0.08 to $0.09/cwt., on average. When bidders perceive cattle to be plentiful (i.e., inventories are high), they are less likely to bid their full valuations for any given lot of cattle. Alternatively, when bidders perceive cattle inventories to be low, they are more likely to bid up lots of cattle in order to secure animals with the necessary characteristics to fulfill the demand of downstream buyers.
Implications for western ranchers
The importance and potential usefulness of hedonic pricing models for live cattle to industry participants and advisors is enhanced by the growing set of variables that may add to or detract from an animal's value and by the presence of satellite video auctions that acquire and maintain detailed records on characteristics of the lots of cattle sold under their auspices.
To our knowledge, this study is the first to isolate the presence of price premiums for seller-offered forward contracts at video auctions. Although the premiums exhibited considerable variability, they were positive on balance and the coefficients supporting the premiums were statistically significant for most of the forward contracts considered. This result is consistent with the well-known desire of downstream buyers to lock up commitments of cattle to ensure operation of their facilities at efficient capacity. Further, this is also the first study we are aware of that has linked variability in the premiums paid by buyers for value-added management attributes to stages of the cattle cycle.
In summary, our results suggest a chronic locational disadvantage for western ranchers relative to counterparts in the central part of the country due to the paucity of feeding and processing capacity in the West, with little hope for gaining new capacity in the near term. This disadvantage heightens the imperative for western ranchers to be on the forefront of adopting practices that can add value to their cattle. In that regard, we hope this study, through identifying and quantifying premiums associated with forward contracting and value-added production and management practices, can help western ranchers and their advisors obtain maximum value and return from their operations.
Calf and yearling prices in California and the western United States

