


All Issues
On-farm flood capture could reduce groundwater overdraft in Kings River Basin
Publication Information
California Agriculture 70(4):200-207. https://doi.org/10.3733/ca.2016a0018
Published online November 16, 2016
Abstract
Chronic groundwater overdraft threatens agricultural sustainability in California's Central Valley. Diverting flood flows onto farmland for groundwater recharge offers an opportunity to help address this challenge. We studied the infiltration rate of floodwater diverted from the Kings River at a turnout upstream of the James Weir onto adjoining cropland; and calculated how much land would be necessary to capture the available floodwater, how much recharge of groundwater might be achieved, and the costs. The 1,000-acre pilot study included fields growing tomatoes, wine grapes, alfalfa and pistachios. Flood flows diverted onto vineyards infiltrated at an average rate of 2.5 inches per day under sustained flooding. At that relatively high infiltration rate, 10 acres are needed to capture one CFS of diverted flood flow. We considered these findings in the context of regional expansion. Based upon a 30-year record of Kings Basin surplus flood flows, we estimate 30,000 acres operated for on-farm flood recharge would have had the capacity to capture 80% of available flood flows and potentially offset overdraft rates in the Kings Basin. Costs of on-farm flood capture for this study were estimated at $36 per acre-foot, less than the cost for surface water storage and dedicated recharge basins.
Full text
California's Central Valley accounts for roughly 10% of U.S. agricultural production: $45 billion in 2014 (CDFA 2015; USDA 2016). The region faces two major hydrologic issues: severe and chronic groundwater overdraft, and flood risks from winter storms. Climate models suggest the Central Valley's droughts and floods will continue (Reclamation 2011, 2014), raising, for researchers, growers and other stakeholders, an interesting challenge: can groundwater overdraft be reduced and flood risks mitigated by diverting floodwaters onto agricultural lands for groundwater recharge?
Groundwater makes up 30%, 38% and 54% of total water demand in the Sacramento River, San Joaquin River and Tulare Lake hydrologic regions, respectively (DWR 2013). From 2005 to 2010, between 5.5 and 13 million acre-feet (MAF) of storage was lost in the Central Valley aquifer (DWR 2013), and San Joaquin Valley groundwater levels are more than 100 feet below previous historic lows (DWR 2014).
Most models predict more variation in average precipitation for California watersheds (Reclamation 2011, 2014), likely resulting in earlier snowmelt, more precipitation as rain, and increased frequency of extreme events, including droughts and floods. Earlier and more extreme runoff events are expected (DWR 2003; Hayhoe et al. 2004; Thorne et al. 2012), which will challenge the ability of California's water infrastructure to efficiently capture and convey sufficient water to meet municipal, agricultural and environmental water needs (DWR 2013). Diverting flood flows for groundwater recharge, a process known as on-farm flood capture, is considered an important tool for coping with more-variable future precipitation (DWR 2013; Langridge et al. 2012; Tetra Tech 2011).
Irrigation districts and water agencies are considering on-farm flood capture as a tool for increasing groundwater resources and managing increasingly variable precipitation due to climate change.
Kings River Basin
Our study looked at on-farm flood capture project in the Kings River Basin. Like the rest of the Central Valley, agricultural production in the area relies heavily on surface water supplies and groundwater to meet crop water needs. The Kings River Basin requires 2.7 MAF to meet irrigation demand. WRIME (2007) calculated a water budget for the Kings Basin from 1964 to 2004. Surface water deliveries to this area varied annually, ranging from about 0.3 to 1.5 MAF (WRIME 2007). Groundwater supplied 1 to 2.2 MAF, or about 60% of total water demand, resulting in an average 0.16 MAF annual overdraft (WRIME 2007). A more recent study found that, from 2003 to 2013, groundwater storage decreased 0.23 MAF annually (KRCD 2013).
Ironically, recurring floods along the Kings River corridor also impact the area. Over the 44-year U.S. Geological Survey (USGS) period of record (fig. 1; 1947–1954, 1973–1974, 1976–2009), 8.5 MAF of surplus flood flows have passed through the James Bypass, a man-made flood channel with a design capacity of 4,750 cubic feet per second (CFS) that is the continuation of the North Fork of the Kings River to the Mendota Pool and the San Joaquin River. These surplus flood flows are defined as unclaimed flood flows that are both hydrologically and legally available. Under normal operation the James Bypass is dry and hydrologically disconnected from the San Joaquin River (Reclamation 2005). Under high flow conditions, the U.S. Army Corps of Engineers diverts Kings River water into the North Fork-James Bypass channel at Crescent Weir (map below).
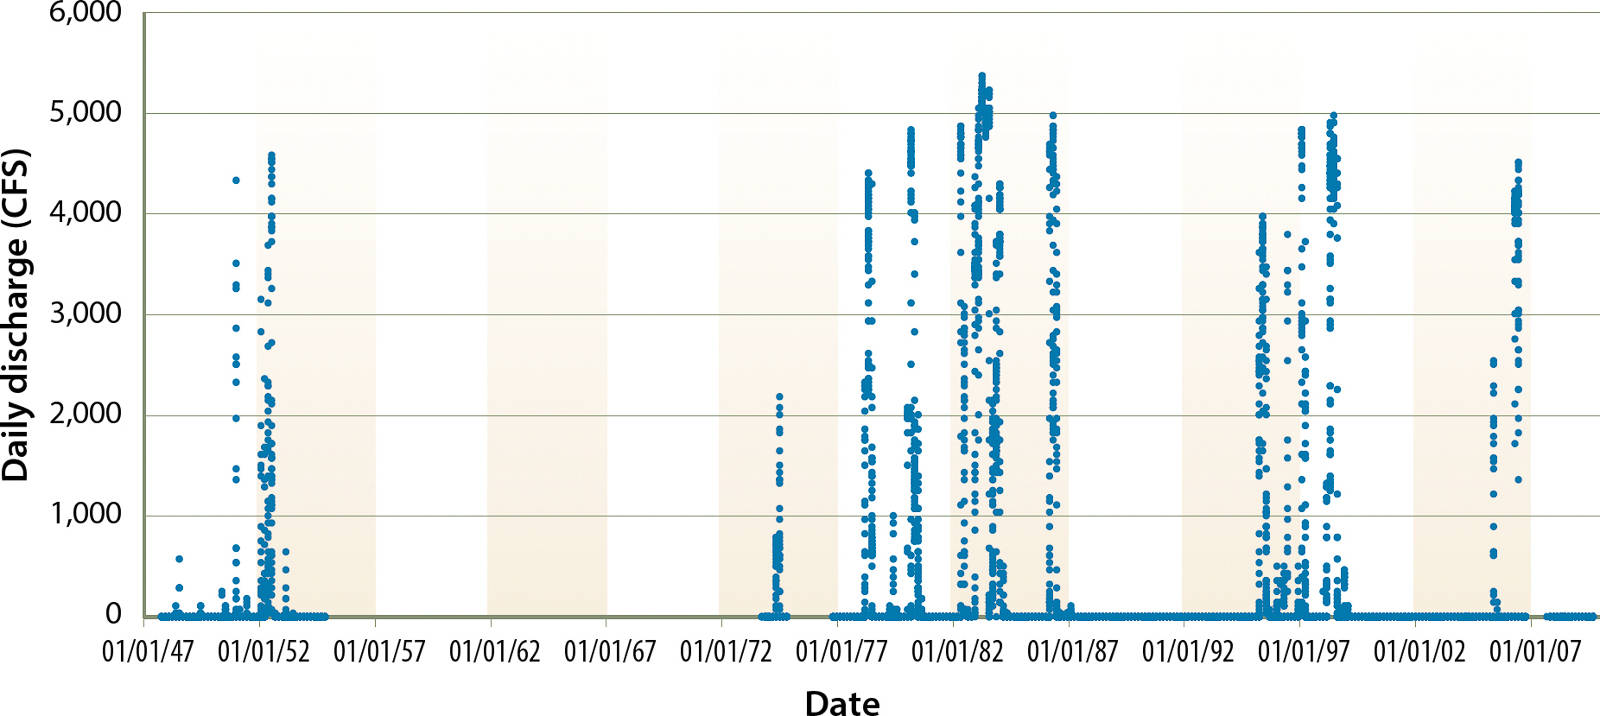
Fig. 1. Flows in excess of 100 CFS generally only occur in the James Bypass during flood flow conditions, and at those times they are managed to not exceed the channel design target of 4,750 CFS. Flood flows have a recurrence interval of 2 years and vary greatly in magnitude, at times exceeding the channel design capacity. Periods in which no data are shown do not have available or approved data. Source: USGS 2010.
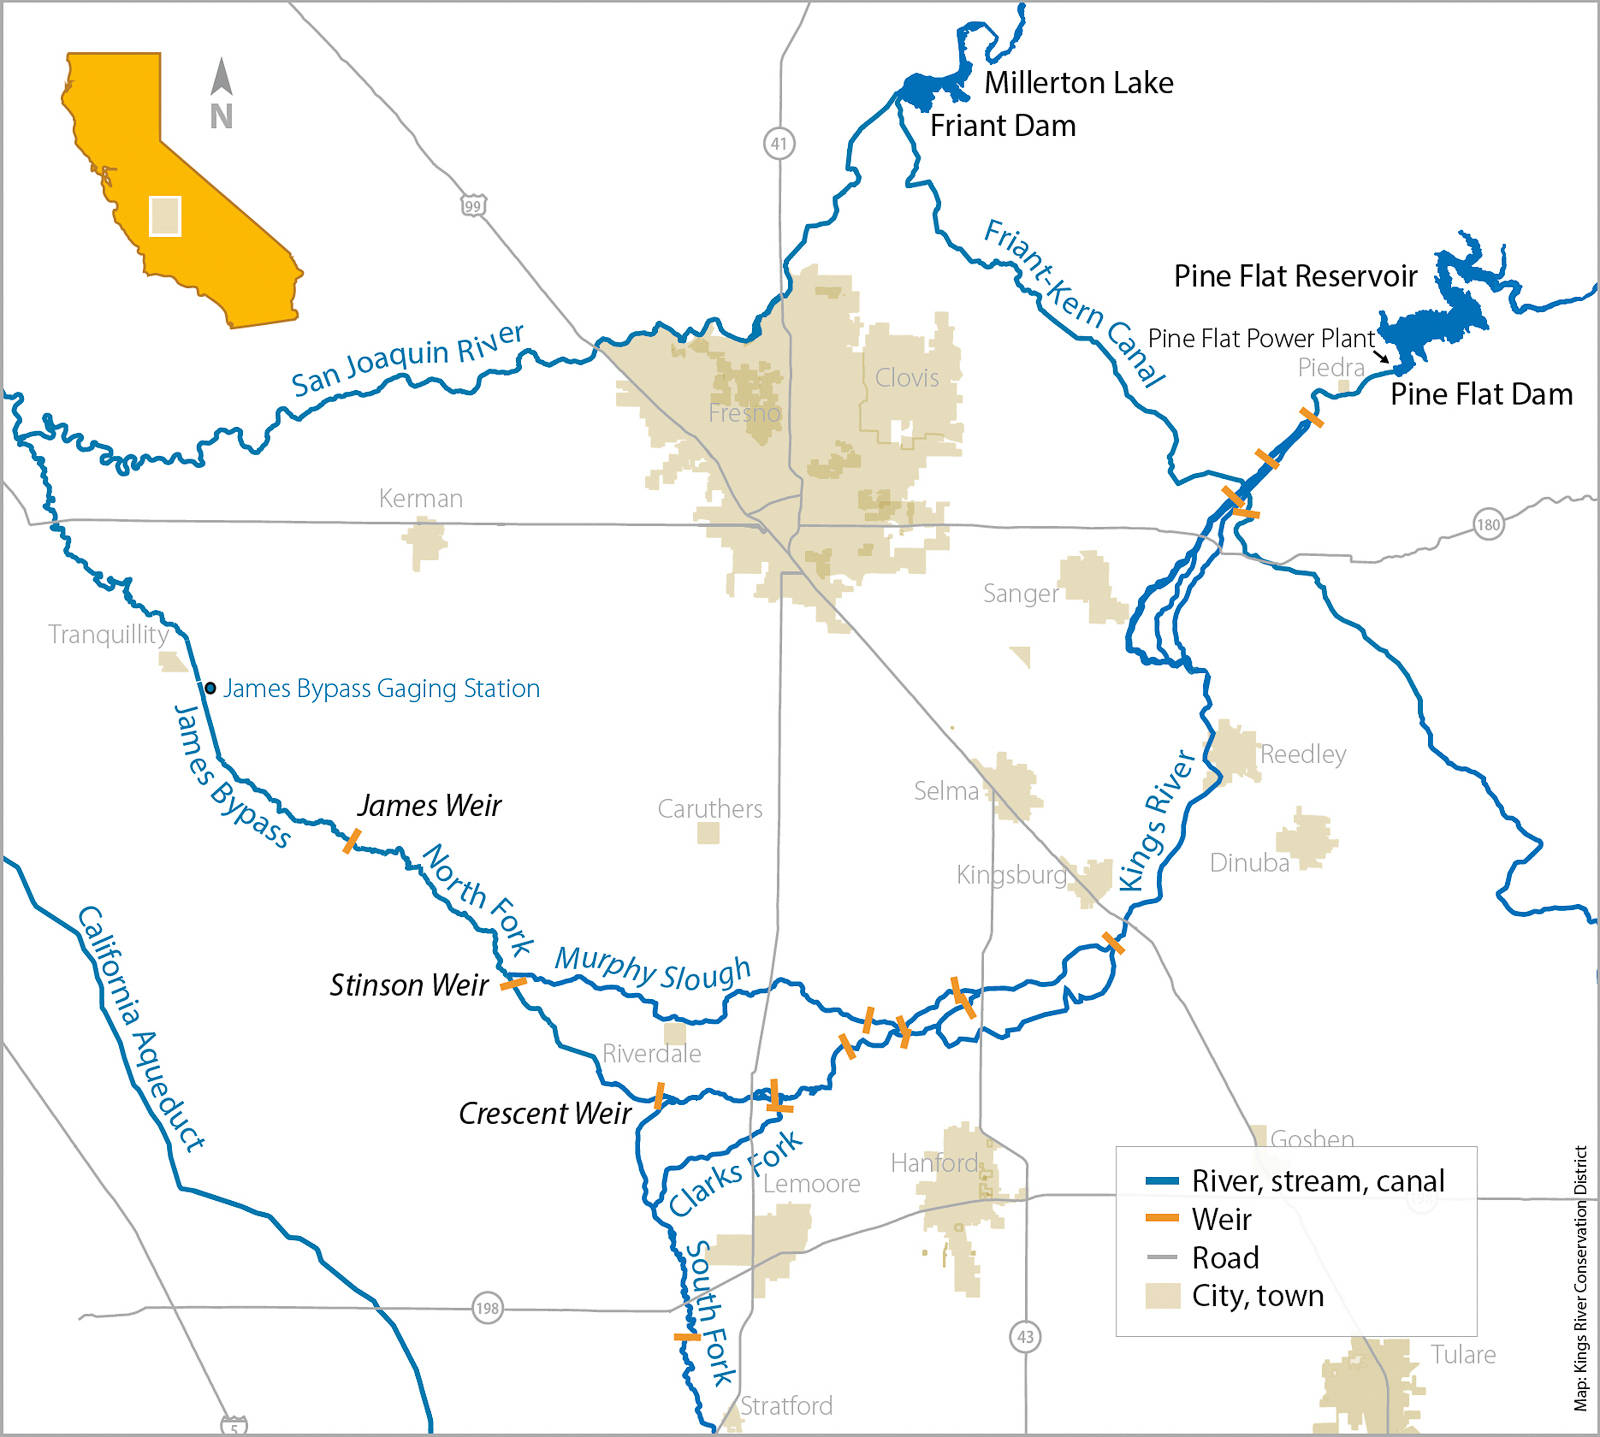
Under high flow conditions, Kings River water is diverted into the North Fork-James Bypass channel at Crescent Weir (bottom). Source: KRCD and KRWA 2009.
Since 1983, flood damages in communities along the Kings River and the downstream San Joaquin River are $1.4 billion (2013 dollars) (Bachand et al. 2013; Reclamation 2005; USACE 1999). These floods have occurred despite joint management of upstream Pine Flat Reservoir and the river and drainage network by Kings River Water Association and the Army Corps of Engineers (i.e., diversions, bypasses, etc.) for flood control and water supply (KRCD and KRWA 2009; Reclamation 2005). That management protocol provides guidance for flow management, including when flows exceed the design capacity of system levees and channels, and requires under very high flow conditions that flows be sent down the James Bypass in excess of the channel design capacity (fig. 1; Reclamation 2005).
Irrigation districts are contemplating or have implemented recharge basins to capture available flood flows to increase groundwater resources (WRIME 2006a). Average surplus flood flows through the James Bypass during years in which (flood) flows occurred have been nearly 2,000 CFS, corresponding to a median capture of 0.18 MAF during those years. Those rates exceed annual groundwater overdraft rates for those specific years (WRIME 2007). However, these considered projects and other engineered solutions (e.g., recharge using irrigation canals) rely upon dedicated public or private lands (WRIME 2006a, 2006b), limiting flexibility and capacity.
Over the last two decades, Kings River Basin growers and landowners have worked with the Kings River Conservation District (KRCD), Kings River Water Association (KRWA) and other water agencies to explore and develop recharge strategies and facilities. Engineered recharge basins on 67 dedicated acres were proposed near the James Bypass that would be designed to capture up to 800 acre-feet of flood flows monthly, providing roughly 2,000 acre-feet annually of in-lieu recharge (groundwater conserved by surface water being used in lieu of pumping groundwater) and dormant flooding (flooding when crops are dormant) (KRCD 2000, 2006). Several public agencies began developing a regional conjunctive use program (combined management of surface water and groundwater) as part of the Kings Basin Integrated Regional Management Plan (IRWMP), completed in December 2006 with the publication of the Kings Basin Conjunctive Use Feasibility Analysis (WRIME 2006b). It recommended acquiring 2,600 recharge acres to capture flows of 660 CFS. Expanding into farmlands would significantly increase the recharge area available to help achieve the maximum potential recharge (RMC 2015).
Under this project, we studied the 2012 diversion of surplus flood flows onto agricultural lands at a turnout upstream of James Weir (fig. 2). Our goals were to (1) determine infiltration rates under a recharge condition on agricultural fields and assess likely groundwater quality impacts, (2) assess farm-scale implications for implementing on-farm flood capture, including the compatibility of land management for crop operations and for flood flow capture, and (3) estimate its costs. The study did not consider other considerations regarding resource management strategies as related to capturing flood flows (KBWA 2012; e.g., groundwater for drinking water; regional infrastructure, conveyance, coordination and integration; relationship to local water planning and regulation) or broader water rights issues regarding flood flows in the Central Valley.

Fig. 2. Groundwater gradients in the Kings River Conservation District Groundwater Focus Area (KRCD 2013) in 2012 and the location of the McMullin Project. Contours are depth (in feet) to groundwater.
Field tests
Field tests were conducted on an annual crop (tomatoes) and perennial crops (wine grapes, pistachios and alfalfa). Methods are presented in detail by Bachand et al. (2012, 2014). In brief, flows of 2 to 22 CFS were diverted via the turnout into a private irrigation canal in January and then from April to early July. Through a combination of permanent and temporary infrastructure, flows were distributed to experimental study checks and demonstration fields across 1,000 acres of Terranova Ranch, which is an approximately 6,000-acre farm. The flow diversions were for both direct (from the surface to groundwater) and in-lieu recharge. Flows in the James Bypass were in the 2,000 to 4,500 CFS range during this period (fig. 3).
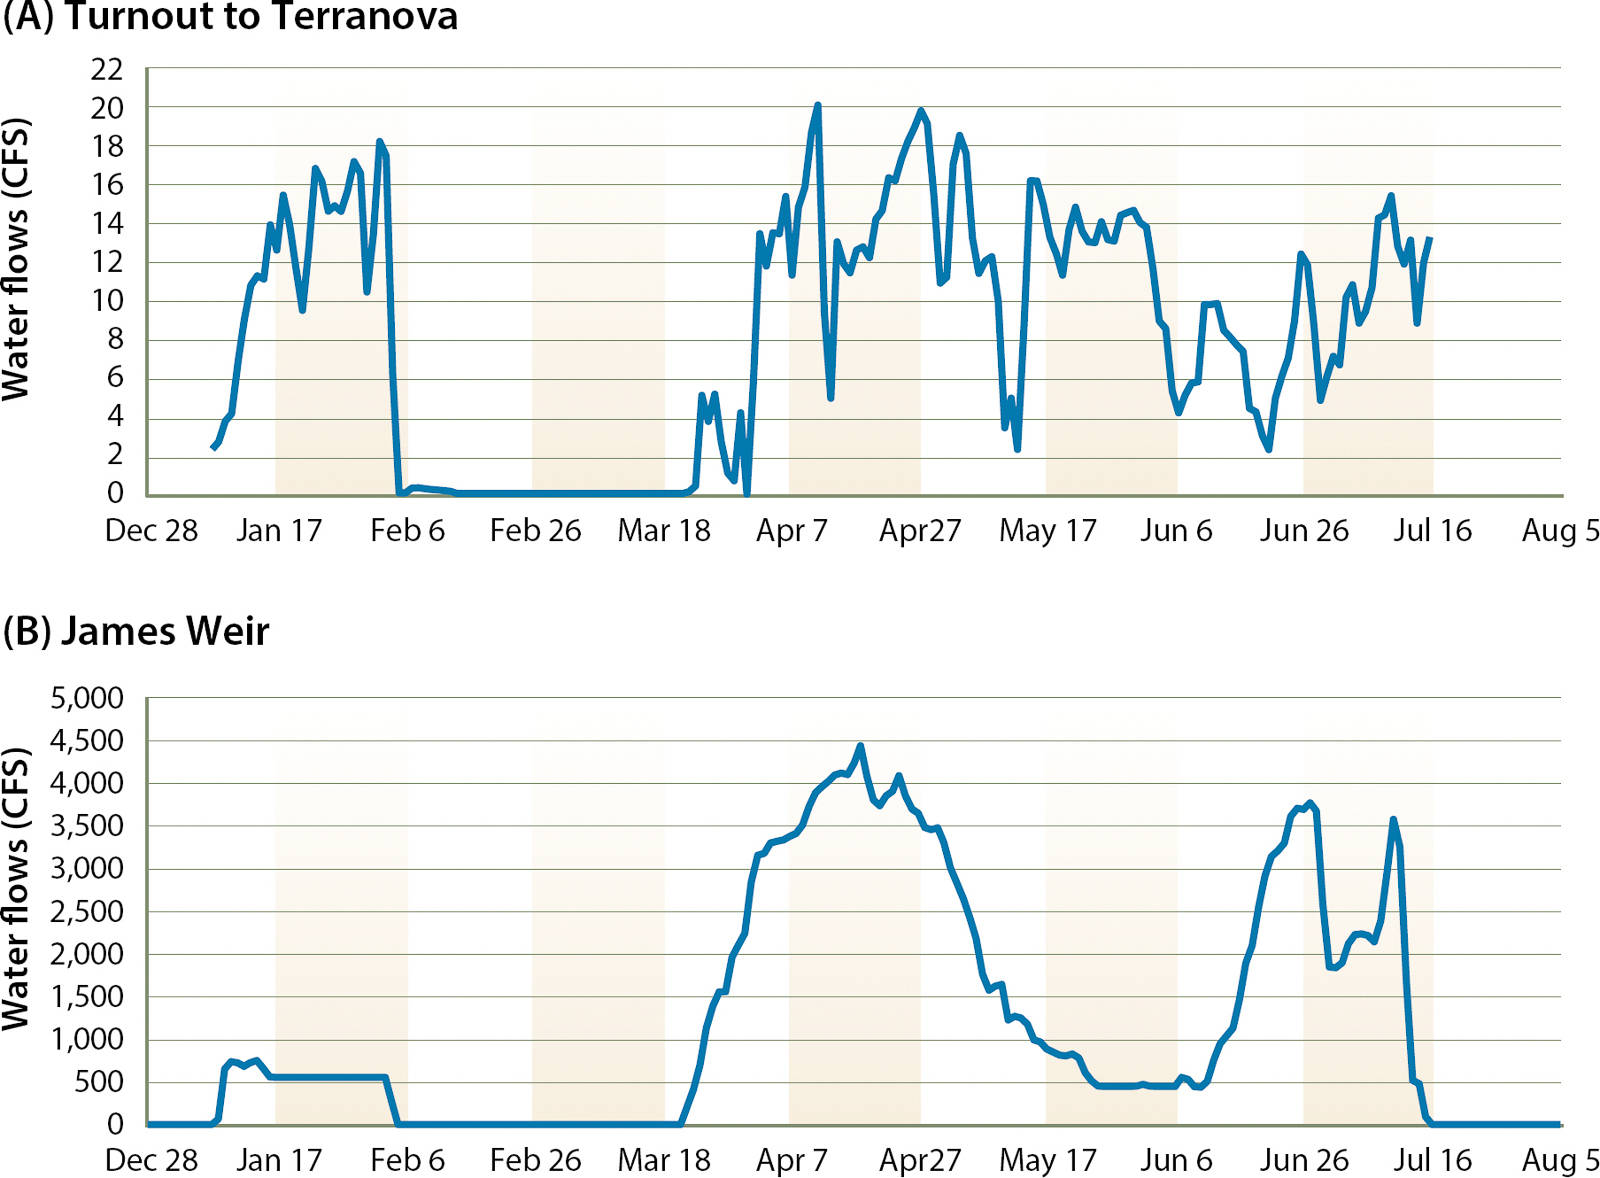
Fig. 3. Flows diverted into Terranova through the turnout (A) and past the James Weir into the James Bypass (B) (CDEC 2012). Diverted flows ranged up to 22 CFS. The total volume diverted to the ranch was 3,116 acre-feet.
Experimental study checks were used to determine potential infiltration rates under recharge conditions for agricultural fields and to assess water quality effects. Agricultural fields were divided into checks separated by small berms to allow uniform shallow flooding of 6 to 12 inches. Eleven checks were selected in wine grape and alfalfa fields to determine recharge infiltration rates and to assess water quality. These checks were on soils categorized as loamy sand or sandy loam (i.e., Fresno fine sandy loam, Fu; Cajon loamy coarse sand, Cb; Fresno-Traver complex, Fx; Pond fine sandy loam, Pt; Traver fine sandy loam, Tt). Except for Cajon loamy coarse sand, all of these soils are considered to have very limited infiltration rates (hydrologic soil groups C and D). Checks were in the range of 3 to 5 acres, representing a subset of the larger field test.
Pressure transducers calibrated to staff gauges recorded surface water elevation. Infiltration rates were corrected after accounting for evapotranspiration using crop coefficients derived from CIMIS (2011). River and canal water, surface water flooded onto fields, and pumped groundwater were analyzed for total and inorganic dissolved nitrogen and phosphorus, and electrical conductivity (EC) to assess water quality. In a subset of wine grape checks, soil moisture, EC and temperature probes were placed in the root zone, and soil cores were collected to depths of 15 to 25 feet, to assess soil pore water changes.
Agricultural fields located across 1,000 acres were studied to assess farm-scale considerations such as infrastructure, field management, logistics, crop effects and costs. Three rented pumps with capacities in the range of 3,600 to 5,000 gallons per minute (gpm) conveyed water from the diversion canal into the irrigation system and cycled floodwaters to the fields. Nutrient management was typical, with nutrients being added as necessary based on plant or soil analyses.
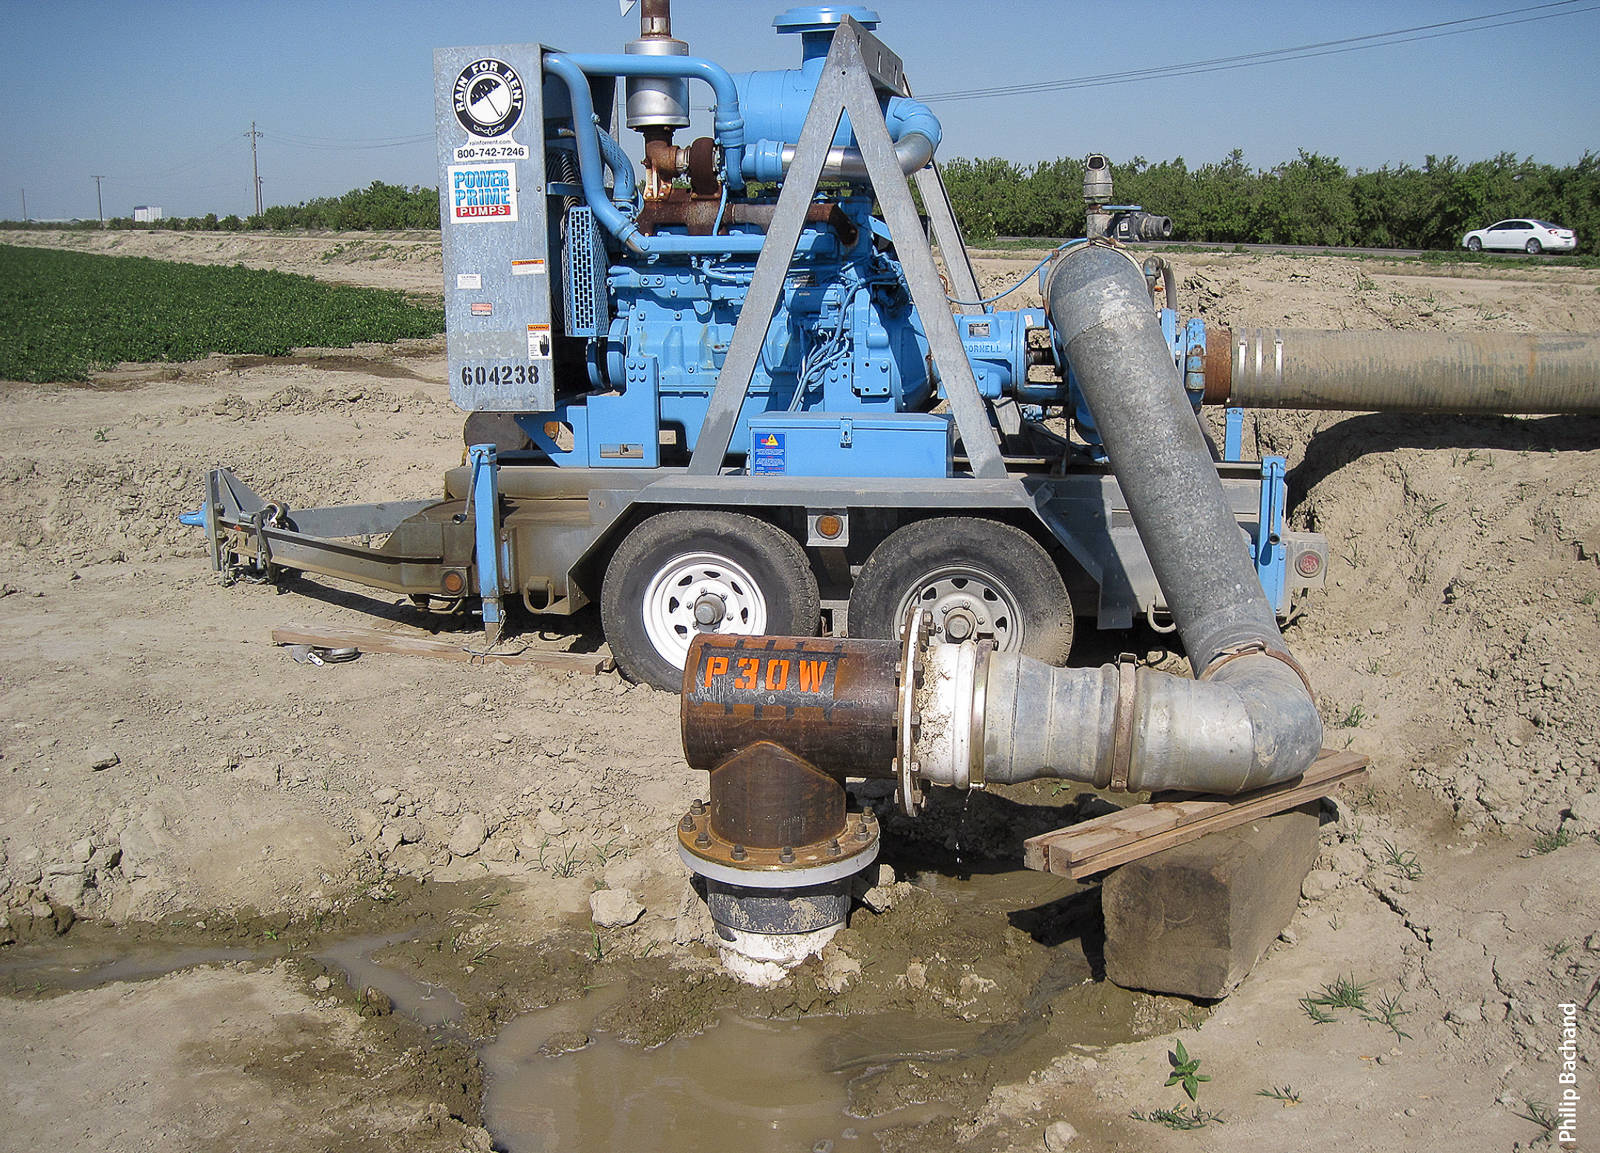
Pumps and engines were connected to piping to pull floodwater onto agricultural fields from the diversion canal on the James Bypass.
Costs associated with project implementation, including field preparation, installation and rental of equipment and infrastructure, labor, energy and project support, were tracked by Terranova Ranch. From these costs we estimated costs for on-farm flood capture for a 25-year period, assuming an average flood recurrence interval of 2 years, based on historical records (fig. 1).
Infiltration rates
Initial infiltration rates on the studied wine grape and alfalfa checks averaged around 8 inches per day (up to 25 inches per day on one field with soil type Fx, considered to have very limited infiltration potential), decreasing to about 4 inches per day after 2 days, and then asymptotically approached 2 to 2.5 inches per day after sustained flooding of up to 20 days. These infiltration rates exceeded rates for the confining layers (the soil layers in the root zone that are documented as limiting the rate of infiltration) of these hydrologic group C and D soils (NRCS 1998). We attributed these higher infiltration rates to soil preparation, which included deep ripping, and associated crop establishment practices.
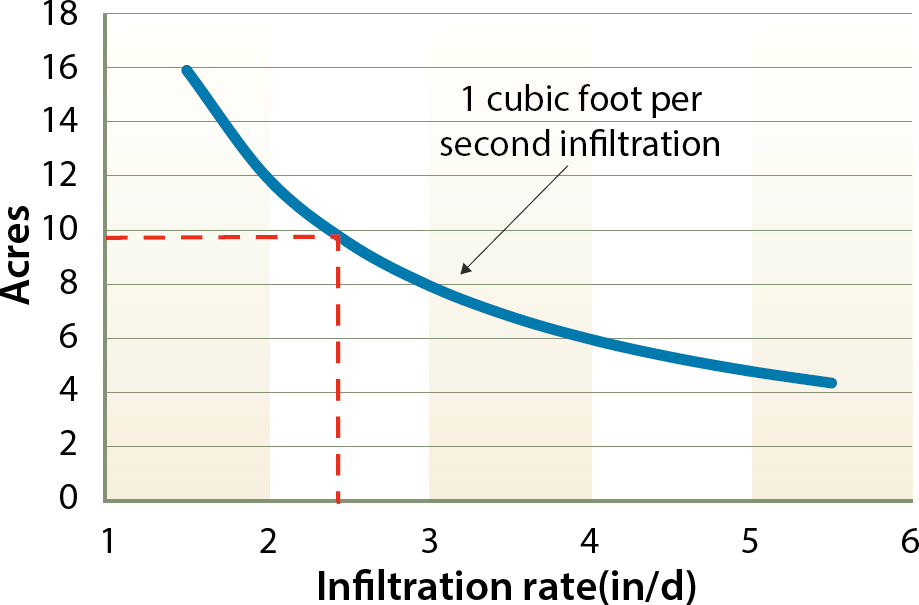
Fig. 4. At the infiltration rate of approximately 2.5 inches per day measured in this study, approximately 10 acres are required to capture 1 CFS. That relationship corresponds to pumping water at 3,500 gpm onto a 70-acre field.
At the sustained infiltration rate of 2.5 inches per day, 10 acres are required to infiltrate 1 CFS (fig. 4; 62.5 acre-feet per month). For a field of approximately 70 acres, this relationship corresponds to pumping water onto the field at 3,500 gpm. These rates represent the potential infiltration achievable on Terranova Ranch where water conveyance and availability are not limiting.
Water quality
Kings River flood flows are derived from Sierra snowmelt, with salt and nitrate concentrations one or more orders of magnitude lower than in pumped groundwater at this study site. Soil probe and soil core data from the checks showed the applied water flushed salts and nitrate from the root zone. With implementation of this program, legacy salts and nitrate would be flushed from the root and vadose zone to groundwater.
For the Terranova site, a simple mass balance model was developed describing salinity and nitrate concentrations through the vadose zone using the collected soil core data and groundwater data. From that simple model, we calculated approximately 40 feet of water would be needed to displace the approximately 2.25 pounds per square foot (11 kilograms per square meter) of legacy salts and approximately 0.04 pounds N per square foot (0.2 kilograms N per square meter) of legacy nitrate into groundwater at this site (Bachand et al. 2014). We estimated an additional 40 feet of water would return groundwater to initial salt and nitrate levels through dilution (Bachand et al. 2012). Ariyama (2015), using a more sophisticated Hydrus model, estimated about 60 feet of water would be needed to return the groundwater to current salinity levels.
Further applied flood flows would improve groundwater salinity levels over time. This will benefit landowners throughout the flood corridor by improving soil quality and groundwater sustainability. The use of existing or modified water conveyance structures within irrigation districts could provide pristine floodwater to more landowners and magnify local benefits.
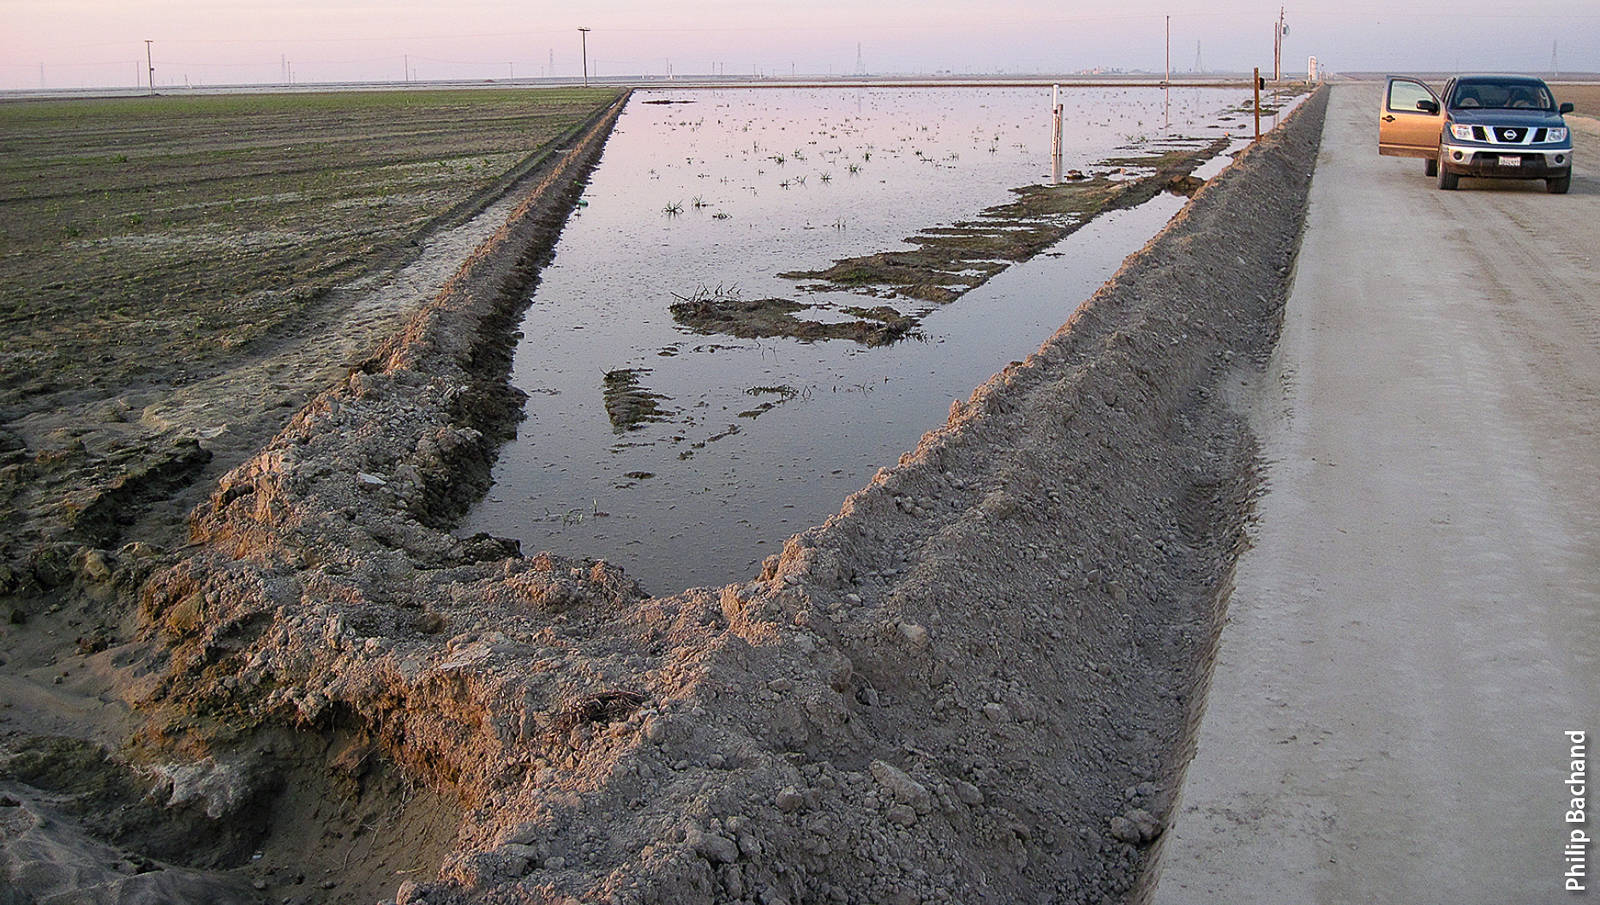
Wintertime modifications to tomato field to manage water were similar to rice checks to enable capture and infiltration of flood flows. Modifications included cutting small check berms to accommodate field gradients and installing low cost flashboard risers to manage water flow and elevations.
Farm-scale implementation
Flood flows were diverted throughout the 1,000 acres for about 2 weeks in January and then from April to early July. In all, over 3,000 acre-feet of water was diverted from the Kings River onto these fields. Wine grapes were flooded with sufficient water for direct recharge during April and May. One pistachio field and one alfalfa field also had sufficient floodwater in April for direct recharge of 13 and 7.5 inches, respectively. As the growing season progressed, evapotranspiration increased and more applied flood flows went to meeting consumptive demands as in-lieu recharge and less to direct recharge.
Conveyance constraints
Conveyance infrastructure (e.g., turnout, pump and pipe capacities) constrained flood flow applications. The distribution rate of water across the 1,000 acres (0.26 inches per day, or 0.65 feet per month), even during peak diversion periods in April and May, was an order of magnitude lower than the achievable long-term soil infiltration rates demonstrated in the experimental check studies (2.5 inches per day, or 6.3 feet per month).
Crop yield and quality
Flood flow diversion onto these fields was timed to not interfere with necessary land preparation practices for crop management. Wine grapes and alfalfa were expected to be able to tolerate flooding and saturated conditions. Vineyards showed no damage in either the 2010 or 2011 crops (Bachand et al. 2014). Pistachios were assumed to be able to tolerate flooding before leafing out. No significant yield penalties were found for either pistachios or alfalfa. Recharge on annual crops such as tomatoes was conducted during fallowed periods.
Costs support flood capture
Capturing and applying flood flows was calculated at $36 per acre-foot during this project (Bachand et al. 2013). These costs included labor costs, land preparation, fuel and farm-scale infrastructure improvements. Some applied water went to direct recharge for future benefits and some to in-lieu recharge for current benefits. In comparison, large-scale surface water storage can cost from $300 to $1,100 per acre-foot (DWR 2013), and dedicated recharge basins cost from $90 to $1,100 per acre-foot (Choy et al. 2014).
Groundwater is the only irrigation source in this region of the Kings Basin and groundwater is currently 220 to 230 feet below the surface in large areas of the Kings River Basin (KRCD 2013; fig. 2). In the study area, groundwater costs approximately $88 to $120 per acre-foot to extract (D. Cameron, personal communication; JID 2010; MWH 2004). For the study site, we calculated that if 25% or more of the captured flood flows can be used for in-lieu recharge, then the savings in groundwater pumping costs can support an active on-farm flood capture program by individual farmers (Bachand et al. 2012, 2014).
Considerations as a regional or statewide tool
Under a DWR Flood Corridor Grant being implemented by KRCD and with local matching funds by Terranova Ranch, the McMullin On-Farm Flood Capture and Recharge Project (McMullin Project) is expanding this technology to a more regional scale. Under Phase 1, the project will enroll approximately 5,000 acres (including the current project area) and have the capacity to divert 150 CFS of flood flows onto 1,500 acres actively managed for recharge during flood flow conditions. At full build-out, the project will increase the capacity to 500 CFS covering 16,000 acres of farmland with 5,000 acres managed for recharge at any given time (CNRA 2013). This diversion rate is equivalent to 30,000 acre-feet monthly.
The project will have implications in the Kings Basin as related to both (1) mitigating regional flood risks and (2) offsetting groundwater overdraft. A hydrologic and hydraulic (H&H) analysis was conducted using established modeling tools available for assessing California river flows and associated economic relationships: a one-dimensional unsteady network flow (UNET) model (DWR 2012; USACE 2002), and a HEC (Hydraulic Engineering Center) flood damage analysis (FDA) (DWR 2012). This analysis predicts a benefit-cost ratio for this project greater than 1.8, with benefits occurring downstream of the James Weir along the Kings and San Joaquin rivers, particularly from reducing damages associated with 10- to 100-year flood events (Bachand et al. 2013).
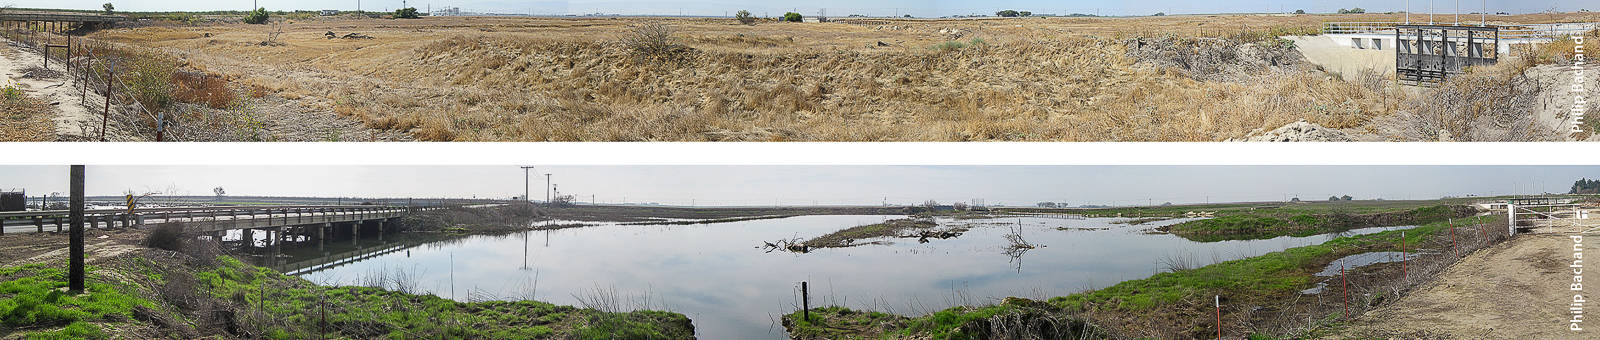
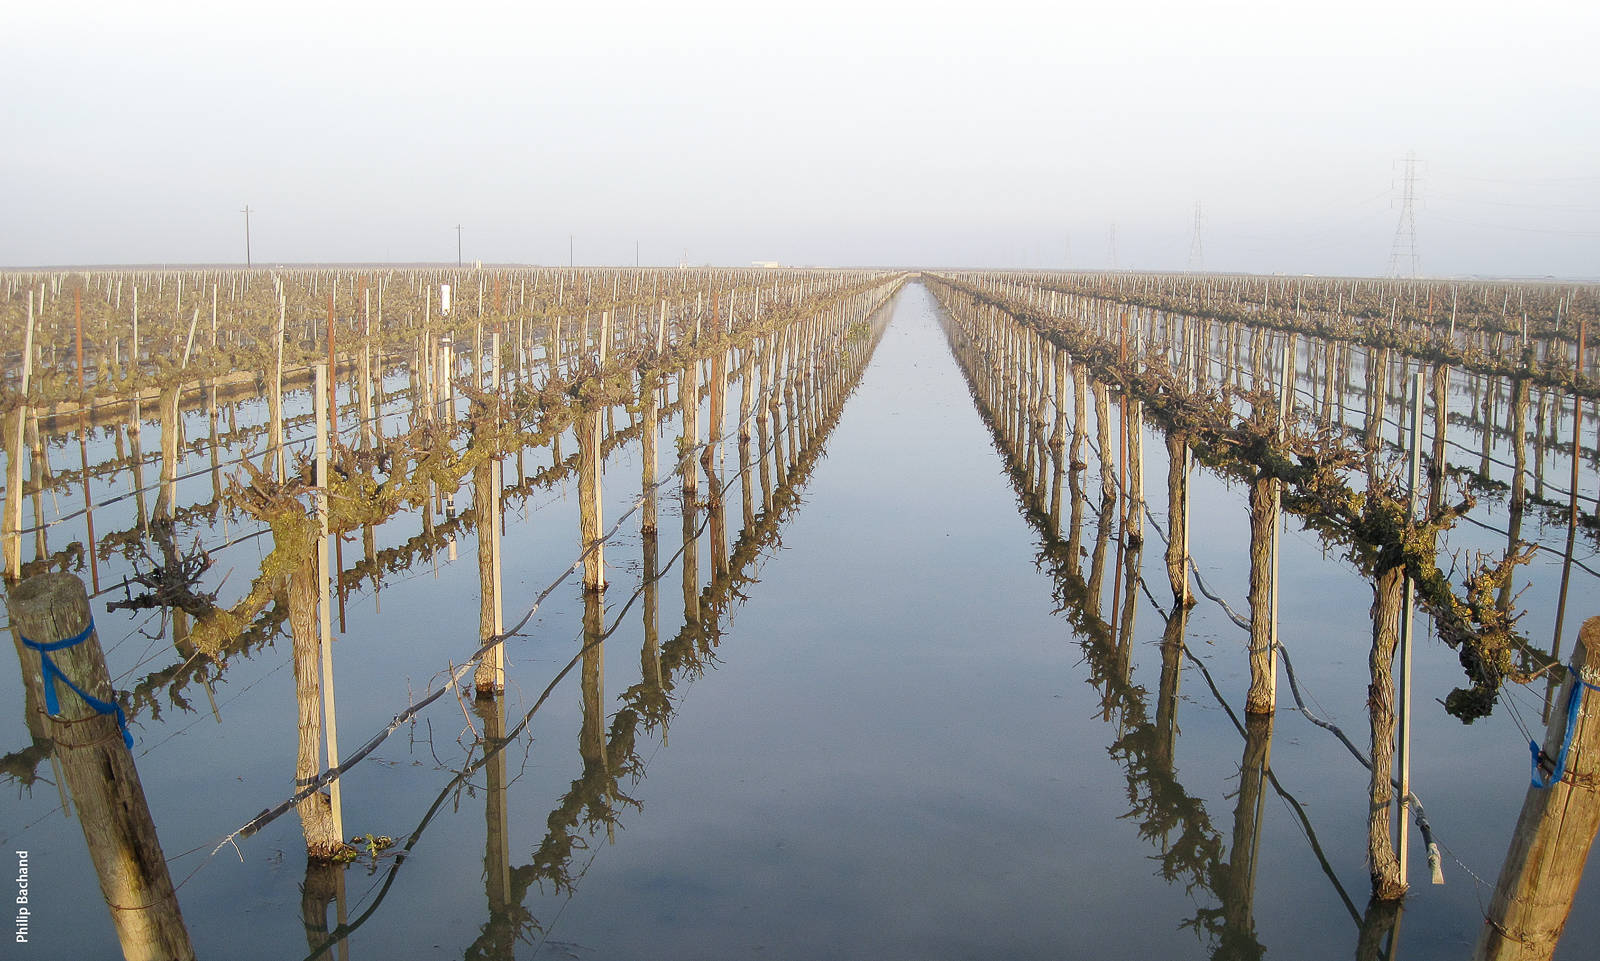
Panoramic picture of the James Bypass from the Terranova Ranch in October 2010 (top) and early February 2011 (below) from the Highway 145 overpass to the James Weir. Flood flows occur approximately on a 2-year interval, but the James Bypass can be dry for years at a time or flooded for several months consecutively.
An integration of the WRIME (2007) and KRCD (2013) groundwater overdraft analyses finds groundwater overdraft rates in the Kings Basin similar in magnitude to surplus flood flow losses. For instance, from 1980 through 2009, surplus flood flows past the James Weir were 7.4 MAF, and groundwater overdraft was about 5.3 MAF. Current annual rates of groundwater overdraft of 0.23 MAF (KRCD 2013) are equivalent to the calculated annually averaged surplus flood flows from the USGS dataset (fig. 1).
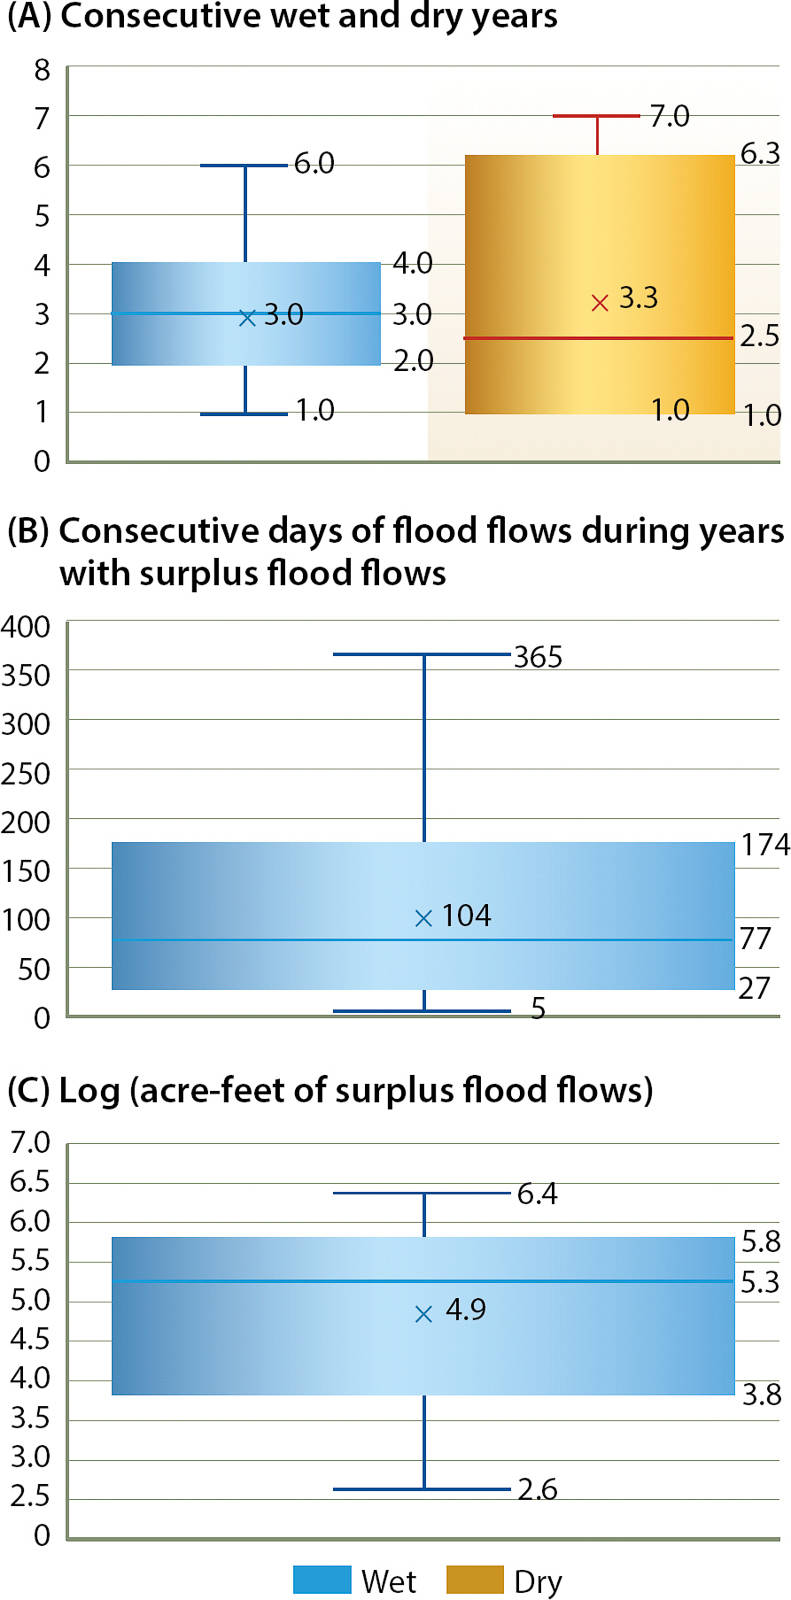
Fig. 5. Surplus flood flows past the James Weir on average have occurred every 2 years. However, wet and dry years are typically grouped with 2 to 4 consecutive wet years followed by 1 to 6 consecutive dry years. During wet years, flooding typically lasts from 1 to 6 months, with an average duration of 3.5 months and a median duration of 2.5 months. Large volumes of water flow through the James Bypass during those flood periods: the median annual volume is 0.18 MAF while the 75th percentile is 0.60 MAF. Graphs show min and max (whiskers), mean (x), 25th and 75th quartiles (box) and median (line). Source: USGS 2010.
The McMullin Project will provide capacity to offset Kings Basin groundwater overdraft. If operated over 3 months to capture flood flows, a period typical for flood flows past the James Weir (fig. 5), the McMullin Project would capture 90,000 acre-feet, about 40% of the annual King Basin overdraft of 230,000 acre-feet reported by KRCD (2013). When considering the historical record since 1980 (USGS 2010), at a fully operational capacity of 500 CFS, the McMullin Project would have enabled capture of nearly 20% of surplus flood flows (fig. 6). Additional systems would provide additional capacity. We estimate that four such projects (2,000 CFS diversion; 20,000 acres managed for recharge during flood flow conditions) would have been able to capture 60% of total flood flows over that period, while six such projects (3000 CFS diversion; 30,000 acres managed for recharge during flood flow conditions) would have been able to capture 80%. As the capacity increases, diminishing returns would be expected, given the decreasing frequency of flood flows great enough to fill the available recharge capacity.
Other factors come into play when considering regional and statewide scaling. Climate change will complicate surface water storage, altering the timing and magnitude of available surface water runoff from the Sierra (DWR 2013; Reclamation 2011, 2104). More recharge capacity than predicted by historical records is likely needed. Adjusting to these changes will require structural and operational adjustments to water management facilities. Flood capture through recharge is a relatively low cost and expandable approach that could address problems of both storage and timing. Changing the operation of the statewide reservoir system to release flows to optimize the integration of groundwater and surface water storage and to manage flood risks —rather than focusing only on optimizing surface water storage and managing flood risks — is a paradigm shift for statewide water management and could increase opportunities for groundwater recharge throughout the Central Valley.
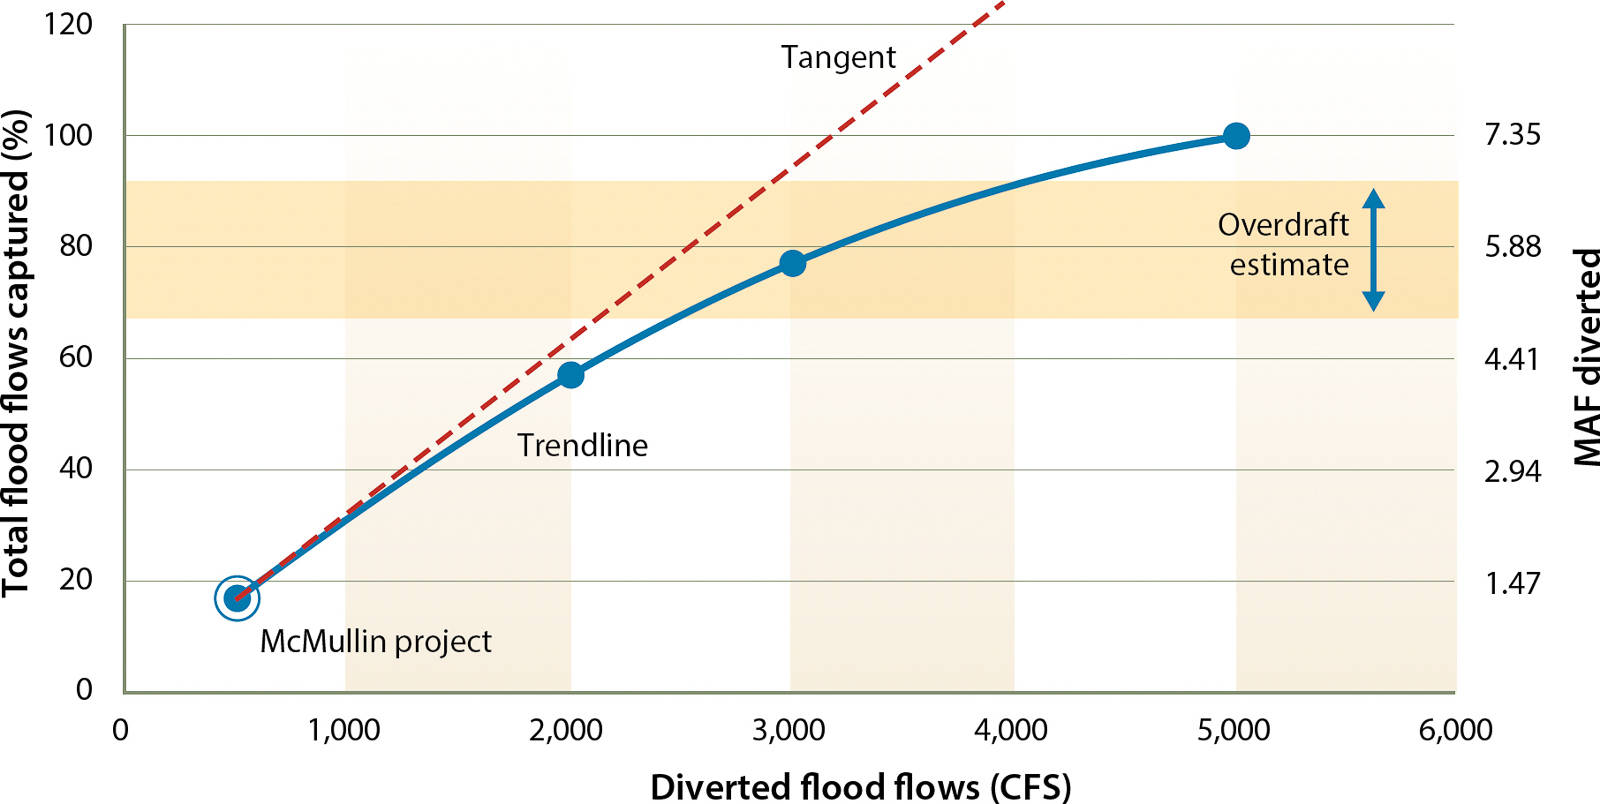
Fig. 6. The McMullin Project, if operational at build-out capacity (capable of diverting 500 CFS) since 1980, would have been able to capture nearly 20% (1.47 MAF) of the total available surplus flood flows (7.35 MAF) in the James Bypass from 1980 through 2009. We estimate that four equivalent projects (capable of diverting 2,000 CFS total), would have the capacity to capture 60% (4.41 MAF) of flood flows. As more capacity is added, diminishing returns occur because there are fewer flood events large enough to fill the recharge system to full capacity. Flow data source: USGS 2010. Overdraft estimate from WRIME (2006a) and KRCD (2013).
Logistical, societal and legal issues also exist. Many areas in the Central Valley appear suitable for on-farm flood recharge (Bachand et al. 2015; O'Geen et al. 2015). But implementation challenges include providing sustainable funding mechanisms for system operation and maintenance, developing flexible flood capture strategies, working within water rights constraints and managing risks for growers (Bachand et al. 2015). For participating growers, challenges include integrating flood flow capture infrastructure and practices with farming operations, developing methods of funding such as selling easements and irrigation cost savings, working with water managers to rapidly mobilize when needed, and developing an appropriate cropping mix and nutrient management strategies to facilitate the flood flow program, promote dual-purpose use (i.e., flood capture and agriculture) and manage water quality risks. On-farm flood capture could be leveraged to address societal issues as well. Disadvantaged communities are disproportionately affected by poor groundwater quality in the Central Valley, and strategic implementation of on-farm flood capture could dilute common contaminants such as nitrate and salts (Ariyama 2015; Bachand et al. 2014) and improve groundwater quality. Finally, central to implementing on-farm flood capture broadly is the question of how it integrates into California's water rights, which provide the legal framework for distributing water in California.
Citations
On-farm flood capture could reduce groundwater overdraft in Kings River Basin

