


All Issues
How many workers are employed in California agriculture?
Publication Information
California Agriculture 71(1):30-34. https://doi.org/10.3733/ca.2016a0011
Published online August 23, 2016
NALT Keywords
Abstract
In 2014, the average employment of hired workers in California crop and livestock agriculture, counting all occupations, rose by 10% to 410,900. However, although the state reports the number of jobs on farms regularly, it does not report the number of workers who fill these jobs. We analyzed all Social Security numbers reported by farm employers in 2014 and found two workers for each average or year-round equivalent farm job, making the total number of farmworkers employed in agriculture 829,300, or twice average employment. Approximately 83% of farmworkers had their maximum earnings with an agricultural employer in 2014, and almost 80% of those primary farmworkers were employed by crop support firms (392,000) or fruit and nut farms (154,000). Over 60% of all workers had only one farm employer, followed by 27% with two or more farm employers, and 35% were employed in Kern (116,000), Fresno (96,000) and Monterey (82,000) counties. These data show that California has a remarkably stable farm workforce: most farmworkers are attached to one farm employer, often a labor contractor who moves them from farm to farm.
Full text
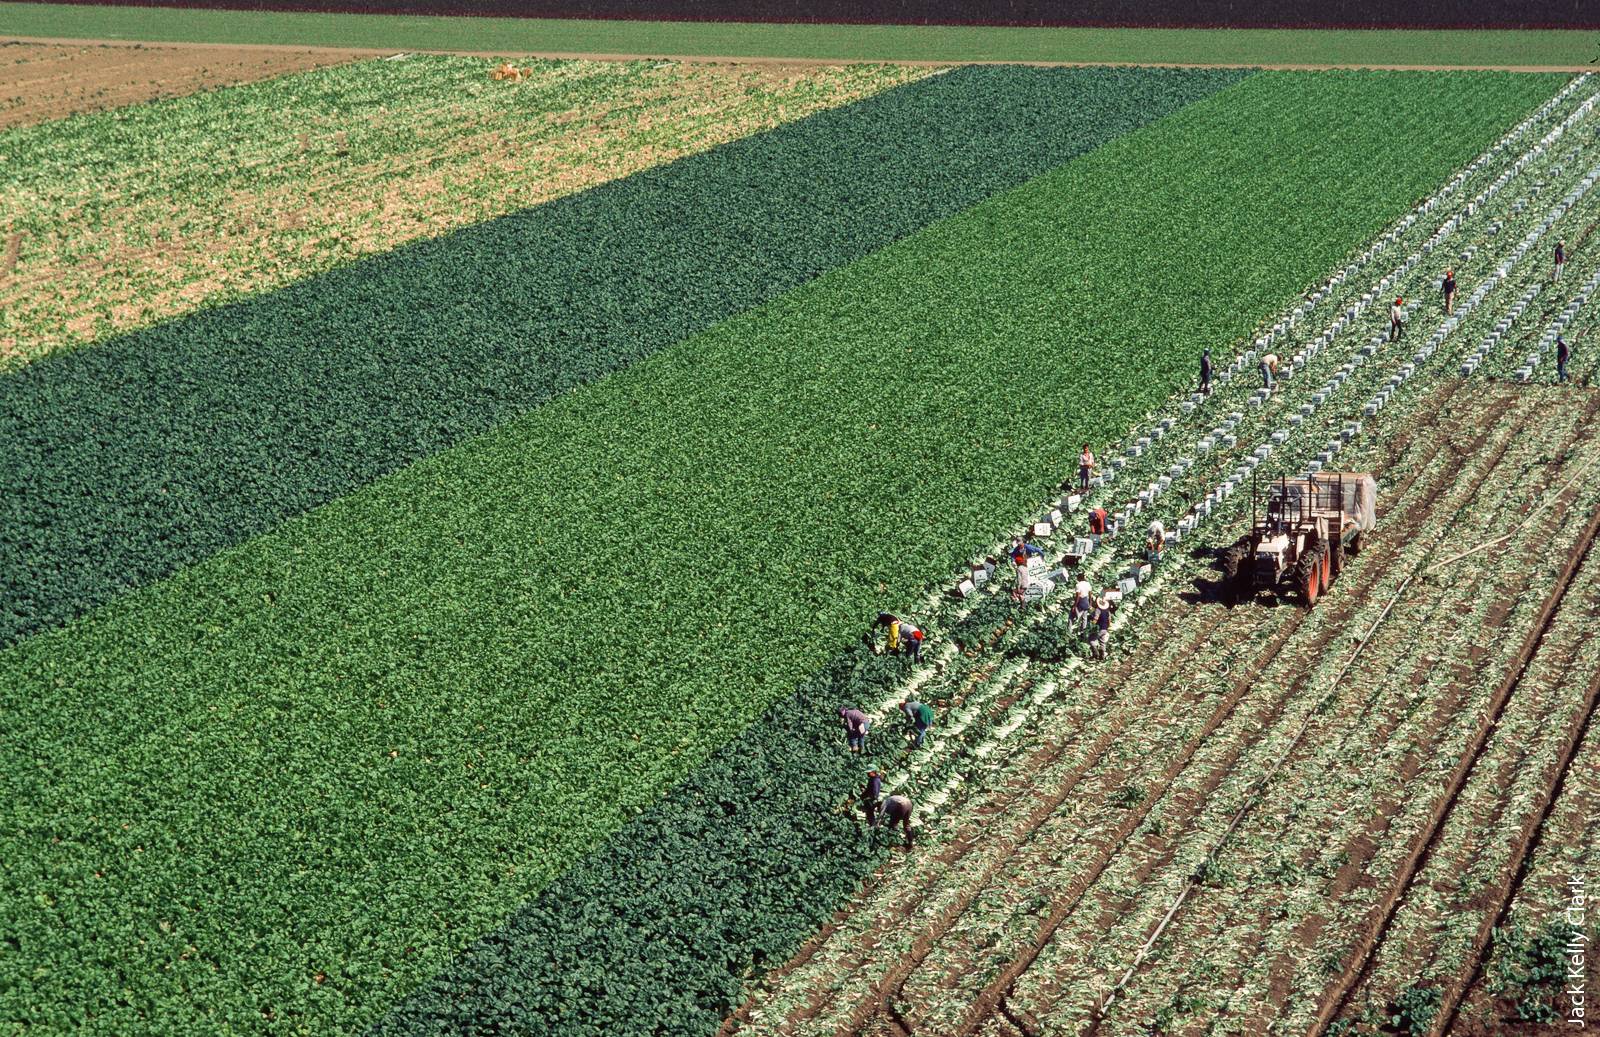
The production of many fruits and vegetables is relatively labor intensive, with labor representing 20% to 40% of production costs. California growers reported paying $11.4 billion in wages in 2014, making labor costs over 20% of farm sales. Almost 45% of these labor costs was for support activities for crop production, primarily payments to farm labor contractors, custom harvesters and other nonfarm businesses that bring workers to farms.
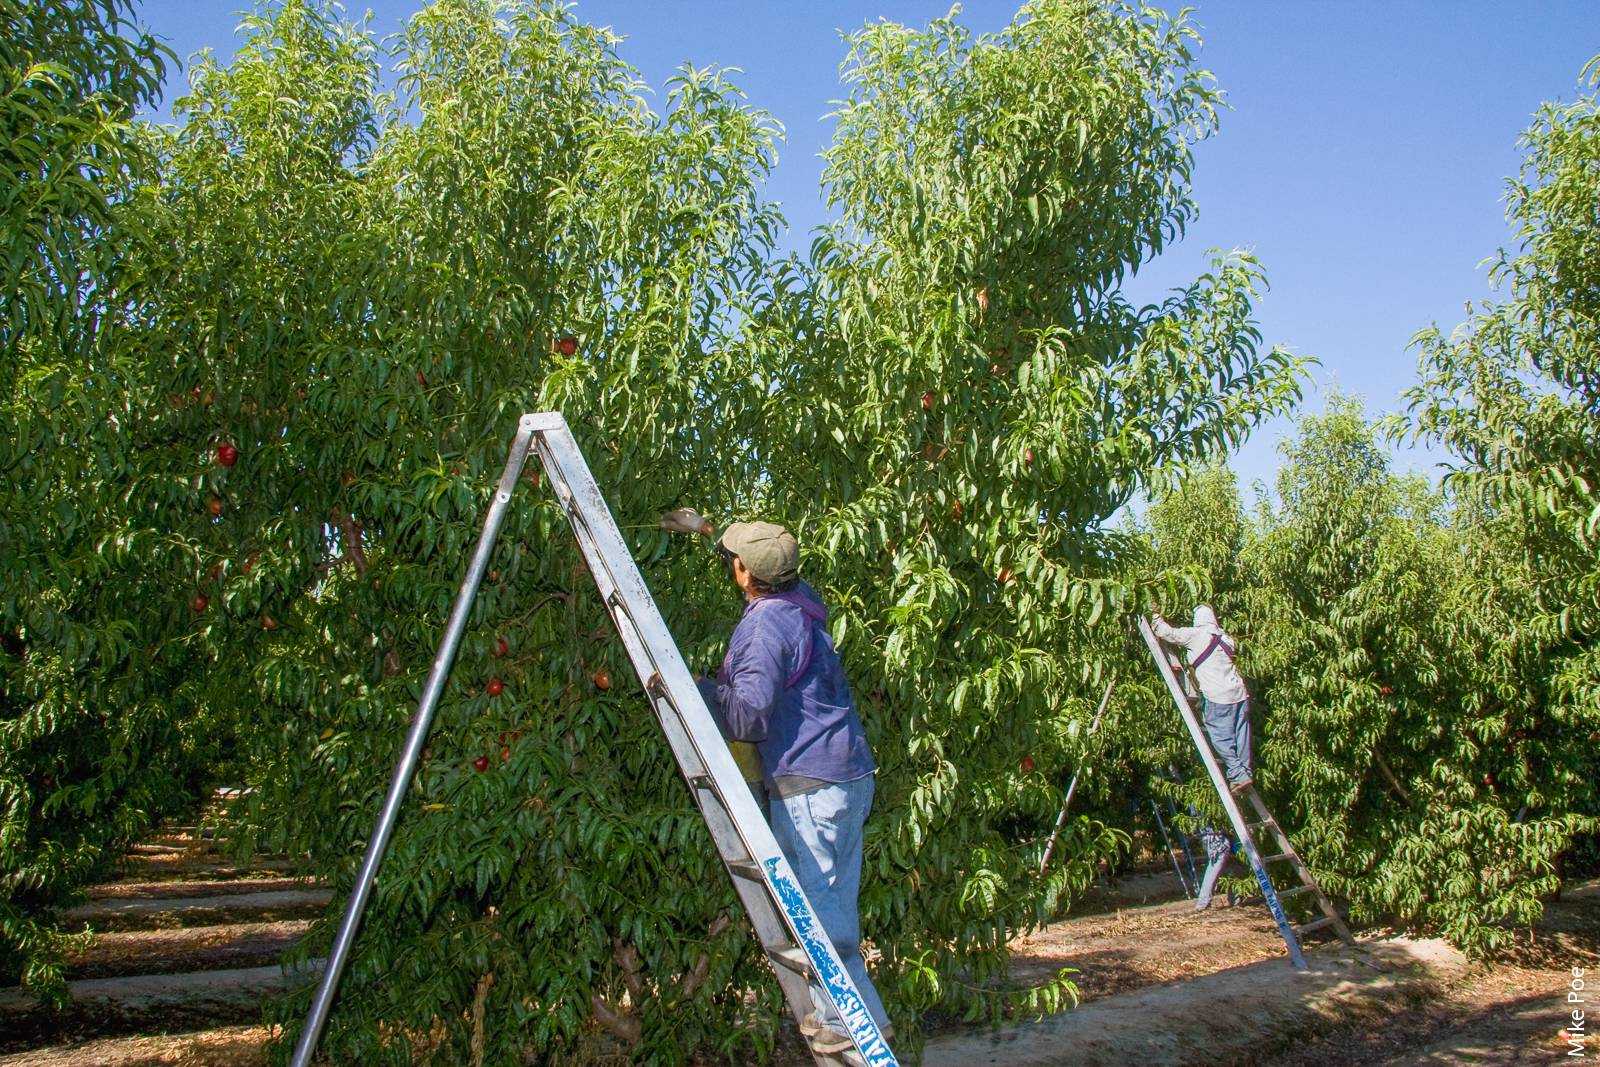
Hired workers, rather than self-employed farm operators and their families, do most of the work on the state’s largest farms that produce almost all labor-intensive FVH crops. Most California farmworkers were born in Mexico, and 60% of crop workers employed on the state’s crop farms have been unauthorized for the past decade, according to the National Agricultural Workers Survey, which is 10 percentage points higher than the U.S. average of 50%. Farm employers say that farmworkers present seemingly valid documentation and Social Security numbers (SSNs) when they are hired, so they do not know who is unauthorized.
Employment data show that most California farmworkers have only one farm employer, which suggests that the state has a stable agricultural workforce.
Several factors, including increased production of labor-intensive crops, a tightening of border controls that has slowed arrivals of new farmworkers, and proposals to give some unauthorized foreigners a temporary legal status, have intensified interest in current and future farmworkers, with farm employers arguing that there are farm labor shortages and worker advocates countering that there is only a shortage of wages to attract and retain farmworkers. While California regularly reports the number of jobs on farms across the state, it does not report the number of wage and salary workers who fill them. Our objective was to provide a clearer picture of California’s agricultural workforce by determining the actual number of wage and salary workers in agriculture.
Data collection
The state’s Employment Development Department (EDD) obtains data on farmworkers and wages paid when it collects unemployment insurance taxes from employers. Employers who pay more than $100 in quarterly wages are required to register with the EDD and pay taxes of up to 6% on the first $7,000 of each worker’s earnings to cover the cost of unemployment insurance benefits for laid-off workers. (New employers pay 3.4% for a period of 2 to 3 years until EDD establishes how many claims their laid-off employees make for unemployment insurance benefits. The maximum charge is 6.2% of $7,000, or $434 a year.)
We extracted all wage and salary workers reported by California agricultural employers (North American Industry Classification System, or NAICS 11; census.gov/eos/www/naics/ ) in 2014 and tabulated all of their farm and nonfarm jobs and earnings in the state; we excluded wage and salary workers in forestry, fishing and hunting. This allowed us to assign workers with more than one job to their primary industry, that is, to the NAICS code of the employer(s) where they had their maximum earnings. We excluded about 800 SSNs because of apparent problems, such as excessive number of jobs reported in a quarter (e.g., more than 10 jobs).
Farm jobs and worker earnings
Average employment on the state’s farms is derived from employer reports of workers on the payroll for the pay period that includes the 12th of the month. Most farmworkers are paid weekly, so an average 410,900 workers employed in 2014 means that this is the average employment of workers on agricultural payrolls during the second week of the month. Workers employed during the month but not during the payroll period that includes the 12th are not included in published average employment data because it is a monthly snapshot, summed and divided by 12 months. Our analysis, however, captures these additional workers because we obtain data on all wage and salary workers hired by agricultural employers at any time, including farmworkers, managers and office workers.
Figure 1 shows average employment in California agriculture since 1990. Average employment rose 10%, reflecting a decline in direct-hire employment on crop farms (NAICS 111), stable employment in animal agriculture (NAICS 112), and a 50% increase in crop support employment (NAICS 1151), most of which is with farm labor contractors. Since 2010, average employment reported by crop support establishments has been rising by 10,000 a year, so that in 2014 nonfarm crop support firms brought more workers to crop farms, an average of over 205,000, than crop farms hired directly, 175,000. In 2014, two-thirds of average employment in crop support services, 207,600, involved farm labor contractors. Very few workers are employed in livestock support services.

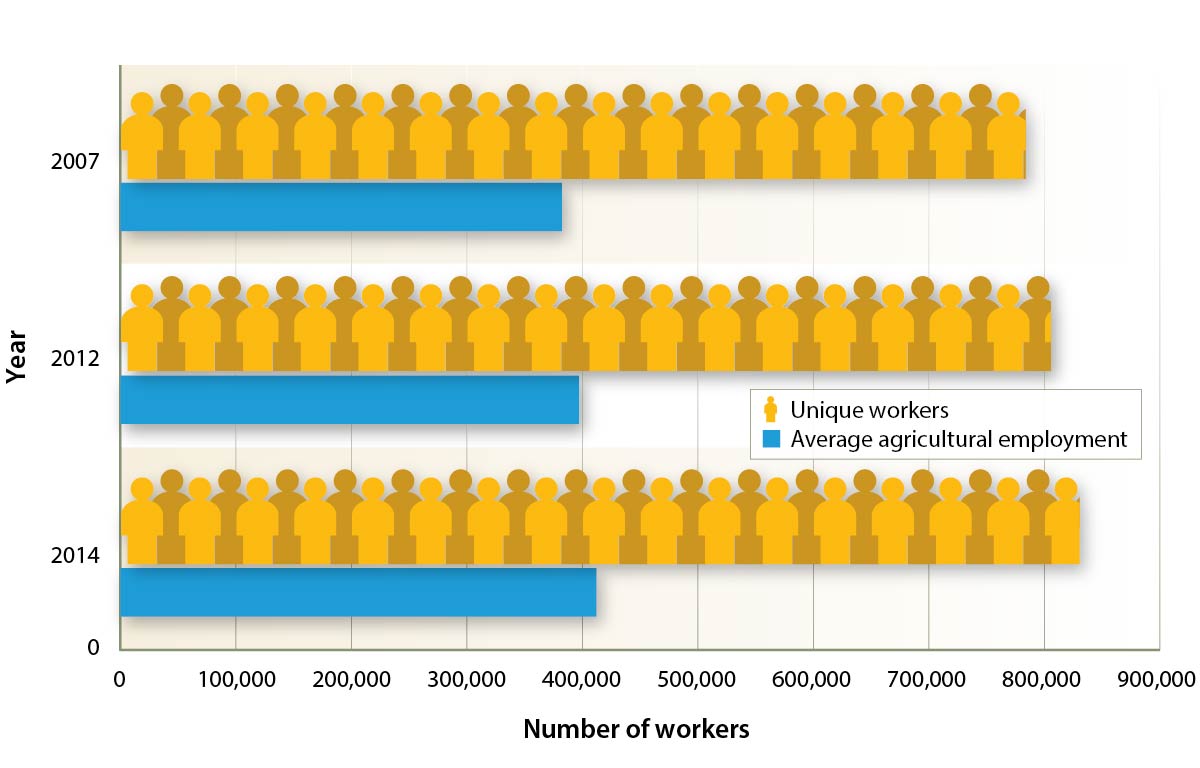
Average employment can be considered to be an estimate of full-time equivalent jobs, but it is not the total number of farmworkers. When average employment in California agriculture was 410,900 in 2014, there were 829,000 unique SSNs reported by agricultural establishments, a two-to-one worker-to-job ratio (fig. 2). In 2012, when average employment was 395,400, there were 802,600 unique SSNs, also a two-to-one worker-to-job ratio. There was a similar two-to-one ratio of workers to average jobs in 2007.
The 829,000 people employed in agriculture during 2014 earned $11.4 billion from agricultural employers and another $4.5 billion from nonfarm employers. Average earnings for all workers with at least one farm employer were over $19,000 in 2014, while average earnings for workers who had their maximum earnings in agriculture were $16,500, up almost 8% from $15,300 in 2012.
The California jobs of the workers reported by California farm employers can be tabulated, and workers can be assigned to the NAICS or commodity in which they had the highest earnings. For example, approximately 692,000 (83%) of the 829,000 workers employed in agriculture had their highest earnings from a farm employer in 2014, and 499,000 of these primary farmworkers had only one agricultural employer (table 1).
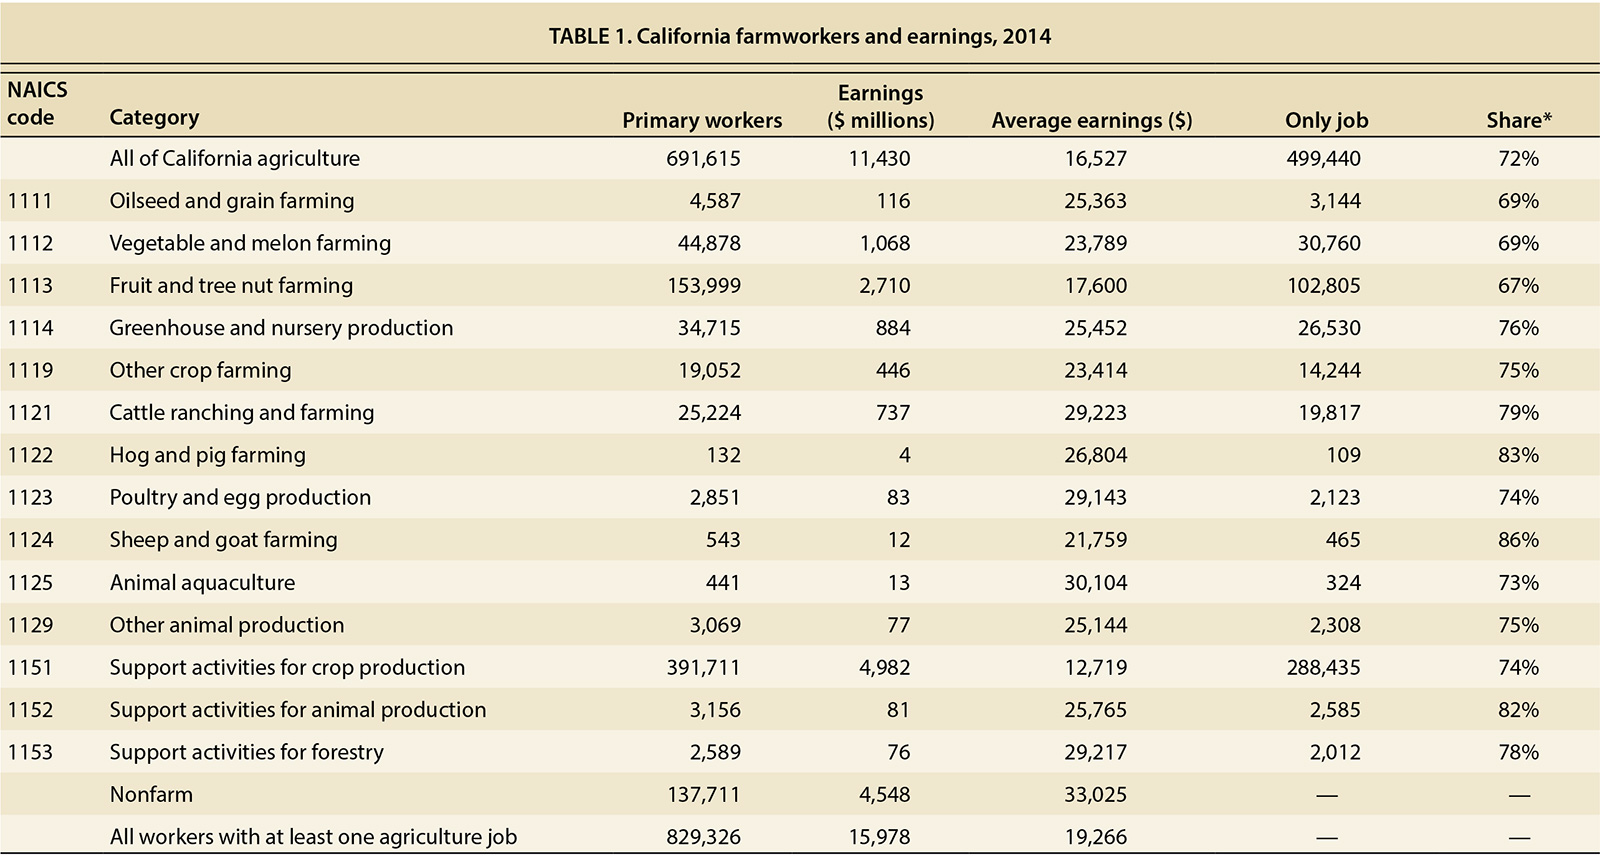
In 2014, the crop support (NAICS 1151) and fruit and nut (NAICS 1113) sectors had the lowest average earnings, with $12,719 for crop support and $17,600 for fruits and nuts. This explains why the overall average earnings of primary farmworkers were only $16,500 even though all commodities except crop support and fruit and nut had higher average earnings, such as the $29,223 average earnings in cattle ranching.
Over three-fourths of the $11.4 billion in agricultural earnings were from three NAICS codes: 1151 crop support activities ($5 billion), 1113 fruits and nuts ($2.7 billion) and 1112 vegetables ($1.1 billion). Other major sources of agricultural earnings were NAICS 1114 greenhouses and nurseries ($884 million) and 1121 cattle and dairy ($737 million).
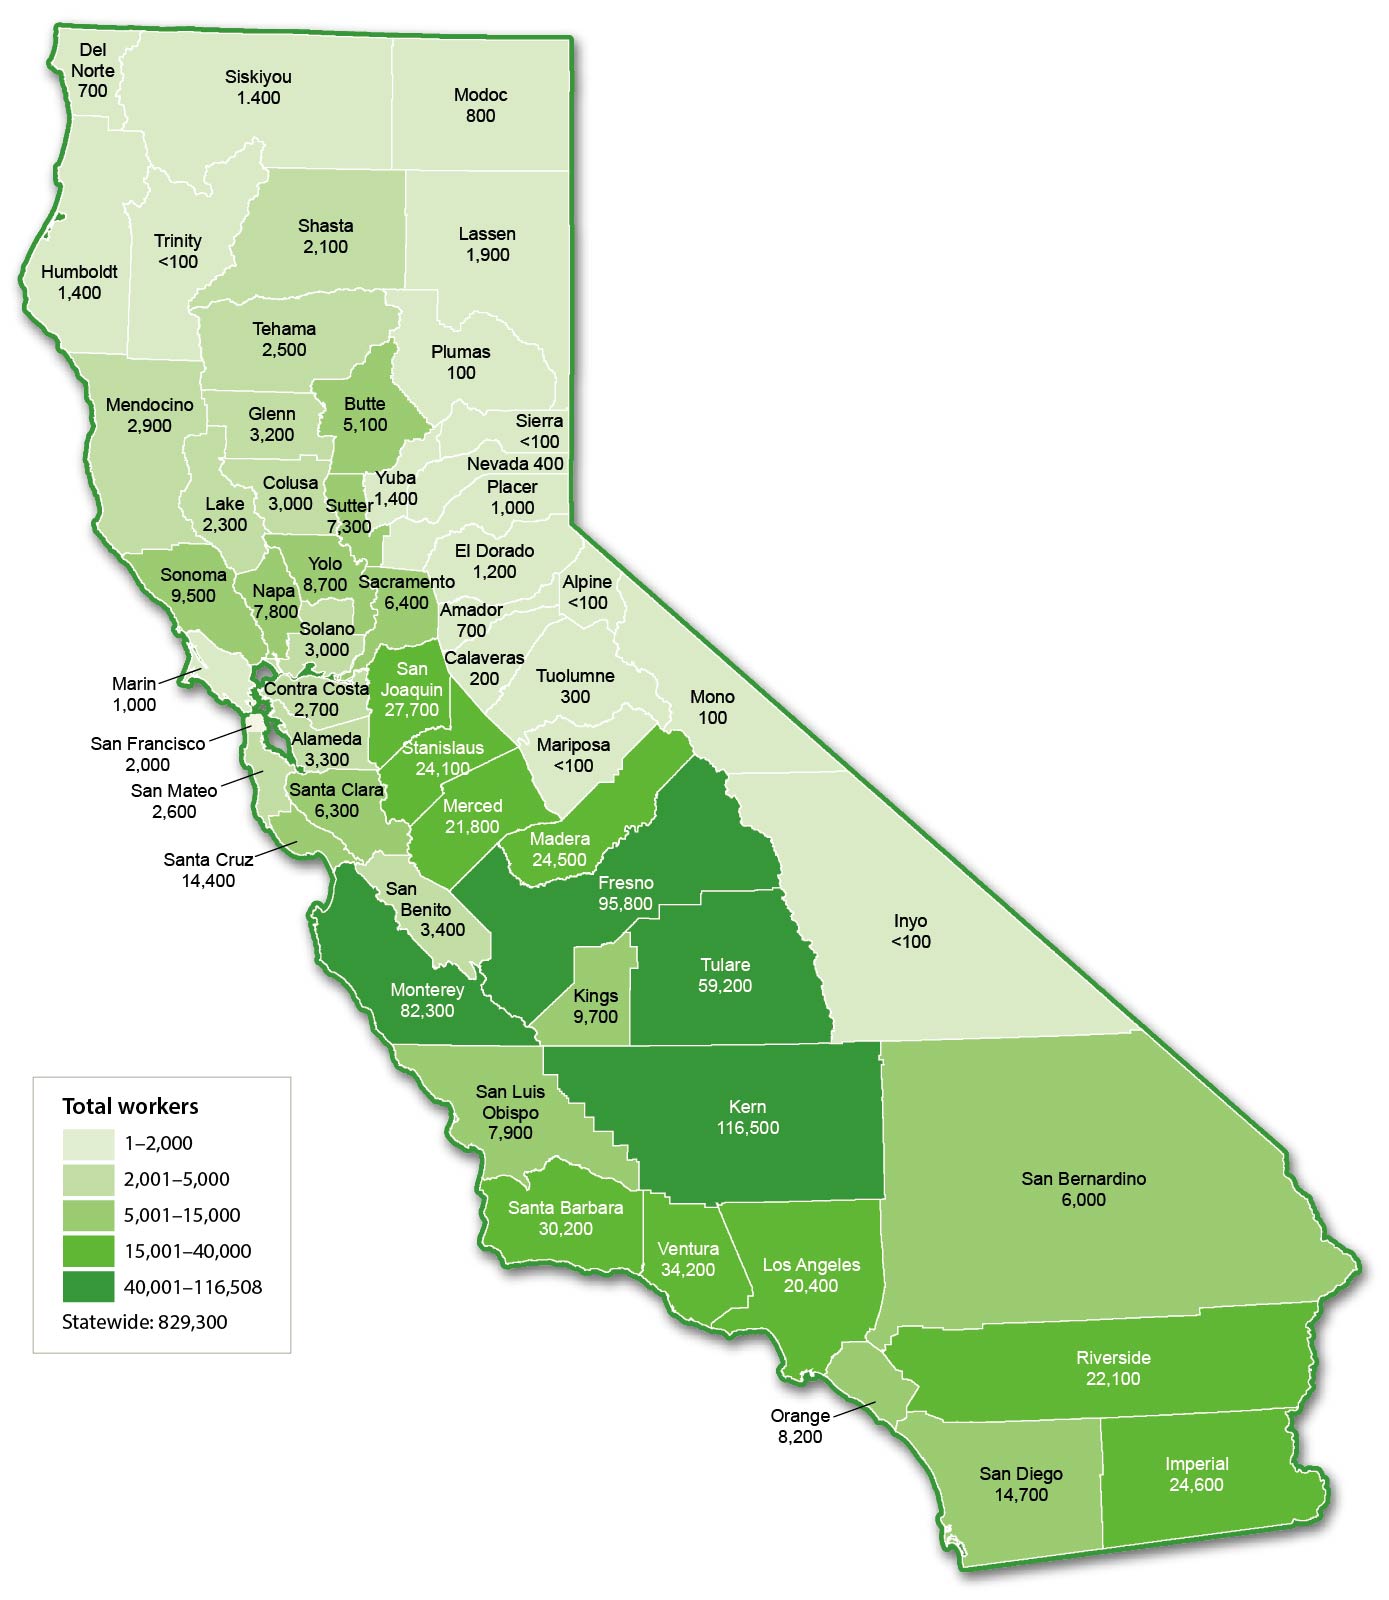
Over 829,000 unique Social Security numbers were reported to the state’s Employment Development Department by California agricultural employers in 2014. When workers were assigned to the county in which they had their primary (or highest-earning) job, the following three counties had 35% of the state’s farmworkers: Kern (116,000), Fresno (96,000) and Monterey (82,000). Source: Quarterly Census of Employment and Wages, CA EDD Base Wage File.
Workforce groups
By assigning all of the state’s 829,300 farmworkers to the NAICS code of the employer where they had maximum earnings in 2014, we identified several groups. First, almost 692,000 (83%) of farmworkers had their maximum earnings from agricultural establishments, including (1) 392,000 (57%) whose maximum earnings were from NAICS 1151 crop support establishments, (2) 154,000 (22%) whose maximum earnings were from NAICS 1113 fruit and nut establishments and (3) 45,000 (6%) whose maximum earnings were from NAICS 1112 vegetable establishments. There are over 20 agricultural NAICS codes, but three sectors — crop support firms (often labor contractors), fruit and nut farms, and vegetable and melon farms — accounted for 85% of all primary farmworkers in 2014.
Second, almost 500,000 farmworkers, or 72% of primary farmworkers, had only one job in 2014, meaning that three-fourths of workers whose maximum earnings were from agricultural establishments worked for only one agricultural employer in California. These “one-farm employer” workers were in the same three types of establishments as all primary farmworkers: (1) 288,000 (58%) were in NAICS 1151 crop support establishments, (2) 103,000 (21%) were in NAICS 1113 fruit and nut establishments and (3) 31,000 (6%) were in NAICS 1112 vegetable establishments.
A closer look at workers whose maximum earnings were in particular NAICS codes found that 103,000, or two-thirds of the 154,000 directly hired fruit and nut workers, were employed by just one fruit and nut establishment. Similarly, over 288,000, or almost three-fourths of the 392,000 workers whose maximum earnings were in crop support, had only one crop-support employer, although crop support employees may work on multiple farms during the year. Over three-fourths of workers in livestock production were employed by one livestock establishment.
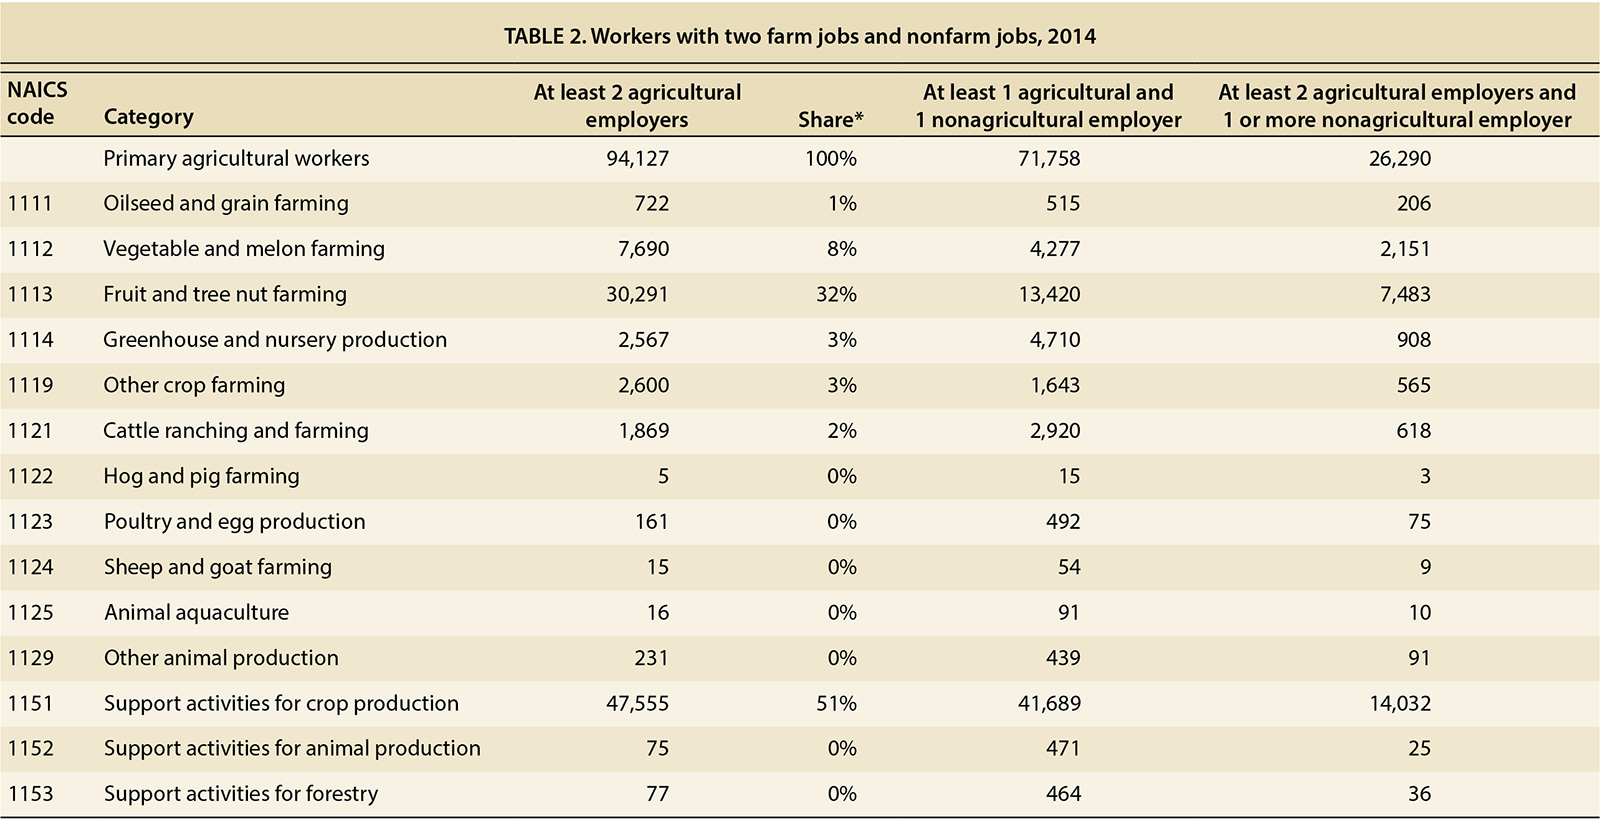
Third, there were 94,000 primary farmworkers with at least two farm employers in 2014. Of these, half had their maximum earnings from NAICS 1151 crop support establishments (table 2), but only an eighth of crop support workers had two farm employers. About 20% of those whose maximum earnings were from fruit (1113) and vegetable (1112) growers had at least two farm employers.
Almost 72,000 farmworkers had at least one farm and at least one nonfarm employer in 2014, and almost 60% of these workers had their maximum earnings from NAICS 1151 crop support establishments, followed by 18% whose maximum earnings were from fruit growers. The most common nonfarm jobs were in manufacturing; professional, scientific and technical services; and accommodation and food services.
Finally, some 26,000 workers whose maximum earnings were in agriculture had at least two farm employers and at least one nonfarm employer. Over half of these workers had their maximum earnings in crop support services and over a quarter in fruit and tree nut farming (table 2).
The combined 220,500 workers with at least two employers in 2014 were most often employed in the same county. For example, over 8% of these two-employer workers had two jobs in Kern County, followed by 6% with two jobs in Fresno County and 5% with two jobs in Monterey County.
Approximately 22% of workers with two jobs in 2014 were employed in 1113 fruits and nuts and 1151 crop support, followed by 5% to 6% who combined 1151 with 5613 employment services, 1113 fruits and nuts with another 1113 job, at least two 1151 crop support jobs, and 1112 vegetables with 1151 crop support.
In 2014, the average earnings for workers in the fruit and tree nut farming sector were $17,600.
Implications
The number of wage and salary workers employed on California farms is of great interest because of fears that farm labor shortages could reduce the state’s production of labor-intensive crops. Knowing how many wage and salary workers are employed sometime during the year gives a more accurate portrait of worker earnings and mobility. In 2014, agricultural employers hired over 829,000 unique workers, which suggests that two workers filled the average year-round equivalent job, meaning that the total farm workforce was twice average farm employment.
Although the unemployment insurance data do not include the characteristics of farmworkers, they do show that most farmworkers have only one farm employer during the year, which indicates that California has a very stable agricultural workforce. An earlier study reported almost three workers for each year-round farm job in the 1990s, and a higher share of workers with more than one farm job (Khan et al. 2004). Analysis of data for 2007 and 2012 finds that the ratio had dropped to two unique workers for each average agricultural job (Hooker et al. 2015). The 2014 analysis presented here shows that this two-to-one worker-to-job ratio has remained constant.
How many workers are employed in California agriculture?

