


All Issues
The evolving fresh market berry industry in Santa Cruz and Monterey counties
Publication Information
California Agriculture 70(3):107-115. https://doi.org/10.3733/ca.2016a0001
Published online August 01, 2016
NALT Keywords
Abstract
The fresh market berry industry in Santa Cruz and Monterey counties has contributed significantly to the agricultural vibrancy of the two counties and the state of California. Dramatic growth in strawberry, raspberry and blackberry production has been documented over the last 50 years, and most notably since the 1980s. Factors influencing this growth include innovations in agricultural practices and heightened consumer demand. Here, we review the historical context for the berry industry in Santa Cruz and Monterey counties. Organic production, production economics and challenges for the future are also discussed.
Full text
The fresh market berry industry in Santa Cruz and Monterey counties is an excellent example of transformation in the business of agriculture over the last 50 years. Located along the Central Coast of California, the two counties span the fertile Pajaro and Salinas valleys, and are well known for their amenable climate and production conditions, their diverse crop mix and grower demographics, and their developed agricultural infrastructure and support industries. The majority of the berry sector is comprised of strawberries (Fragaria × ananassa), raspberries (Rubus idaeus L.) and blackberries (Rubus spp.), with blueberries and other miscellaneous berries produced on a much more limited basis. Substantial research-based literature and historical information is available for Central Coast strawberries; however, despite the area's move towards greater production of raspberries and blackberries, less information exists for these crops. We seek here to provide a more complete portrayal and historical context for the berry industry in the Santa Cruz and Monterey area, which is the origin of the berry industry in California.
While the berry industry has been very successful in recent decades, it now faces new challenges, such as invasive pests and the phaseout of the soil fumigant methyl bromide. This article draws on previous and more recent research to discuss some of the influences that have contributed to the berry industry's dramatic expansion in Santa Cruz and Monterey counties, including selected innovations in agricultural practices and heightened consumer demand.
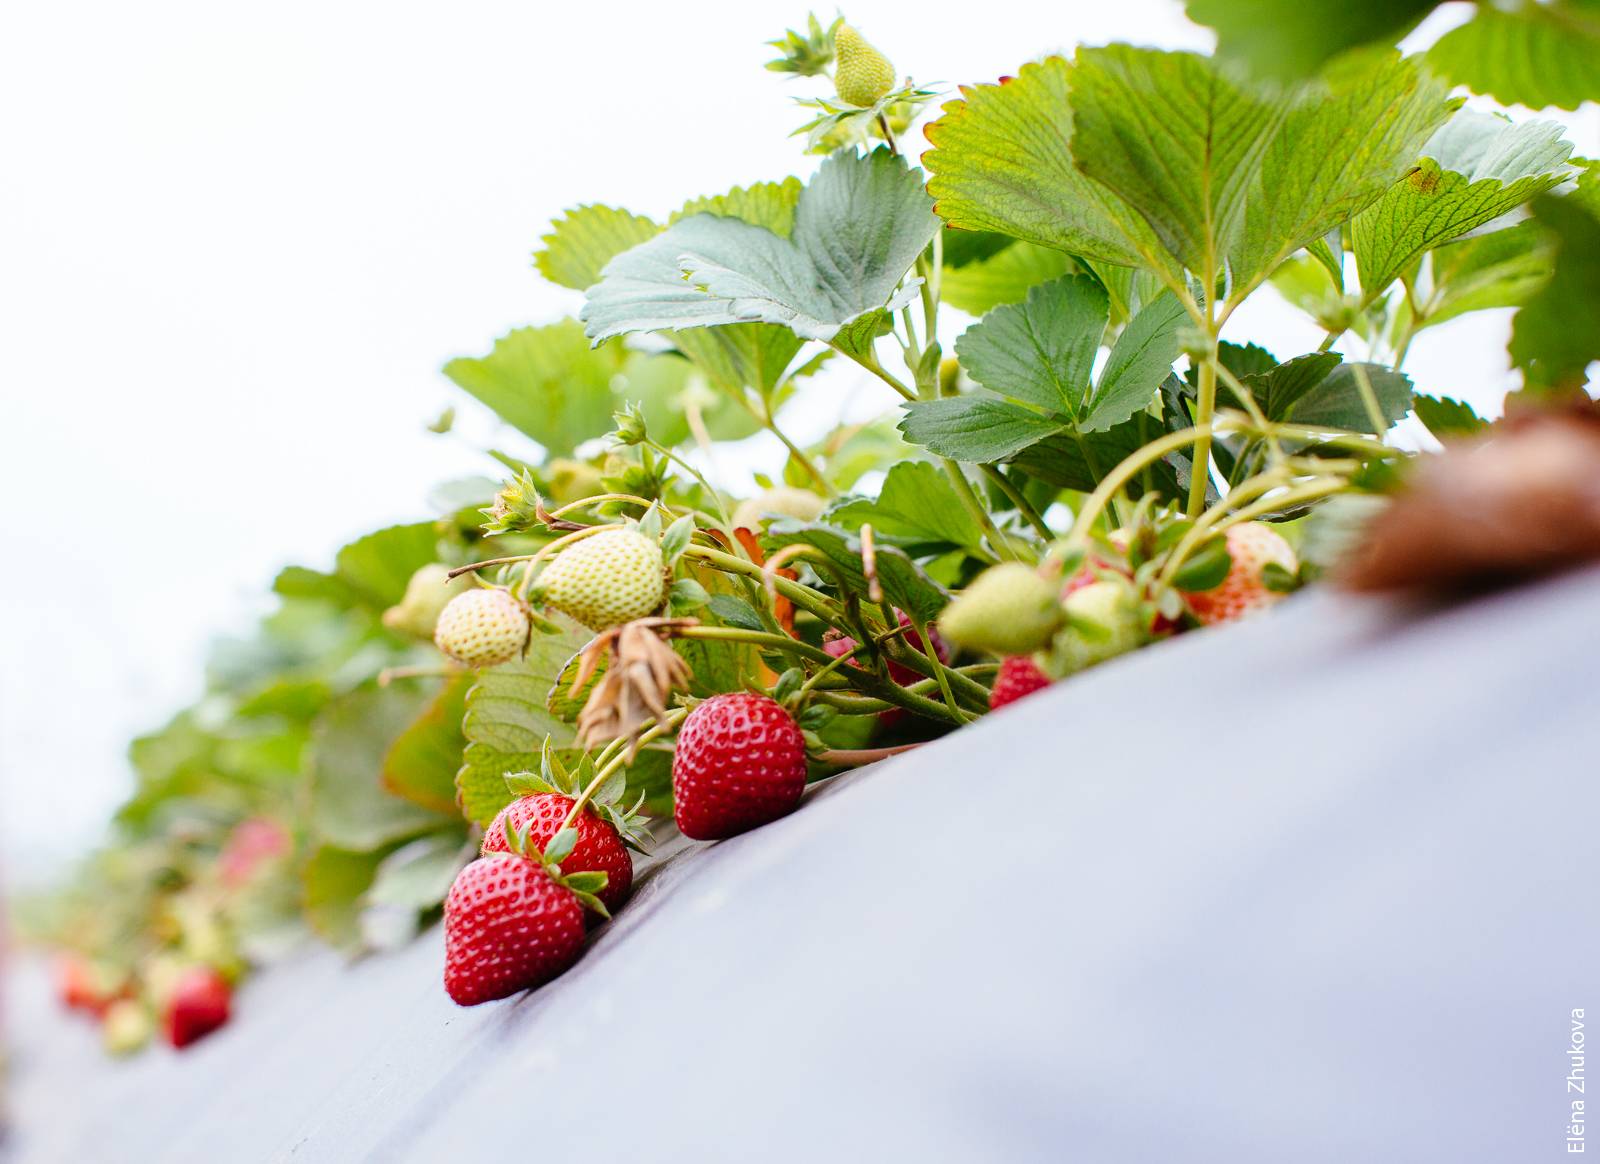
Plant breeding and cultural practices such as soil fumigation have contributed to the growth of the berry industry in Santa Cruz and Monterey counties.
Berry industry growth
During the 1960s and 1970s, the number of acres planted to berries, tons produced and value of production fluctuated. The fluctuations can be partly explained by farm management: in the past growers often rotated berry and vegetable crops to assist with soil and pest management, thereby influencing these statistics. However, annual crop reports from the county agricultural commissioners show that since the 1980s, berries have become increasingly important to each county's overall value of production, and by 2014 accounted for 64% and 17% of the total value of all agricultural products in Santa Cruz and Monterey counties, respectively (table 1). The industry's growth can be explained by a shift of some acreage out of tree fruits (e.g., apples, pears and apricots) and field crops (e.g., grains, dry beans and sugar beets), among others, into berries, and by additional acreage put into agricultural production.
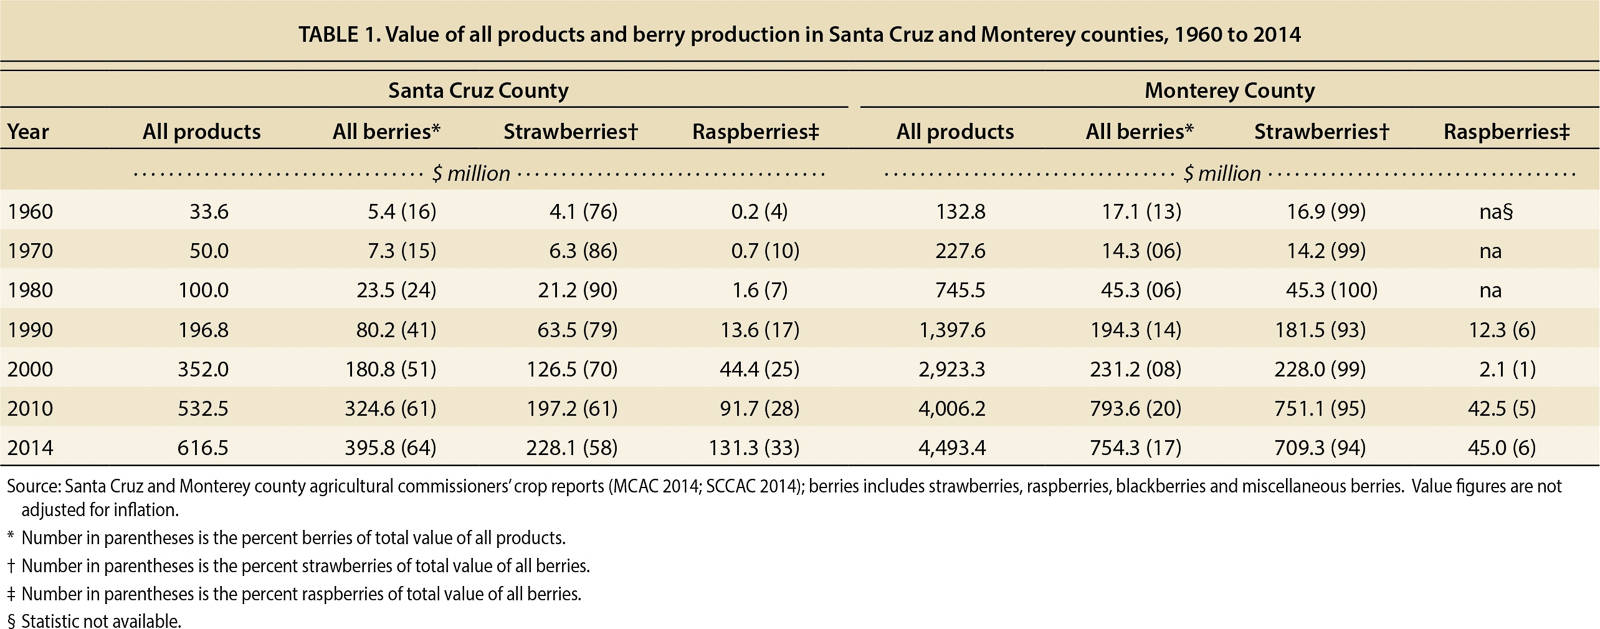
TABLE 1. Value of all products and berry production in Santa Cruz and Monterey counties, 1960 to 2014
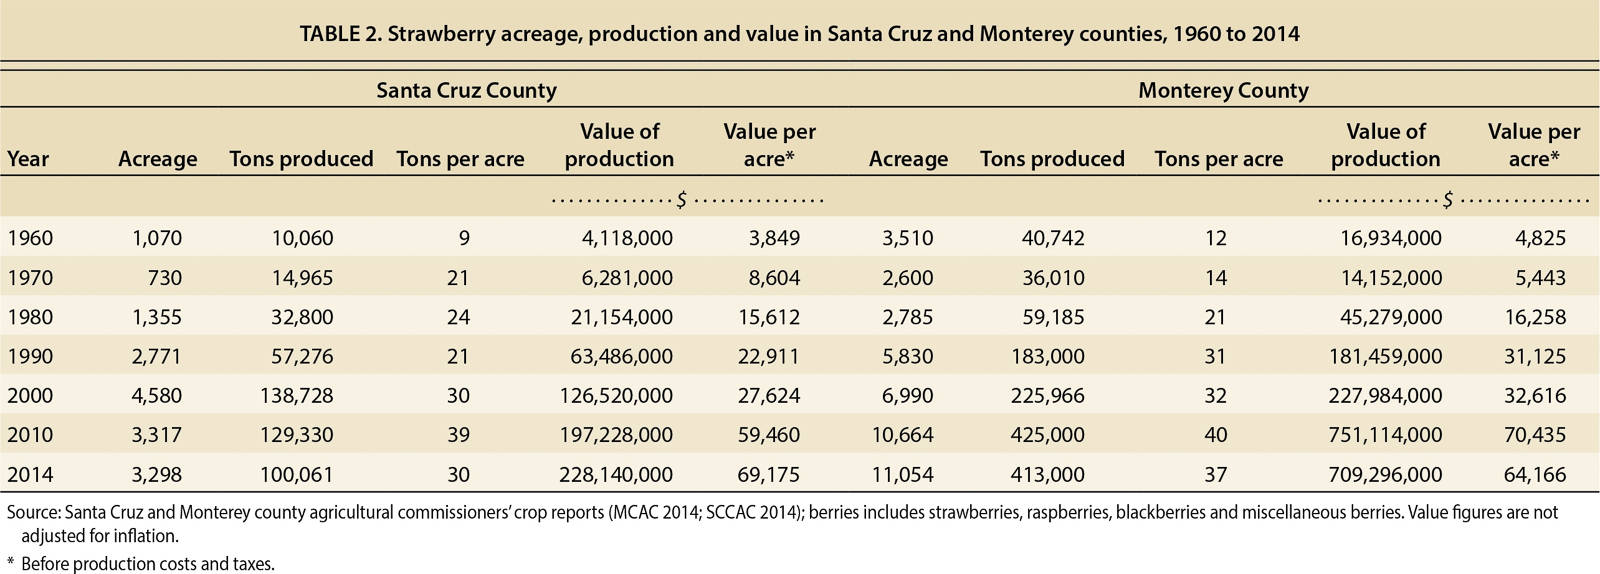
Strawberries are the undisputed leader in the berry sector and in 2014 represented 58% and 94% of the value of all berry production in Santa Cruz and Monterey counties, respectively (table 1), and 50% and 93% of all berry acreage (data not shown). Table 2 documents the remarkable expansion of the strawberry industry over time in both counties with respect to acreage, tons produced and value of production. Between 1960 and 2014, acreage more than tripled and production increased tenfold. The value of production, in real (inflation-adjusted) dollars, increased by 424% in Monterey County and by 593% in Santa Cruz County, reaching an astonishing combined value of nearly $1 billion in both 2010 and 2014. The gains in all statistical categories in Monterey County were enabled in part by an expansion of production into the southern reaches of the county where more and larger blocks of farmland are available, and where land rents are lower than in Santa Cruz and northern Monterey counties. However, from 2010 to 2014 Monterey County's tonnage and production values declined, possibly because the area has recently experienced a shortage of labor to harvest fresh market crops. Tonnage was also lower in Santa Cruz County, but production values increased. This may be because of the county's greater emphasis on local agriculture, organic production and direct market sales, which are often associated with higher crop values.
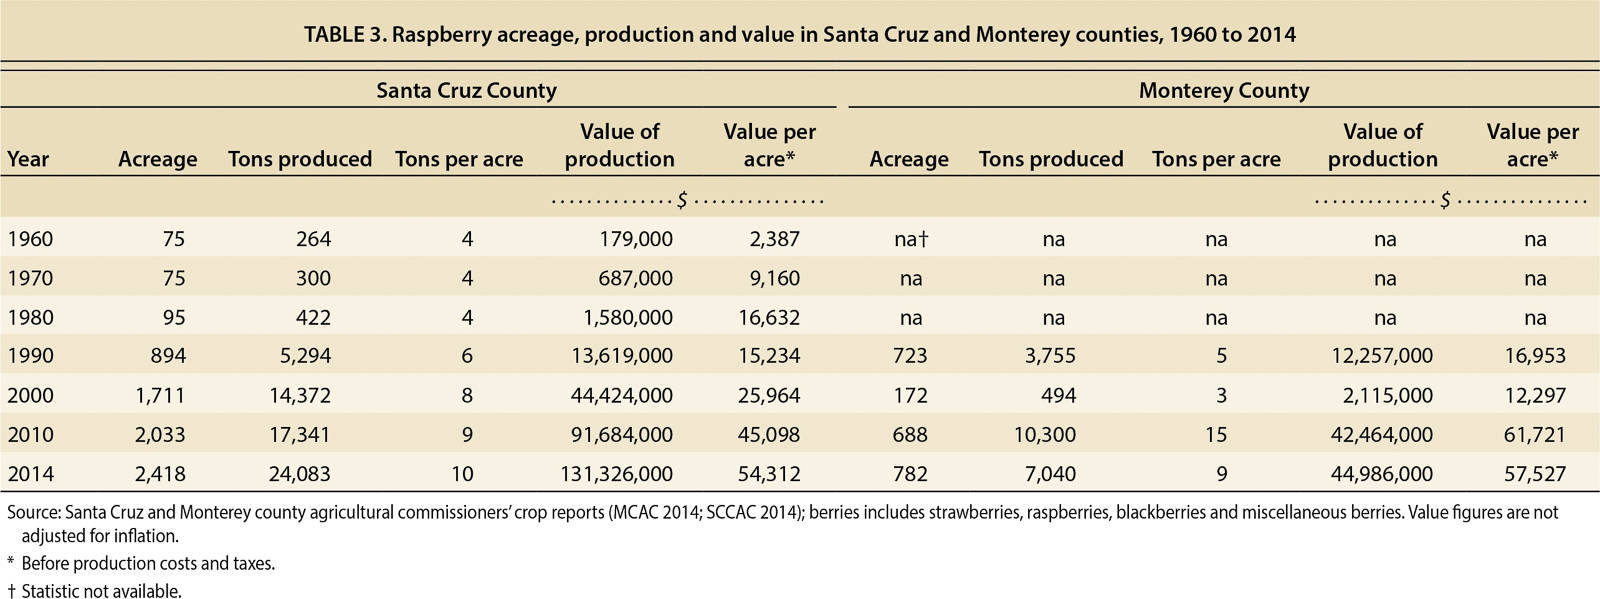
For raspberries, the acreage, tons produced and value of production grew steadily and most strikingly in Santa Cruz County (tables 1 and 3), where production conditions for caneberries (raspberries and blackberries) are optimal. For example, caneberry fields in Santa Cruz County are situated in areas that have well-drained soils and are protected from damaging winds. Also, fields are planted to take advantage of the growth and yield gains associated with southern exposures. Moreover, field-to-cooler travel distances are shorter in Santa Cruz County, which is critical for safeguarding the quality and marketability of these highly perishable crops. By 2014, raspberries represented 33% of the county's total value of production for all berries. In contrast, Monterey County raspberry production accounted for only 6% of the county's total berry value.
Blackberries have not been consistently reported as a separate category in archived statistical analyses, but instead were often included under the terms “bush- or miscellaneous berries”. Therefore, similar data for blackberry acreage and value of production cannot be reported here. However, between 1990 and 2010, Santa Cruz County agricultural commissioner crop reports reported an upward trend for the broad category with respect to acreage planted (up by 242%) and value of production (up by 596% in real dollars). In 2010, blackberries were promoted to a position of prominence in the report and shown as a separate statistic; at the same time, the miscellaneous berry category was shown to be very small indeed. Between 2010 and 2014, however, blackberry acreage and value of production leveled off and have shown only modest gains (data not shown). This may be because there has been less emphasis on production and market research and promotion for blackberries than for strawberries or raspberries. No comparable data are available for Monterey County.
The two counties have contributed significantly to California's total berry sector: in 2014, area strawberry acreage represented 35% of the statewide total, 37% of the total tons produced and 38% of the total value of production (CDFA 2015; USDA-NASS 2015). Area raspberry acreage represented 43% of the statewide total, 42% of the total tons produced and 39% of the total value of production. Comparable statewide statistics are not available for blackberries.
County agricultural commissioners’ reports show that the majority of all berries produced in the two counties — up to 98% — are sold as fresh market fruit (MCAC 2014; SCCAC 2014). In years with adverse production conditions or low prices, a higher percentage of the crop may be diverted to the freezer or processed products market. Fresh market fruit is handled and sold primarily through local grower-shippers; a much smaller share is sold directly to consumers through farmers markets, community supported agriculture operations, farmstands and other direct and intermediated market channels such as restaurants, independent grocers and schools.
Agricultural practices
Strawberries
Arguably the most momentous shift in cultural practices for strawberries was the introduction of preplant soil fumigants, beginning with chloropicrin (CP) in the 1950s and methyl bromide (MB) in the 1960s. Fumigation is a soil disinfestation practice that improves plant productivity and helps with the management of arthropods, nematodes, weeds, soilborne fungi and other plant pathogens. Some of the most difficult to control pathogens include Verticillium dahliae, Fusarium spp. and Macrophomina phaesolina. Without soil fumigation, these pathogens have the potential to completely destroy strawberry plantings. Early on, when CP and MB were mixed and applied together, the synergistic effects allowed strawberries to be produced as an annual rather than a biennial crop, and to be grown continuously on the same land without rotation to another crop, resulting in an increase in annual strawberry acreage. The use of fumigants also led to higher and more predictable yields and fruit quality, and further enabled the development of more stable markets for strawberries (Wilhelm and Westerlund 1994). Yields for strawberries statewide increased from a range of 2 to 4 tons per acre prior to the introduction of soil fumigants to 16 tons per acre by 1969 (Geisseler and Horwath 2014).
Additional cultural improvements included the development of both UC (public) and proprietary strawberry varieties uniquely adapted to coastal production conditions. Varieties were bred, for example, for disease resistance, yield and market potential. Notable UC-bred strawberry varieties include Tufts (1970s), Pajaro, Douglas, Chandler, and Selva (1980s), Camarosa and Seascape (1990s), and Aromas, Albion and Monterey (2000s). Irrigation practices also evolved, shifting from furrow irrigation in the 1960s to drip irrigation in the 1980s, which led to further improvements in plant disease management and greater water use efficiency. These and other enhancements meant that by 2012, yields could exceed 35 tons per acre (Geisseler and Horwath 2014). More recently, the strawberry industry has focused on “fine-tuning” fertility and water management for more efficient resource use, along with additional yield and fruit quality improvements (Bottoms, Bolda, et al. 2013; Bottoms, Hartz, et al. 2013).
The Santa Cruz–Monterey area is also recognized for its early experience with conversion of conventional strawberry production to organic management (Gliessman et al. 1996). Organic strawberry production was shown to result in lower yields, which, when offset by premium prices could potentially offer higher net returns (revenue) to growers. The importance of crop rotation for disease management was not addressed in the initial study by Gliessman et al. (1996) but has since been the focus of additional research, as have more complete analyses of the economics of organic strawberry production (Bolda et al. 2006, 2014). Growers and area researchers continue to collaborate and advance organic strawberry production techniques. Most notably, a long-term research commitment has been made to determine organically acceptable disease management practices such as anaerobic soil disinfestation (Shennan et al. 2009), the use of commercially available soil-applied biological organisms and the incorporation of soil amendments such as mustard seed and its derivatives. The area is now seen as a global leader in organic strawberry research, and in 2012 the first organic strawberry production manual was published by UC Agriculture and Natural Resources (Koike et al. 2012).
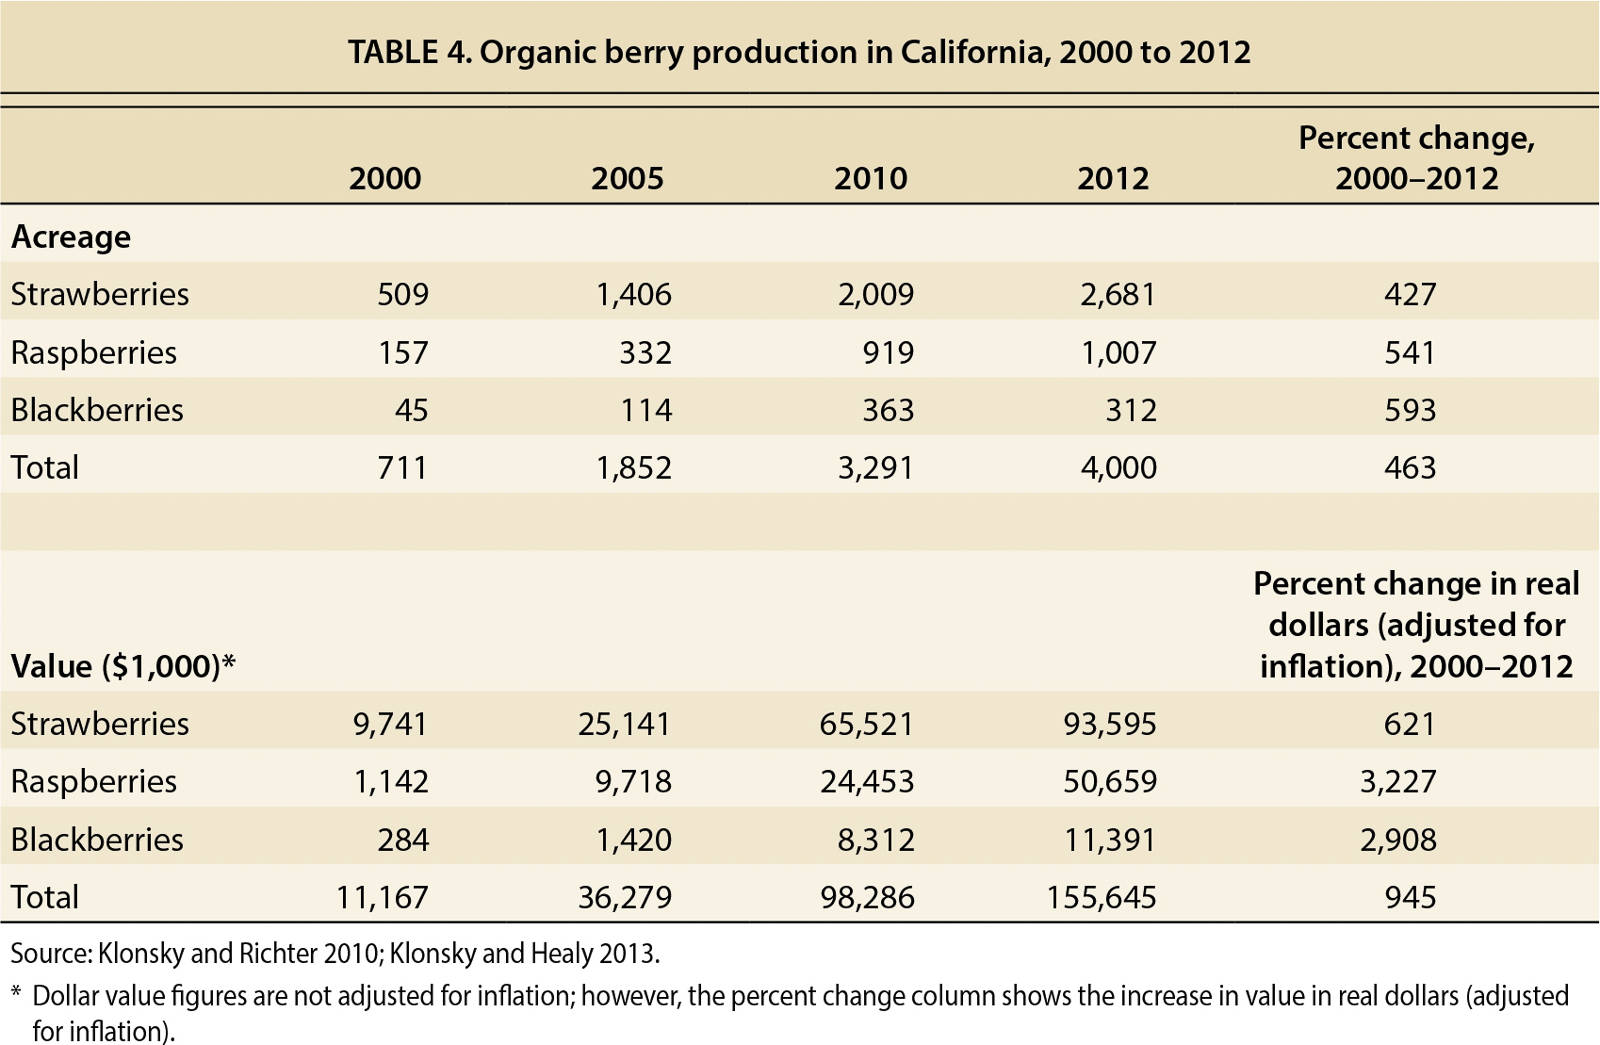
Statistics documenting expansion of the organic strawberry industry over time are not available on a county-by-county basis, but statistics for California show prodigious growth in acreage (up by over 400%) and value of production: from $9.7 million in 2000 to $93.6 million in 2012, a 621% increase in real dollars (table 4).
Caneberries
Like strawberries, raspberries and blackberries have benefitted from enhancements in cultural practices. When well-managed, both types of caneberries can produce crops for up to 20 years. However, to maintain acceptable quality and yield Central Coast growers typically manage raspberries and blackberries so that they produce two and five crops, respectively, prior to removal and replanting.
In Santa Cruz County, raspberry production was relatively flat in the 1960s and 1970s, but began to increase substantially in the 1980s (table 3). This can be explained by a shift from floricane, or spring-bearing varieties, to the then newly developed proprietary primocane, or fall-bearing varieties, that do not carry the productivity constraints associated with the inadequate chill (plant cold conditioning) requirements along the Central Coast. Primocane-bearing varieties allow growers to successfully produce a high quality raspberry crop in low- or no-chill coastal locations, and further manipulate time to harvest and yield with pruning and other management practices (Finn and Clark 2011). Between 1990 and 2014, the number of acres planted to Santa Cruz and Monterey area raspberries almost tripled, tons produced increased by about 350% and the value of production was up by over 400% in real dollars (table 3).
Santa Cruz County raspberry growers began to experiment with and adopt field-scale semi-permanent protective structures or tunnels in the 1990s and 2000s (Gaskell 2004). Initially developed in Europe, field-scale tunnels allow growers to extend their production seasons, enhance yield and fruit quality, and capture high off-season prices for fresh market fruit (Gaskell 2004). The controlled environment, and resulting security of production, also allows for greater market stability. Tunnel culture is now a common practice in raspberry production. This shift away from open-field production to protected cropping, along with breeding improvements, has had lasting impacts on the raspberry industry and its expansion.
Cultural improvements geared towards fresh market blackberry production are more recent and include advances in breeding for thornless varieties and quality attributes (color, flavor and firmness [Finn and Clark 2011]). In 2011, a public primocane-bearing blackberry variety (Prime-Ark 45) became commercially available for the first time and is now being planted in the area. Since that time, additional public and proprietary primocane-bearing varieties have been in development; some have already become available. Open-field production was the norm until recently, but to ensure marketable fruit of high quality, and as growers have shifted additional acreage to primocane-bearing varieties, tunnel culture has been more widely adopted and, based on discussions with growers, is now estimated at roughly 80% of the acreage.
Like organic strawberries, remarkable growth in the statewide production of organic raspberries and blackberries was documented between 2000 and 2012 (table 4). Acreage climbed by over 500% in both organic berry categories. Value of production was up over 3,000% in real dollars for organic raspberries and up by almost the same percentage for organic blackberries. It is important to note that although the organic raspberry and blackberry categories have demonstrated extraordinary growth, they still represent a relatively small percentage of all berry production in the area.
Consumer demand
Research points to several factors that have spurred consumer demand for all berries. Berries contain bioactive compounds, including essential vitamins, minerals, fiber and antioxidants that contribute to healthy diets, and that help to reduce the risks associated with some chronic diseases and cancers (Nile and Park 2014; Seeram 2010). This information has been widely shared with consumers through, for example, government programs promoting healthy eating (CDC 2015; USDA 2015), and more generic berry promotion programs (Cook 2011). Per capita consumption of fresh strawberries in the United States almost doubled from 1994 to 2014, increasing from 4.1 to 8.0 pounds (USDA-ERS 2015). U.S. per capita consumption of fresh raspberries was small by comparison, at just 0.5 pounds in 2014. Similar consumption data are not available for blackberries, but Cook (2011) notes that consumers generally view berries as complementary, and that sales for all berries have increased. Indeed, in 2014, berry sales (in U.S. dollars) increased 5.8% over 2013; berries were the number one produce category for U.S. grocery retailers, at $5.7 billion in annual sales (CSC 2015; Nielsen 2015).
Some berry operations also benefit from their proximity to the area's urban centers, which have sizeable cohorts of educated, high-income consumers who generally demonstrate an interest in health and wellness, local agriculture and fresh and organic products. In addition to the more traditional grower-shipper and direct marketing channels, new technology-driven food marketing companies — virtual food hubs — have evolved to cater to this demographic. They promote the values of sustainable communities, local food economies and business integrity and transparency, all important attributes for new 21st century consumers (Hartman Group 2014, 2015). These companies form relationships with local growers, provide some technical and market support, and enhance sales and engagement with consumers. It is not yet clear what impacts these still-niche marketing businesses may have on the industry in total. However, growers have responded to the various health and market signals by ramping up production of both conventional and organic products, berries included.
Production economics
Specialists and farm advisors with UC Cooperative Extension (UCCE) have performed economic analyses for Santa Cruz and Monterey county fresh market berry crops for decades (UCCE 1969–2014). The studies estimate production costs for a representative enterprise based on characteristics common to the area's farms. Data are collected from established growers, input suppliers and other industry experts so that a diversity of operations and practices are taken into account. Since 1990, UCCE researchers have used a farm budget software program to analyze the data and present results in several formats detailing costs for cultural and harvest practices, monthly cash costs and business and investment overhead costs. The studies also include an analysis estimating net returns to growers for several yield and price scenarios. Representative costs for food safety and environmental quality programs have been incorporated into more recent studies as they have evolved to become standard business practices. The resulting production and economic information is specifically designed to assist growers, bankers, researchers and government agencies with business and policy decisions.
Strawberries
The first economic analysis of fresh market strawberry production for Santa Cruz and Monterey counties was performed in 1969; at least one subsequent analysis has been conducted every decade since then. Though the level of detail and data included in each study has changed over time, some interesting trends can be noted. Annual land rent climbed from $150 per acre in 1969 to $2,700 in 2014, representing 2.5% and 5.5% of total production costs, respectively. The cost of soil fumigation for conventional strawberry production (a contracted service) increased from $350 per acre in 1969 to $3,302 in 2010, representing 5.5% and 6.9% of total production costs, respectively. Production year water use gradually decreased from 80 acre-inches per acre in 1969 to 36 acre-inches by 1996 as drip irrigation became the standard. The amount of water used to bring a crop to harvest has remained roughly the same since that time; however, growers and researchers continue to investigate methods to increase water use efficiency even further. In some areas, soil types and fields, growers have been able to reduce per acre water use by several acre-inches more (Bolda et al. 2011, 2014). When the above costs and water usage are assessed on a per ton rather than a per acre basis, production practice cost increases are less notable, and water savings even greater. Labor-intensive practices such as hand weeding and harvest are consistently shown as costly line items relative to other operations.
Representative yields for conventionally produced fresh market strawberries rose from 20 tons per acre in the 1969 study to 30 tons in 2010, an increase of 50%. Even higher yields are discussed for some varieties and production conditions; county production statistics confirm that higher yields are indeed possible (table 2). Representative yields for organic strawberries, studied over a much shorter time period, rose from 15 tons per acre in 2006 to 17 tons in 2014, an increase of 13%. As more research is directed towards organic agriculture in general and strawberries in particular, yields will likely increase even more with time. Recent efforts include improvements in cultivar breeding, cultural practices and disease management, especially soil pathogen management.
The most recent economic analyses for conventional, second year conventional and organic strawberry production were performed in 2010, 2011 and 2014, respectively. Second year conventional strawberries, or those producing a crop for a second year after having produced the first without replanting, represent about 15% of the total strawberry acreage in the area. Similarities and differences in total, cultural and pest management costs for the three management approaches are shown in figures 1 to 3.
Total costs for conventional strawberries were $47,882 per acre and include expenses for all practices from land preparation to harvest (fig. 1). For the second year conventional strawberry crop, total costs were lower at $32,798 per acre, reflecting a reduction in expenditures for land preparation and reduced harvest costs because of lower yield. For organic strawberries, total costs were $49,044 per acre, slightly higher than for conventional production, mostly due to higher soil fertility input costs.
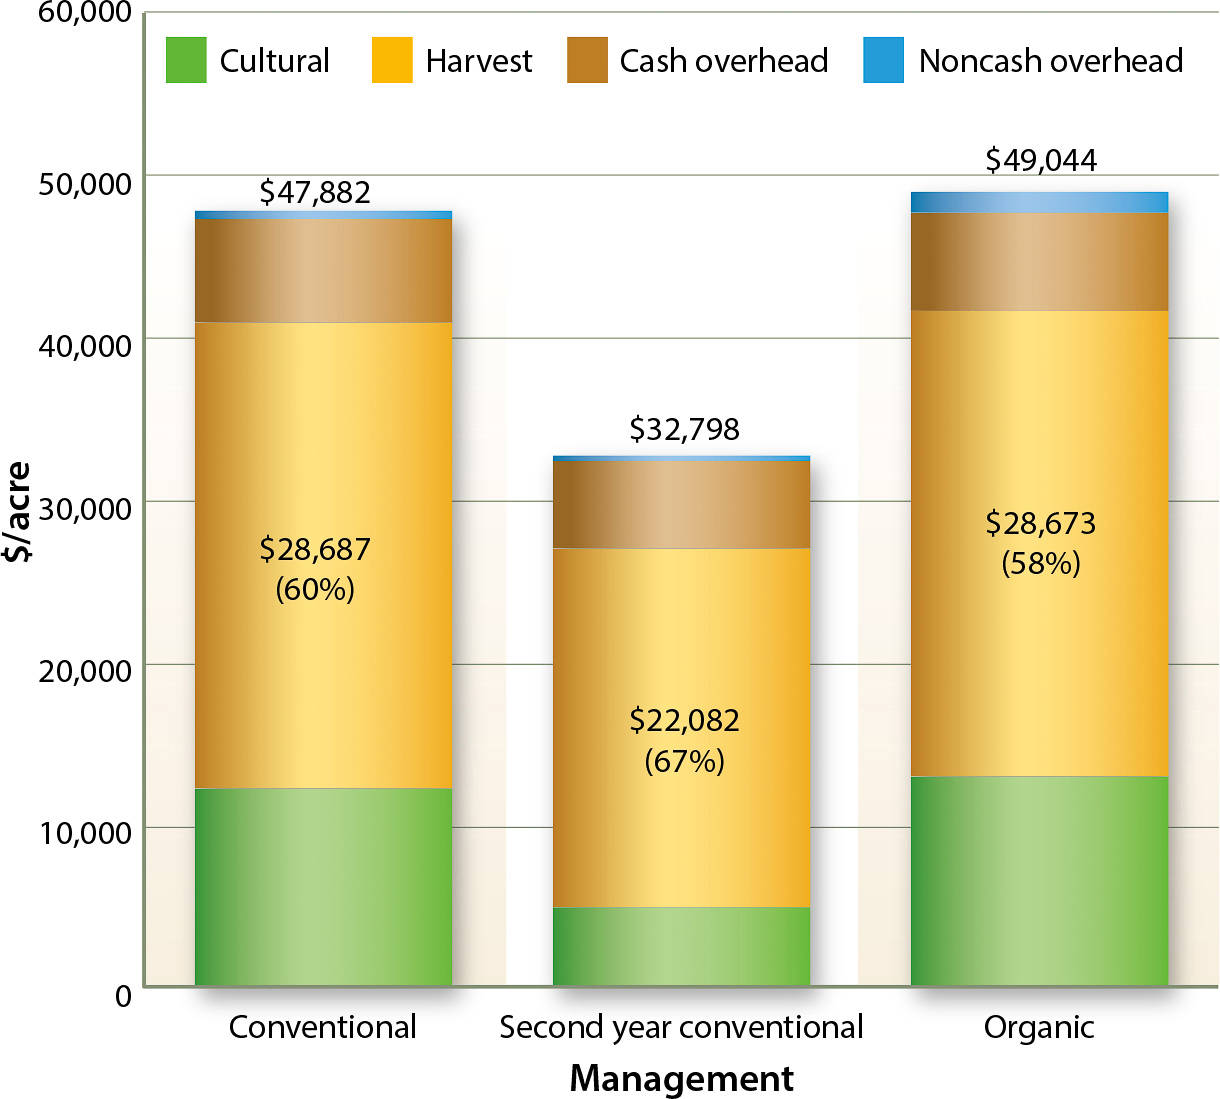
Fig. 1. Total costs for Santa Cruz–Monterey area conventional (2010), second year conventional (2011) and organic (2014) strawberries.
Harvest, a labor-intensive practice, clearly represents the lion's share of total costs, at 58% in organic production, 60% in conventional production and 67% in second year conventional berries. Cultural costs represent 26% of total costs in the conventional and organic systems, but only 15% for second year strawberries because there were no associated planting costs, and because pest management costs were lower (fig. 2).
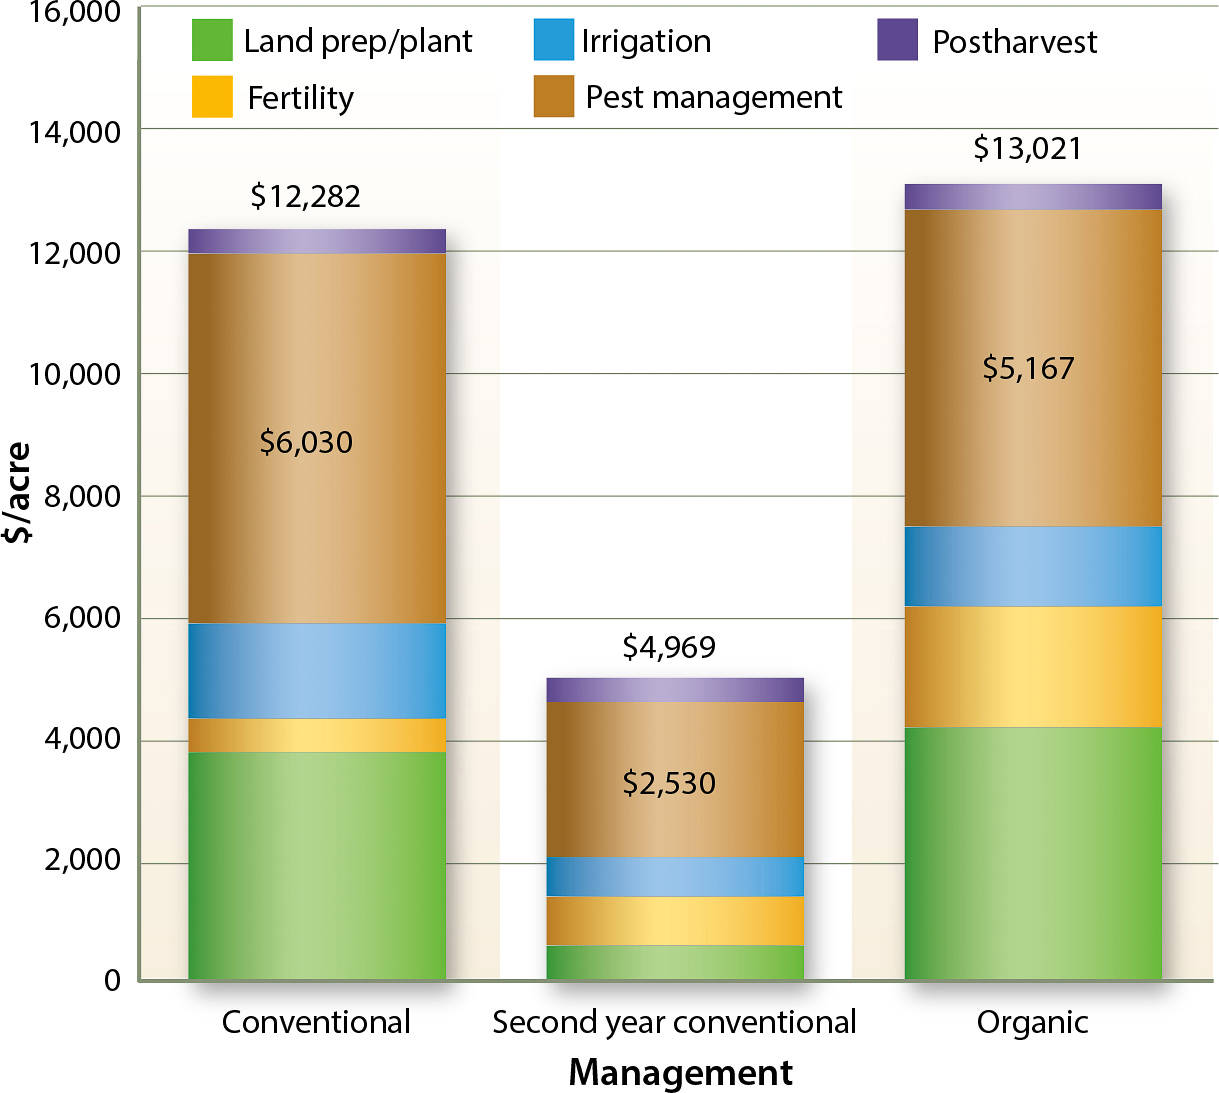
Fig. 2. Cultural costs for Santa Cruz–Monterey area conventional (2010), second year conventional (2011) and organic (2014) strawberries.
Looking more closely at pest management, soil fumigation is the highest cost category for conventional production at $3,302 per acre, with weed control, another labor-intensive practice, the highest cost in second year and organic strawberries at $1,212 and $2,506 per acre, respectively (fig. 3). However, for organic strawberries the cost to control insects ran a close second at $2,488 per acre, which was dominated by control for lygus bug (Lygus hesperus) with a bug vacuum, and two-spotted spider mite (Tetranychus urticae) with the release of predatory mites. By comparison, estimated costs for insect control in conventional strawberries were lower at $702 per acre and still lower at $579 in second year conventional berries.
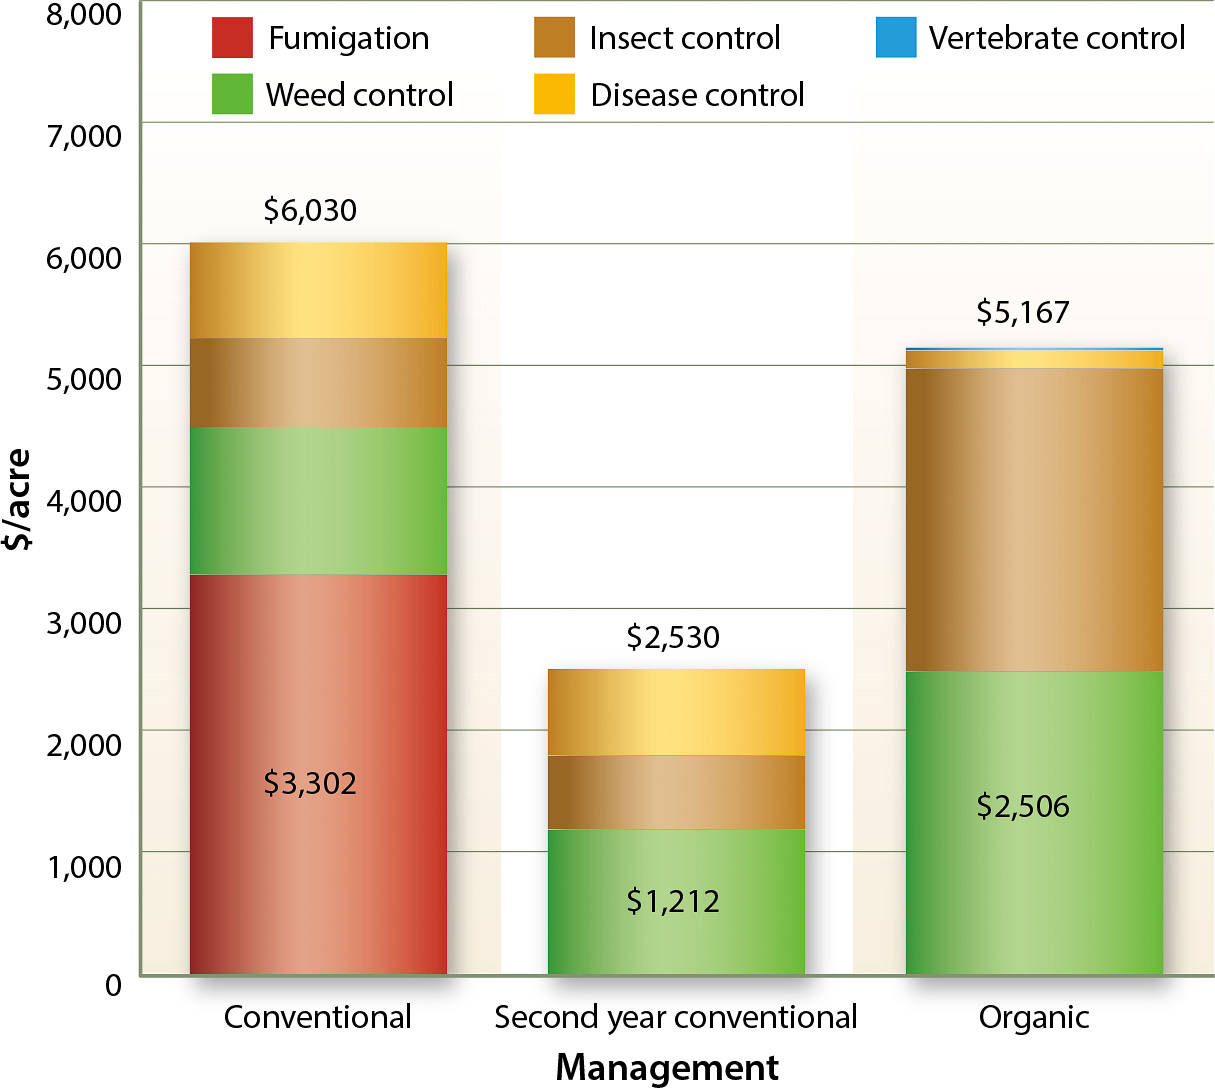
Fig. 3. Pest management costs for Santa Cruz–Monterey area conventional (2010), second year conventional (2011) and organic (2014) strawberries.
Caneberries
Raspberry and blackberry production were not routinely studied in years prior to 2003. Since then, several primocane-bearing raspberry and floricane-bearing blackberry cost and return analyses have been performed, with the most recent studies conducted in 2012 and 2013, respectively. Both studies detail establishment and first year production and harvest costs for not-yet-fully-mature crops. For raspberries, first year of production includes a $12,460 per acre construction, management and investment cost for protective tunnels. Costs for a mature raspberry crop are analyzed in the second production year and total $48,210 per acre (fig. 4). For blackberries, costs for a mature crop are shown for the second through fifth production years, and total $43,406 per acre per year.
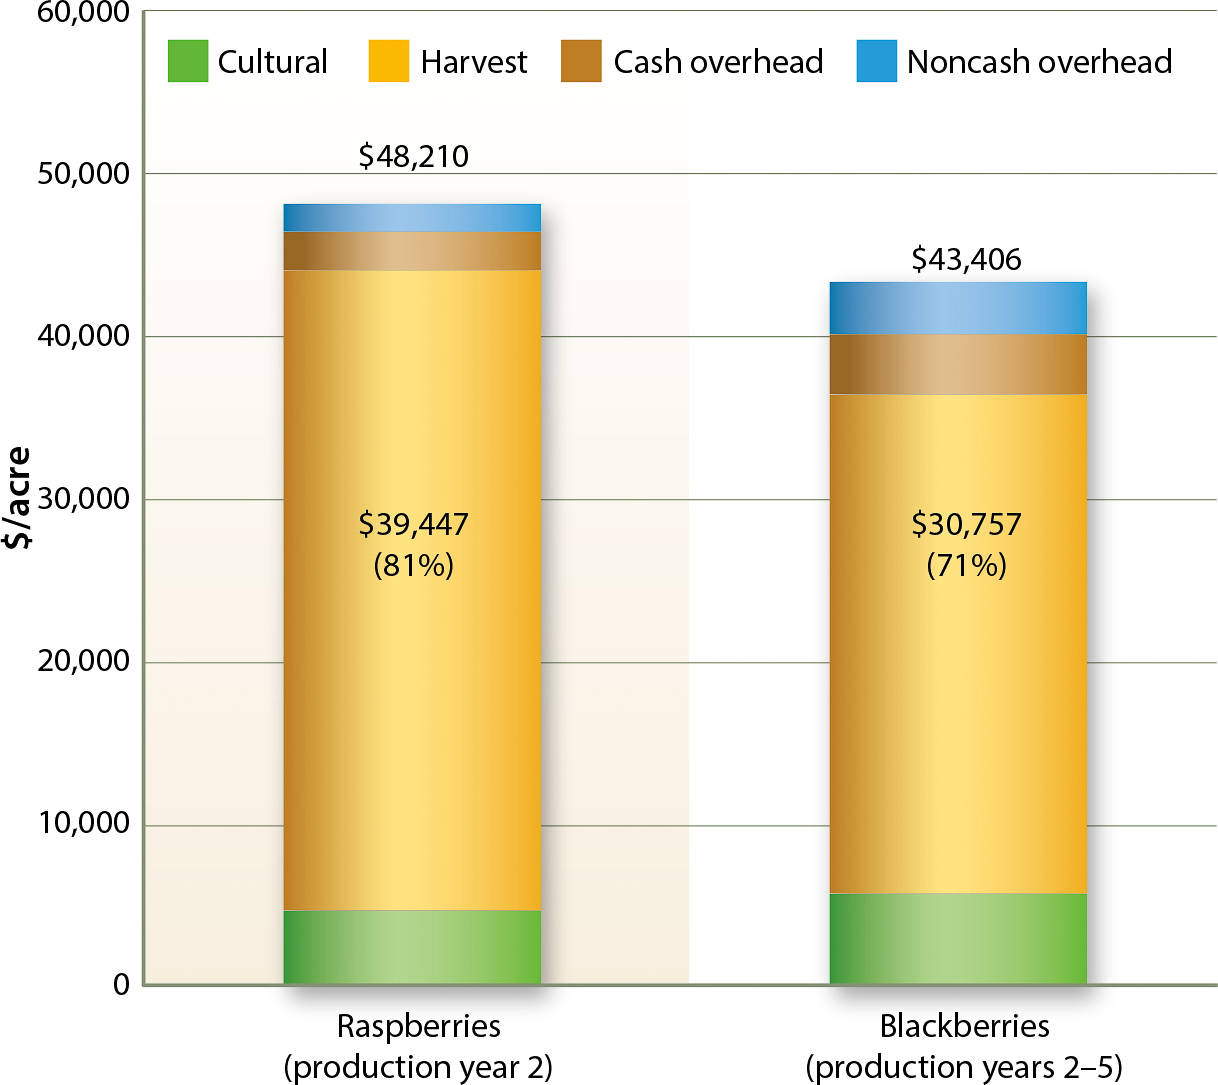
Fig. 4. Total costs for Santa Cruz–Monterey area mature caneberries: raspberries (2012) and blackberries (2013). Source: 2012 Sample Costs to Produce Fresh Market Raspberries – Primocane Bearing – Central Coast Region; 2013 Sample Costs to Establish and Produce Fresh Market Blackberries – Central Coast Region. http://coststudies.ucdavis.edu .
Harvest costs again represent the vast majority of total costs, at 81% and 71% of total costs for raspberries and blackberries, respectively. For raspberries, cultural costs represented a much smaller share of total costs at $4,656 per acre, roughly half of which ($2,038) was for trellis and tunnel management. Blackberry cultural costs totaled $5,709 per acre, of which over half ($3,060) was for pruning and training canes.
Net returns and other costs
Each study also includes an analysis of potential net returns to growers above operating, cash and total costs for a range of yields and prices. When evaluating net returns above total costs, gains are shown for higher yield and price points; losses are also documented at many lower yields and prices (tables 5 and 6). Farms with productive soils, experienced managers, optimal production conditions and robust market plans generally realize higher net returns. In contrast, farms with less-than-optimal production conditions, reduced yields, poor fruit quality or inexperienced managers may contribute to lower net returns. Results from the strawberry analyses show that on a per acre basis, organic strawberries tend to be more profitable than conventional berries, even with lower yields. Organic price premiums explain the result; in this example price per tray for organic strawberries ranged from $12 to $18, while price per tray for conventional berries ranged from $7.30 to $11.30. Prices for second year conventional strawberries were slightly lower still to account for a portion of the crop that was diverted to the freezer market. Net returns for both caneberries were mostly positive.
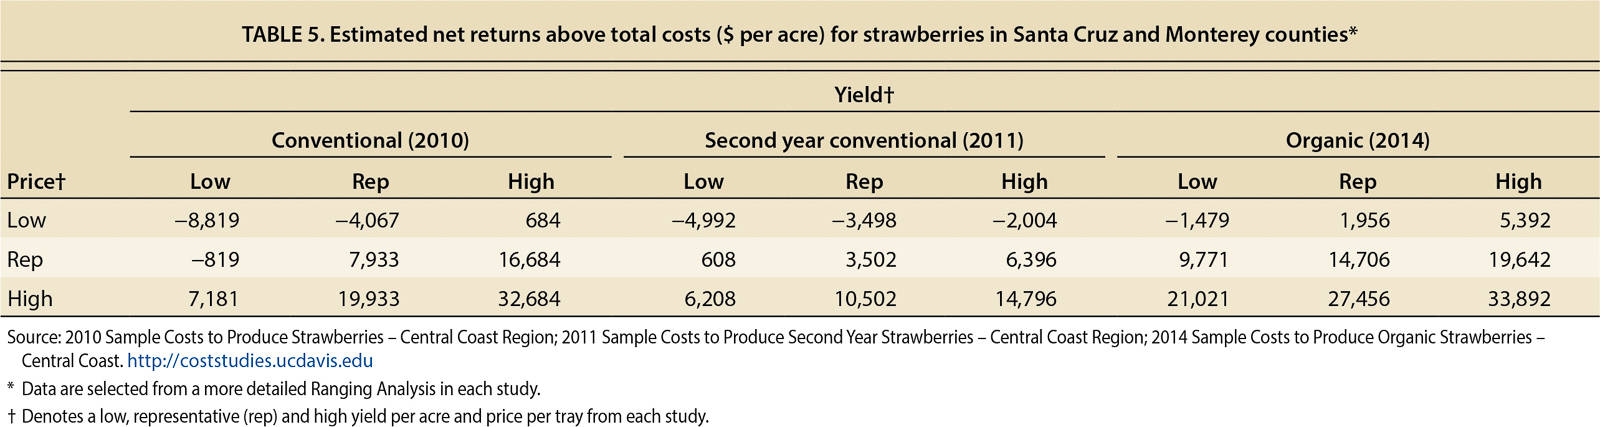
TABLE 5. Estimated net returns above total costs ($ per acre) for strawberries in Santa Cruz and Monterey counties*
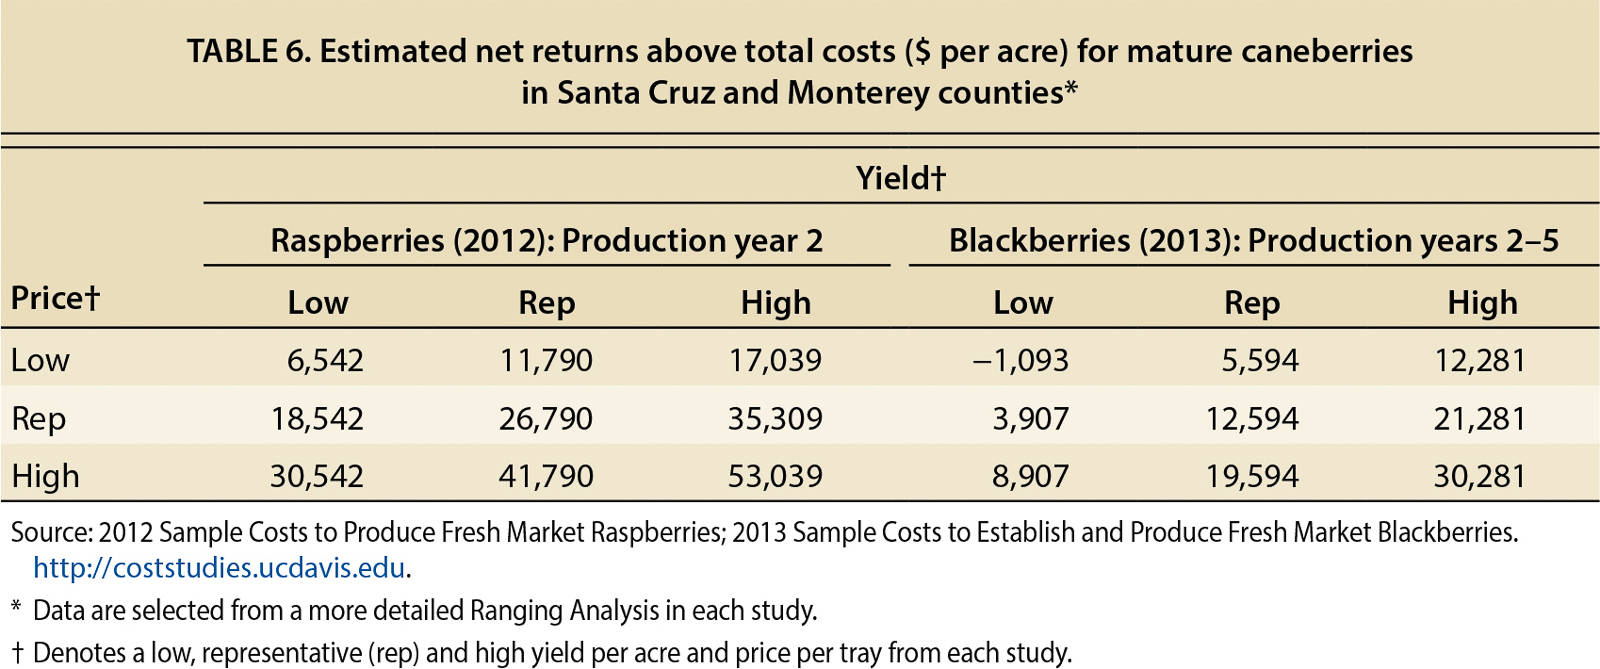
TABLE 6. Estimated net returns above total costs ($ per acre) for mature caneberries in Santa Cruz and Monterey counties*
Other noteworthy entries in all recent berry studies include per acre costs for pest control advisers (PCAs), management of invasive pests and food safety and regulatory programs for water and air quality. Though each alone represents a relatively small portion of total costs, they provide readers with insights into the changing nature of berry production activities and costs over time.
Challenges remain
Cultural practices in the berry industry have evolved to address changes in soil, water and pest management needs. New varieties have been developed to enhance yield and quality attributes. Based on historical trends, and to meet both industry needs and consumer demands, we expect to see new varieties continually developed over time. Businesses have responded to consumer and market demands for fresh, safe and organic products by implementing food safety programs and/or transitioning more lands to organic production. Water and air quality programs have been developed to comply with state regulatory requirements. In the past, growers customarily hired those with expertise in financial and market management; they now also enlist the support of experts in food safety, organic agriculture and environmental quality to assist with farm management.
But challenges remain, and management of key agricultural risks — including those for production, finances, marketing, legal and human resources — have become increasingly important. Invasive pests pose significant management and regulatory constraints and increase production, financial and market risks. Two recent examples are light brown apple moth (LBAM [Epiphyas postvittana]) and spotted wing drosophila (SWD [Drosophila suzukii]). LBAM infestations can lead to loss of part or all of the crop because of field closure from regulatory actions, increasing production and financial risk. SWD presents substantial market risk to growers in that its larvae can infest fruit and render the crop unsaleable. Growers minimize the risk of loss from these two organisms with the routine use of PCAs. PCAs monitor fields more frequently than growers alone would be able to do, identify pests and recommend actions, for example, the use of pheromone mating disruption for LBAM and field sanitation for SWD.
Since their introduction, the soil fumigants CP and MB have unquestionably contributed to the expansion of the berry industry. However, the full phaseout of MB as a pest management tool — it will no longer be available for use in berry production after 2016 — presents both production and financial risks. While a substantial research commitment has been made to finding alternatives to MB, nothing has yet come close to offering the same level of protection from the large-scale loss to soil pathogens or the gains in productivity associated with the application of CP and MB as synergistic preplant fumigants. We anticipate that the berry industry will adapt to the MB phaseout by using alternative fumigants and preplant soil treatments, but these are likely to carry a higher level of risk for berry production in the short term and may lead to a decrease in planted acreage and production. However, this may also stimulate an even more robust research agenda directed towards soilborne diseases and plant health to minimize disruption to the industry. Reliance on fumigants as the primary strategy for pest management is almost certainly a thing of the past. Instead, adoption of integrated approaches, including alternatives to fumigants, to manage diseases, weeds and other pests will be key to sustaining berry production over the longer term (Carpenter et al. 2000; CDPR 2013).
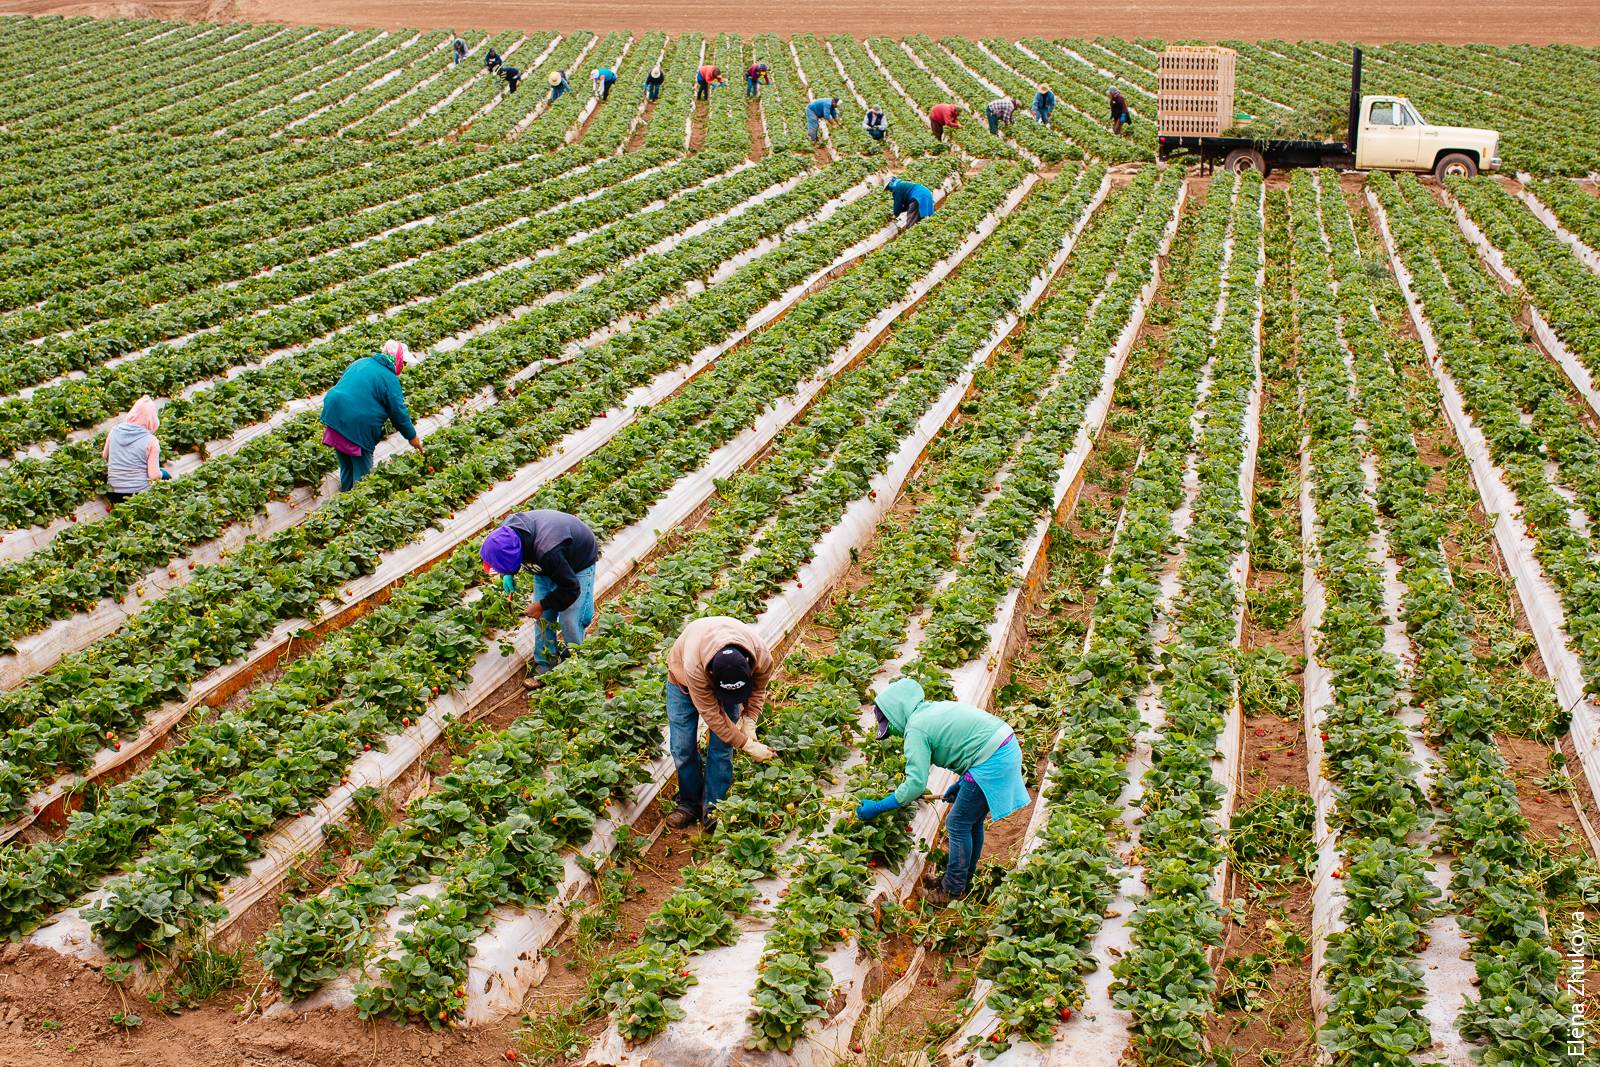
Labor is also a current and significant challenge for growers of berry crops. Social and demographic changes in Mexico — the source of a majority of the area's agricultural labor — have resulted in markedly lower immigration rates into the United States, a shrinking labor pool and upward competition and wage pressures for the agricultural workers who remain (Taylor et al. 2012). In recent years, growers have reported difficulty in securing and retaining sufficient numbers of workers to ensure timely and effective farm operations. The lower production figures seen in strawberries in 2014 may in part have been the result of an insufficient labor pool from which to draw (table 2). However, no known regional employment or wage data are available to specifically document this. Some growers minimize labor risk by paying higher wages and providing year-round employment when possible. However, these strategies can be difficult for some businesses to justify economically.
Between 1960 and 2014, strawberry acreage in the Santa Cruz and Monterey area more than tripled and production increased tenfold. In 2014, the area represented 35% of the state's strawberry acreage.
Arguably, the area's berry industry, and agriculture more generally, increasingly face political risk. Immigration legislation that may assist with the current labor challenge languishes at the federal level, with major policy changes unlikely before 2017 (Martin 2015). Farming practices are under ever more scrutiny by consumers, local municipalities and state and federal agencies. Soil fumigants and pesticide use have been the focus of many intense debates and discussions, especially in Santa Cruz and Monterey counties. At the time of this writing, several new regulations related to pesticide application notifications, pesticide and fumigant application buffer zones and worker safety have been proposed by the California Department of Pesticide Regulation or the U.S. Environmental Protection Agency but have not yet been finalized. It is anticipated that implementation will begin in 2017, with full compliance required in 2018.
And, as California struggles through a fifth year of drought, water use, quality and cost has become a more robust part of the local, state and federal discourse, with directives issued and new legislation proposed. Compliance with each new directive or regulation presents production and logistical challenges for growers and can be costly to manage. Although it is unlikely that regulatory pressures will lessen in the future, there is every expectation that growers will continue to adjust business practices to meet or exceed any new requirements or standards. The economic sustainability of individual farming operations and the area's berry industry in total will ultimately be impacted by and continue to evolve with the ever changing business environment, and by an array of risks and challenges.
The evolving fresh market berry industry in Santa Cruz and Monterey counties

